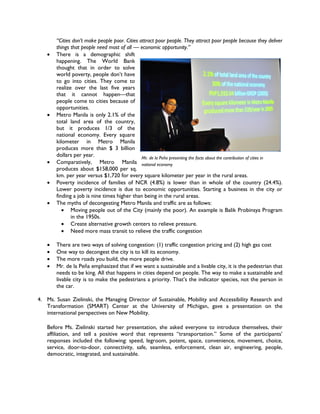
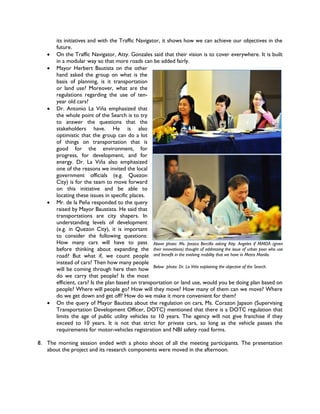
Catalyzing New Mobility in Cities:
 The Case of Metro Manila
Catalyzing New Mobility in Cities:
 Inception Meeting Documentation Report
The Case of Metro Manila


NOVEMBER 2011
The Report was prepared by the Ateneo School of Government for the
Rockefeller Foundation
EXECUTIVE SUMMARY

The Ateneo School of Government’s iBoP Asia (Innovation for Inclusive Development) Program with support
from Rockefeller Foundation is implementing a project entitled “Catalyzing New Mobility in Cities: The Case of
Metro Manila”. This project aims to use New Mobility as a lens in search of more sustainable and innovative
solutions in the transport sector, especially in Metro Manila, that address problems of the poor and the
vulnerable.

The Inception Meeting was held last October 27, 2011 in Gateway Suites, Cubao, Quezon City and was
attended by total of 44 participants from various Local Government Units of the Cities of Quezon, Makati,
Marikina, and Mandaluyong; National Government Agencies (Department of Transportation, Metro Manila
Development Authority); Non-government Organizations and corporate foundation (Manila Observatory,
CAI-Asia, Gawad Kalinga, PLDT-Smart Foundation); the private sector (Ayala land, Inc., Ortigas Center
Association Inc.); development organization (The Rockefeller Foundation); and research and academic
institutions (Ateneo De Manila University, UP NCTS, University of Michigan).

Mr. Benjamin de la Peña (Associate Director for Urban Development of Rockefeller Foundation) highlighted
that the more the city is urbanized, the higher the economic growth. However, he emphasized that in order
to make a sustainable and liveable city, there is a need to make the pedestrians a priority. Ms. Susan Zielinski
(Managing Director, SMART-University of Michigan.) supported this idea and further elaborated that it is
within the cities where most opportunities can be sought. The challenge however in moving forward with
New Mobility is to connect the dots. But there are reasons to be hopeful for Metro Manila with the
participants’ involvement on this. Atty. Yves Gonzales of MMDA presented about the current transport and
mobility situation in Metro Manila. He reiterated that the metro comprises 1/8 of the country’s population
contributing to a lot of transport-related issues and challenges. The MMDA, however, envisions a world-class,
vibrant, safe and healthy metropolis – which can be achieved by implementing effective programs.

The project background was presented by Dr. Segundo Romero (iBoP Asia Program Director) followed by
the presentation of the Project Team of the research plans for the following: (1) mapping of public transports
in the metro; (2) the impact and cost of public transport on the poor and the vulnerable; and (3) the
entrepreneurial and livelihood opportunities in the transport sector. Having this multi-sectoral
representation of the inception meeting has been instrumental in surfacing of inputs and suggestions to the
research plans of the Project. The remarks gathered contributed to determining the focus of the researches,
identification of study area(s), key persons and organizations, improving the research methods, defining the
variables of the researches, and possible collaborations with LGUs and national government agencies.
Moreover, the interaction of participants helped determine the interrelationship and integration of the three
researches to better present the baseline of the transport system in Metro Manila, and also the promise of
engagements and collaboration with the stakeholders present in the meeting. Dr. Danielle Guillen also
presented the Project Activities in the next 12 months and is hopeful to continuously get the support of the
stakeholders.

Dr. Antonio La Viña gave the closing remarks and emphasized that the issues are solvable and requires a
vision even though it may take time and focus. He also expressed enthusiasm to engage with all stakeholders
in doing changes in areas possible then connect the dots.

Atty. Alu Dorotan read the message from Chairman Francis Tolentino of MMDA. He congratulated the
organizers –the Ateneo School of Government and commended the Rockefeller Foundation for supporting
new learning and delivering services for the Filipino and conveys his appreciation for making Metro Manila the
subject of study and for giving MMDA the chance to participate in this worthwhile undertaking. Chairman
Tolentino is optimistic that this study will provide new lessons in looking at transportation beyond
infrastructure with the inclusion of the poor and the vulnerable. That it will provide a human face, which is a
very important factor in transport management.
CATALYZING NEW MOBILITY IN CITIES: THE CASE OF METRO MANILA

                                     INCEPTION MEETING

           Topaz Room 2, Gateway Suites, Araneta Center, Cubao, Quezon City
                                  27 October 2011

                                        9:00 am to 3:00 pm


                                           HIGHLIGHTS


1. The Ateneo School of Government under its iBoP Asia (Innovation for Inclusive Development)
   Program with support from Rockefeller Foundation hosted the Inception Meeting held last October
   27, 2011 in Gateway Suites, Cubao, Quezon City for the project entitled ―Catalyzing New Mobility
   in Cities: The Case of Metro Manila‖. It was attended by 44 participants from from various Local
   Government Units of the Cities of Quezon, Makati, Marikina, and Mandaluyong; National
   Government Agencies (Department of Transportation and Communication, Metro Manila
   Development Authority); Non-government Organizations and corporate foundation (Manila
   Observatory, CAI-Asia, Gawad Kalinga, PLDT-SMART Foundation); the private sector (Ayala Land
   Inc., Inc., Ortigas Center Association, Inc. ); development organization (The Rockefeller
   Foundation); and research and academic institutions (Ateneo de Manila University, UP NCTS,
   University of Michigan). The list of attendees can be found in Annex 1.

2. The event started with invocation, national anthem, and the welcome remarks given by Prof. Mary
   Jean Caleda, the Assistant Dean of Ateneo School of Government.

3. Mr. Benjamin de la Peña, the Associate Director for Urban Development of Rockefeller Foundation,
   gave a presentation about the Foundation, some facts about Metro Manila, and the need for
   understanding Manila’s urban development. His presentation is attached as Annex 2.

   The following are some key points of his presentation:
    Metro Manila grew in the last 50 years by 1440 ha/year with an average of 180,000 people/year.
      This is about half the size of Makati in land area each year. There is no agency in the world that
      could have cope with this kind of growth. This led to problems like informal settlements, slums,
      and traffic. To cope up with this kind of growth, there is a need to build 100 houses per day –at
      a no vacations, no weekends and no holidays assumption.
    The situation in Metro Manila (e.g. slums, traffic congestion) is not unique to the country and
      can be found in other major cities/ metropolitan in the world.
    The more the city is urbanized, the higher the economic growth. The US is about 80%
      urbanized, Korea is 92%, and Japan is even more so. The only place in the world that does not
      have horizontal slums is China because it is intentionally urbanized. These countries see the
      connection between urbanization and growth. Here in Metro Manila, it is not realized.
    Cities share 70% of the global economy and are considered the economic engines of the world.
      It has a huge share for a very miniscule size of the world’s land area.
    Mr. dela Peña shared his favorite quote from Triumph of the City by Ed Glaeser:
“Cities don’t make people poor. Cities attract poor people. They attract poor people because they deliver
       things that people need most of all — economic opportunity.”
      There is a demographic shift
       happening. The World Bank
       thought that in order to solve
       world poverty, people don’t have
       to go into cities. They come to
       realize over the last five years
       that it cannot happen—that
       people come to cities because of
       opportunities.
      Metro Manila is only 2.1% of the
       total land area of the country,
       but it produces 1/3 of the
       national economy. Every square
       kilometer in Metro Manila
       produces more than $ 3 billion
       dollars per year.                       Mr. de la Peña presenting the facts about the contribution of cities in
      Comparatively, Metro Manila national economy
       produces about $158,000 per sq.
       km. per year versus $1,720 for every square kilometer per year in the rural areas.
      Poverty incidence of families of NCR (4.8%) is lower than in whole of the country (24.4%).
       Lower poverty incidence is due to economic opportunities. Starting a business in the city or
       finding a job is nine times higher than being in the rural areas.
      The myths of decongesting Metro Manila and traffic are as follows:
           Moving people out of the City (mainly the poor). An example is Balik Probinsya Program
              in the 1950s.
           Create alternative growth centers to relieve pressure.
           Need more mass transit to relieve the traffic congestion

      There are two ways of solving congestion: (1) traffic congestion pricing and (2) high gas cost
      One way to decongest the city is to kill its economy.
      The more roads you build, the more people drive.
      Mr. de la Peña emphasized that if we want a sustainable and a livable city, it is the pedestrian that
       needs to be king. All that happens in cities depend on people. The way to make a sustainable and
       livable city is to make the pedestrians a priority. That’s the indicator species, not the person in
       the car.

4. Ms. Susan Zielinski, the Managing Director of Sustainable, Mobility and Accessibility Research and
   Transformation (SMART) Center at the University of Michigan, gave a presentation on the
   international perspectives on New Mobility.

   Before Ms. Zielinski started her presentation, she asked everyone to introduce themselves, their
   affiliation, and tell a positive word that represents ―transportation.‖ Some of the participants’
   responses included the following: speed, legroom, potent, space, convenience, movement, choice,
   service, door-to-door, connectivity, safe, seamless, enforcement, clean air, engineering, people,
   democratic, integrated, and sustainable.
She gave a presentation with the theme ―connecting the dots.‖ Her presentation can be found in
Annex 3. The highlights of her presentation are as follows:

   Urbanizing world is an opportunity to think differently about solutions. We have to think
    creatively, not only focusing on what’s wrong or what the problems are, but looking at
    innovations all around the world.
   There are new ways of providing services including fractional use (e.g. zipcar), new technologies
    (iphone applications telling us when trains are coming, integrated fare payment), new kinds of
    design and infrastructure (bike parking, urban design—transportation as a framework for city
    building), new modes of transportation (foldable bikes, new types of buses) and cultural shifts.
   We should consider not just people’s movements but also goods movements, and the lesson to
    be learned from the latter. Transportation is not just going from A to B, it is also about making
    trips shorter or eliminating it (e.g. building a corner store in a neighborhood eliminates longer
    trips). Transportation is a means not an end. Good movement should be multilevel, door-to-
    door, IT-enhanced and seamless.
   A three-minute video presentation (created by Veolia) was shown to give the participants ideas
    on new mobility.
   Ms. Zielinski emphasized that it is important to identify transportation grid that already exist in
    the city then look at how it increases connectivity. Connectivity infrastructure rather than roads
    as infrastructure.
   She also discussed the Four-step Approach – convening, mapping, piloting and roll out, and
    moving minds.
   According to Ms. Zielinski, convening identifies great things, so as to bring them together and
    make them better. It’s beyond usual suspects. It’s not just the city planners and engineers but
    also the entrepreneurs (e.g. doing iphone apps, people at Cisco doing neat IT, NGOs), and
    sometimes labor.
   Mapping and piloting on the other hand should be able to identify things that make sense and
    should generate interest, more demands, and public participation of the city’s transportation.
   There are many industries involved in the traditional transportation industry as follows: real
    estate, tourism, logistics, IT and GIS. With New mobility, it further contributes to economic
    benefits. It saves money, creates jobs, boosts businesses, and revitalizes local economies.
   Ms. Zielinski asked the participants to think of a thing in Metro Manila that they are most
    excited, proud and hopeful for the future. Furthermore, give at least whom they would like to
    bring to participate in the table.

    The participants said they are proud of the following:
      Train system (MRT) – it may be insufficient but at least Metro Manila already has it.
      Transportation rich; excited about transportation issues and possible solutions.
      Connections have greatly improved
      Alternate routes
      Rationalizing public transit
      Retaining public transit share
      Cooperation among stakeholders
      Covered walks and the efforts of various groups to improve it
      Current initiative in Commonwealth Avenue for motorcycle lane
      People Power
      Growing awareness of importance of health
   Hoping      for    a
     subway in Metro
     Manila
    Partnerships with
     NGOs
    Existing
     improvements
    People welcome
     positive changes
    People here in the
     room who came
     with an open mind
     and willing to Right photo: Ms. Zielinski listens to the participants while giving their insights on what
     collaborate with they are excited, proud of and hopeful in the future of transportation in Metro Manila.
     everyone
    Enthusiasm       and Left photo: Local Government representatives from City of Marikina and CAI-Asia sharing
     interest          of their thoughts
     different sectors of
     the community
    Renewed zeal/ desire of young people to be part of city and nation building
    Numerous options to live in the places where you work
    Organizations promoting paradigm shift from infrastructure building to shifts in mass
     transit; excited by projects of line 7 and line 9
    Streets are already marked
    Potential as center for innovation
    Capacity to talk about traffic rather than coup d’etats and crime
    Talking about mobility and not just transportation/ traffic
    People have open minds, not looking at Manila as a dead end

Groups and/ or individuals identified by the participants are as follows:
  Bus operators (80% of traffic caused by buses, lack of discipline thereof)
  Councilors of the different LGUs especially Chairpersons of the Committee on
     Transportation
  People working on urban air quality
  Students and those studying more efficient transport systems
  Representatives of car users
  Mayors of Pasig, Mandaluyong and Quezon City (for the Ortigas Business District)
  National government agencies
  Motorcycle users
  President
  Urban planners
  Public transport operators
  Commuters
  Social entrepreneurs
  Youth groups
  Township developers
  Church
  People working in transport services sector to better understand the economic situation
  Core users, especially those in lower-income tax brackets
  Drivers
   Ateneo community (future leaders, entrepreneurs)
            Future problem solvers, including young children
            Bloggers/media
            Young planners hungry for development
            Artists who could help visualize what the real identity of Metro Manila should be

5. The following are the highlights of the discussion:
    Mr. Danilo Ocampo asked if there is a room for discussions and planning on some manageable
      innovations and mobility system at the local level.
    Mr. de la Peña responded that what happens and what we can do in this table should not be
      defined by the funders or the proponents. It should be defined by the participants. And in order
      to effect change, it is important to change minds. With this, what we can do is to shift the
      framing of the problem. He cited US as an example, that, it is a mistake to count cars instead of
      people. He emphasized that if we count people and consider it to be at the core, which we
      forget, we will be thinking about how many people can be moved as fast as possible.

6. Atty. Yves Gonzales, Director of the Traffic Discipline Office of the MMDA, presented about the
   Metropolitan Manila Transport and Traffic Development and Management Program (Annex 4).

   The highlights of his presentation are as follows:
    The Philippines is about 88 million in population, Metro Manila comprised its 11 million. The
      classification of the roads is about 44% concrete and about 56% of the national road is in asphalt.
      The road network composes of five circumferential roads (C-roads) and 10 radial roads.
    The vehicle registration in 2010 totaled to 6.6 million. There is an increase in vehicle registration
      from 2008 and 2010.
    As the country progresses,
      more and more people buy cars
      and traffic congestion gets
      worse.
    For buses that passes thru
      EDSA, there a total of 3,700
      city buses and 3,088 provincial
      buses. For non-EDSA there are
      total of 1,589 city buses and
      4,280 provincial buses. These
      accounted to a total of 5,321
      for EDSA and 7,368 for non-
      EDSA buses.
    Based on a study, the actual
      limit of buses is just about
      1,600. There is oversupply of          Atty. Yves Gonzales presenting the initiatives of MMDA
      city buses. In addition, provincial
      buses also contribute to traffic and congestion.
    There are 85 bus stations clustered in the areas of Sampaloc-Manila (29), EDSA-Cubao (26),
      EDSA-Pasay (19), Buendia-Pasay (7) and Monumento (4). Currently, there are 1,719 franchise
      holders for a total of 48,514 units.
    We also have the rail system, MRT, LRT 1 and 2, and PNR. The expansions MRT 7, MRT 4 are
      also part of the expansion plans. The LRT 1 has 111 trains, the LRT 2 has 13 train sets, and MRT
      3, the most popular has 73, and the Philippine National Railways has 18 trains.
   There is also the Pasig River Ferry System. However, its operation is currently suspended. The
    DOTC has plans to bring it back and strengthen because it is one of the alternative means to get
    around Metro Manila.
   There are a total of 76,938 of traffic-related accidents from January to December 2010 in Metro
    Manila. 380 are fatal accidents, 14,853 non-fatal accidents, and 61,705 damage to property.
    While from January to May 2011, we have 168 fatal accidents, 6,321 non-fatal injuries, 22,962
    damaged properties, and a total of 29,446 accidents.
   The number of accidents along Commonwealth Avenue has been reduced by 23% as compared
    to 2010.
   The Issues and Challenges are:
     Obstructions and illegal structures along the carriageways
     Outmoded traffic signal system
     Poor road condition
     Inadequate public transport
     Vehicular and pedestrian accidents
     Low or weak enforcement of transport and traffic related-laws/regulations; and
     Lack of discipline and poor road behavior
   Metro Manila’s vision is to be a world-class, vibrant, safe and healthy metropolis. We are not yet
    there but we are getting there.
   The MMDA has proposed/implemented the following flagship programs:
         The establishment of the Mega Manila North and South Provincial Bus Axis System or
            PIBAS. The goal: to decongest EDSA from buses.
         The development of the Airport Tram System aims to inter-connect all the three (3)
            international airport terminals.
         The installation of an Intelligent Transport System. It consists of two parts: (1) to
            improve Metro Manila’s traffic signaling system—improving traffic lights, changing LEDs
            and installing counters which shows the number of seconds for the red time, yellow
            time and green time, (2) to increase monitoring and surveillance abilities by installing of
            additional cameras; the more parts of the road that we can monitor, the better services
            we can provide for the people.
         Installation of road signs and markings following international standards.
         Construction of rotondas to improve the traffic flow.
         Landscaping and beautification of the road.
         Installation of strategic traffic safety and traffic flow enhancement facilities.
         Improving illumination of roads.
         Transport and traffic entry summit and stakeholder’s consultation meeting.
         Construction of pedestrian footbridges. Currently there are 66 footbridges serving a
            total of 2.3 million pedestrians a day. It is equivalent to 2.3 million pedestrians that are
            not on the road.
         Deployment of lady traffic enforcers to areas with severe traffic problems. Motorists
            tend to be more compliant and try to obey traffic laws when lady traffic enforcer is
            around.
         Expansion of Unified Vehicular Volume Reduction Program (UVVRP). Number coding
            system.
         Introduction of Christmas lanes, also known as Mabuhay Lanes. These are alternate
            routes that the motorists can traverse, instead of the major roads. The MMDA deploy
            enforcers to ensure that these routes remain free flowing.
         Employment of female bus drivers. MMDA believed that female bus drivers are more
            caring and less aggressive in driving PUVs.
   Setting speed limit of 60 kph and introduction of motorcycle lanes along
                Commonwealth and Macapagal Avenues.
               Vehicle tagging scheme that aims to tag all vehicles to allow identification of vehicles (e.g.
                during accidents, etc.) via CCTV. It is also important for the identification of vehicles
                and out-in-line vehicles. There is no cost to government because the vehicles are tag
                voluntarily by operators.
               Establishment of MMDA twitter account that replaced MMDA radio/TV operations. It is
                much cheaper and currently has 144,000 followers. It is simple, it is cheap and efficient.
               Metro Manila Traffic Navigator aims to provide traffic information in line with major
                thoroughfares—EDSA, C-5, SLEX, NLEX, Roxas Boulevard, Quezon Avenue, España,
                Commonwealth, Ortigas, and Marcos Highway.
               Creation of MMDA iOS mobile application.

7. The highlights of comments, questions, and recommendations for the presentation given by Atty.
   Gonzales are as follows:
    Mr. Ocampo asked if the MMDA thought about replicating the MRT system to a situation of
      buses and jeepneys.
    Atty. Gonzales responded that
      improving public transportation is
      one of the solutions to solve traffic
      problems. Establishing Bus Rapid
      Transit may take time because of
      political challenges. It is also cheaper
      but will require new capital for buses.
      The       improvement        of    public
      transportation is not exactly a
      mandate of MMDA but of DOTC.
      The MMDA is working with DOTC,
      LTO, and LTFRB to come up with
      solutions to improve our level of
      transportation. BRT system is one of Mr. Danny Ocampo asking Atty. Gonzales, if MMDA has thought about
      them. Next year, Chairman Tolentino replicating MRT system to bus and jeepneys.
      is planning to introduce a project
      regarding the loading and unloading. Again, this is one of the problems in traffic situation
      because people just load and unload everywhere.
    Ms. Jessica Bercilla cited that wherever there is increase in mobility, there are new social hubs
      that evolve. Where there are new evolving social hubs, the more vulnerable sectors and the
      urban poor sectors, are very quick at finding opportunities. In relation to this, she asked if
      MMDA, in all the innovations implemented, has thought about addressing the issues of the urban
      poor who use and benefit in the evolving mobility that we have in Metro Manila.
    Atty. Gonzales said that MMDA is concentrating on it mandates to provide better
      transportation management services in Metro Manila. The result of will be reaching down to
      the poor and the vulnerable. However, MMDA don’t have that project right now that is why we
      are talking with the ASoG to have an initial meeting on how these people - the poor and the
      vulnerable - will benefit from agencies transportation project especially in Metro Manila.
    Mr. de la Peña, asked the participants to name one city in the world, a vibrant city that has no
      traffic. He cited that even Singapore has traffic. The goal of traffic-less city is probably
      impossible. He also gave New York, Tokyo and Hong Kong as examples of cities that have the
      best transport systems in the world. Even these cities have traffic. He congratulate MMDA with
its initiatives and with the Traffic Navigator, it shows how we can achieve our objectives in the
       future.
      On the Traffic Navigator, Atty. Gonzales said that their vision is to cover everywhere. It is built
       in a modular way so that more roads can be added fairly.
      Mayor Herbert Bautista on the other
       hand asked the group on what is the
       basis of planning, is it transportation
       or land use? Moreover, what are the
       regulations regarding the use of ten-
       year old cars?
      Dr. Antonio La Viña emphasized that
       the whole point of the Search is to try
       to answer the questions that the
       stakeholders have. He is also
       optimistic that the group can do a lot
       of things on transportation that is
       good for the environment, for
       progress, for development, and for
       energy. Dr. La Viña also emphasized
       one of the reasons we invited the local
       government officials (e.g. Quezon
       City) is for the team to move forward
       on this initiative and be able to
       locating these issues in specific places.
      Mr. de la Peña responded to the query
       raised by Mayor Baustista. He said that
       transportations are city shapers. In
       understanding levels of development
       (e.g. in Quezon City), it is important
       to consider the following questions:
       How many cars will have to pass Above photo: Ms. Jessica Bercilla asking Atty. Angeles if MMDA (given
       before thinking about expanding the their innovations) thought of addressing the issue of urban poor who use
       road? But what if, we count people and benefit in the evolving mobility that we have in Metro Manila.
       instead of cars? Then how many people
       will be coming through here then how Below photo: Dr. La Viña explaining the objective of the Search.
       do we carry that people? Is the most
       efficient, cars? Is the plan based on transportation or land use, would you be doing plan based on
       people? Where will people go? How will they move? How many of them can we move? Where
       do we get down and get off? How do we make it more convenient for them?
      On the query of Mayor Bautista about the regulation on cars, Ms. Corazon Japson (Supervising
       Transportation Development Officer, DOTC) mentioned that there is a DOTC regulation that
       limits the age of public utility vehicles to 10 years. The agency will not give franchise if they
       exceed to 10 years. It is not that strict for private cars, so long as the vehicle passes the
       requirements for motor-vehicles registration and NBI safety road forms.

8. The morning session ended with a photo shoot of all the meeting participants. The presentation
   about the project and its research components were moved in the afternoon.
The participants of the Inception Meeting from LGUs, national government agencies, private sector, academe, non-government
 organizations and development partners.


9. In the afternoon session, Dr. Segundo Romero (iBoP Asia Program Director), gave a presentation
   entitled, ―Background and Overview of the Project on Catalyzing New Mobility in Cities: the Case
   of Metro Manila.‖ The presentation is attached as Annex 5.

   The highlights of his presentation are as follows:
    Government agencies are repositories of a lot of information that are not shared.
    The Metro Manila Action Plan should be able to contain provisions on safety, mobility,
      productivity, and civility. For inclusiveness, it is to design the public transport system for the
      pedestrians,      the    bicyclists,  the
      commuters, the long trippers.
    Design safety for the pedestrians.
    For mobility, we should also look how
      it affects the productivity for the rich
      and poor.
    Dr. Romero raised the following
      questions that the project wanted to
      answer for this Search:
          Is it possible to design civility
             into interactions on the road?
          If the streets show the attitude
             and our citizenship, how do we
             focus on cooperative and
             interactions?                         Dr. Romero presenting the background and overview of the project
          Where are the informal transport
             hubs? What are their attributes?
          Where are the formal transport networks?
          How to combine different modes of travel?
          How Metro Manila combine these services, etc?
   What basically designs to ride a jeep rather than a bus?
            Economics and mobility.
            Social enterprise opportunities
            Focus on governance not government

      Connect ―islands‖ of transportation systems. The SMART primer highlights transportation as a
       system of systems, connecting nodes, services, etc. Thus the concept of transportation also
       includes behavioral mobility changes and innovations from various stakeholders.
      In the end, we want to increase the accessibility in Metro Manila. The output that we are
       promising is a sustained multi-stakeholder discourse on new mobility—a series of discourses on
       mobility beyond the project line. We are going to feed it with workshops and fora, research,
       communication and information activities that enriches knowledge sharing.
      In the next 12 months, the project will do the following:
          Stakeholder workshops
          Mapping and research - both visible and invisible public transport system. The team
             wanted to map behavioral patterns and understand the impacts/ costs of public
             transportation, particularly on the poor and vulnerable, and identify existing and emerging
             entrepreneurial activities in the transport sector.
          Profile raising activities

10. Mr. Lorenzo Cordova, Jr., Research Associate of iBoP Asia Program, presented the Mapping of
    Public Transport Networks in Metro Manila (Annex 6) in behalf of Dr. Jun Castro.

   The highlights of his presentation are as follows:

      Database is very effective in planning if it is reliable and updated. If it is updated, it should be
       relevant as well.
      In building database, it is important to answer the following:
          What is the purpose of the data?
          Who needs the data?
          Should it be able to be implemented on various platforms?
          What are the platforms available for the users?
      GIS-based maps and database can be overlaid with several layers to come up with guidance in an
       effective decision making. Results and analyses will be useful in policy making, management, guide
       in planning your system, traffic information in your GIS.
      The study will select four to fiv areas in EDSA (e.g. from MRT stations), and will cover the 500
       meter radius from the area identified.
      The One-year time frame limits the study.
      For the road network and capacities, we have MMDA and DPWH as sources of data—vehicle
       types and volumes, public transport services, pedestrian improvements, and traffic management.
       He emphasized that LGU have critical roles as well.
      Mr. Cordova raised some questions to the participants to sought guidance from the participants
       to improve the study. These are:
          What is the purpose of mapping?
          What are we trying to connect for this invention? What are we trying to achieve? What
              are we looking at?
          Who are the people who will use this data or these GIS maps?
          What needs to be added given the existing information that we have?
          How do GIS maps help define or determine the socio-economic and new mobility
              programs to be implemented by the LGUs, as well as the policies?
11. The summary of key questions, comments, and recommendations for the mapping component of
    the Search are as follows:
     Dr. Regidor gave recommendations
        to ask the following considering the
        perspectives of using maps as
        follows: 1) What were the
        objectives of the maps based on the
        maps presented by the MMDA? 2)
        Depending on the objectives, we
        have to define what level of detail
        we want in these maps; 3) What
        type of information exactly do we
        want to put in these maps? Then we
        can define what type of data we will
        be putting in the layers of the maps
        (e.g. travel speed, volume). 4) Do
        we need to determine densities, Dr. Regidor of UP NCTS sharing his insights for the mapping
        vehicle mixes?                          component of the Search
     For the informal hubs, the
        connectivity will be identified. It’s one of the basic objectives--to see how the urban poor
        commute.
     If the study will only look at three MRT stations along EDSA and we want to focus on inclusion,
        why not map an urban poor community and find out how they are traveling and to where?
        These stations are just exchange points.
     Importance of language and legibility in creating maps
     ―New mobility map‖
     Understand connection points
     Maps should give opportunity for both users and for the entrepreneurs who want to fill up the
        system and identify gaps
     Define the purpose of the map and the mapping exercise.
     If maps should promote dialogue, then what kind of design will support conversations?

12. Mr. Randolph Carreon, Transportation Economist, presented Impact and Cost of Public Transport
    on the Poor and Vulnerable (Annex 7).

   The highlights of his presentation are as follows:

      The poor comprised considerable part of the population of the Metro Manila. The cost of
       transportation, especially public transport, has been increasing over the past years. The
       increasing costs are felt especially from those belonging in the low-income bracket.
      The vulnerable groups include persons with disability, senior citizens, women and children.
       These sectors have specific transport needs however received less attention in the previous
       years and studies. Public transport is a vital part of the transportation system in Metro Manila.
      The objective is to understand the nature of the transportation needs, accessibility, mobility, and
       cost of the poor and the vulnerable groups.
   The study aims to establish the travel demand of the
       poor and the vulnerable groups. Specifically, how these
       people move from their house, from their work,
       school. Moreover, to look qualitatively at the efficiency
       of the transport system compared to the needs of the
       poor and the vulnerable groups.
      The study will also estimate the cost of transportation
       of the poor, estimate the actual and the desired cost of
       transport of those within the vulnerable groups and
       examine other quantifiable cost incurred by these
       groups.
      The ―poor‖ will be defined as those living within the
       colonies of the informal settlers. Typically we define
       poor in terms of income, relatively those in the
       poverty line but for the purpose of this study, we
       would assume that once you live in the colony of
       informal settler, you could be considered poor.
      The ―vulnerable groups‖ will include PWDs, senior
       citizens, and women and children. Additional category
       consists of those working in BPOs will be covered
       because this is a new and emerging industry.                Mr. Randolph Carreon presenting the study on
      The study will use primary and secondary data covering Impact and Cost of Public Transport on the Poor
       all the LGUs in Metro Manila. The primary data will be and Vulnerable
       gathered from selected areas, while secondary data will be gathered, hopefully, from all the
       LGUs in Metro Manila. Then, we can expand the primary data gathering.
      We plan to conduct household interview surveys to determine travel demand patterns and
       transport cost. Currently we are considering the colonies of Bgy. Old Balara, Agham Road, and
       along EDSA extension. We are hoping to have a sampling rate of approximately 2.5% per area.
      The study will conduct individual interviews among PWDs, senior citizens, women and children,
       and BPO workers. The interviews will be conducted in public places such as terminals at mall
       stations, in short, where we can find them, we will interview them.
      The target number of samples is 2,000 respondents from all the vulnerable groups.
      The study will utilize other methods:
           Key-informant interviews
           Focus group discussions
      Since we have selected study areas, we will try to get some specific case studies, for example, a
       typical family within the informal settler colony. We will try to document how they move out to
       go to school, how they get their income, and what are the costs. For each of the vulnerable
       group, we will get one specific case study.
      By end of January, we will have the initial findings after we do the initial running of the results.
       And on March, we will be able to finalize the report.

13. The summary of key questions, comments, and recommendations for the Impact and Cost of Public
    Transport on the Poor and Vulnerable component of the Search are as follows:

      Stratify the approach. Are we talking only of informal settlers with no land title or no tenure and
       some informal settlers with tenure already, whether those are awarded lots? The areas chosen
       are mixed since the focus is along EDSA.
   Areas far from EDSA are still under consideration to get the feeder of the movement (e.g.
       people in EDSA that are walking towards to and from the MRT; the tricycle and pedicab
       movements are not recorded).
      Consider including the community that was relocated to see what is the impact on their
       transportation.
      Mayor Bautista cited the example of the QC government’s idea of donating about five jeepneys
       (creating transport cooperative) so the people can build and eventually own. The Matandang
       Balara is okay for the study, it is far from EDSA, however, most of them are dense and many of
       the residents are working outside Quezon City. He also expressed to support the project and
       will be very much willing to volunteer Quezon City as one of the study areas.
      If the research looks at the cost of
       public transit and how it causes
       traffic, there is a tendency to deal
       with it instead of the cars
      Is there a ―language‖ that can say
       something on public transit
       opportunities, and impacts of
       motorized transportation on the
       poor/vulnerable? It might be a
       semantic thing but at first glance, it
       may look like that transit is seen
       as bad.
      Up to what degree of specificity
       and usefulness you can devise the
       study such that the information Mayor Herbert Bautista of Quezon City shares his insights and expressing
       would be useful to prospective his support to the project.
       social entrepreneurs who can
       devise very specific focus in transport systems that will make sense to those poor and
       vulnerable sectors? (e.g. people with disabilities, one way of looking at it is, what is the actual
       mode of transport they are using now?)
      Need focus on specific communities and see how dynamically they do their transport
      We are trying to look at transport data and impact. We are also looking at socio-
       entrepreneurship data. If we have to do them in the same communities and in same locations,
       there is no way we will be able to inter-relate that data and integrate theoretical ferment that
       might be useful to our people. Is it possible to look at specific communities where we can do all
       these studies but in an integrated manner?
      Ideographic case studies are good.
      Why don’t we try to locate the senior citizens, the PWDs, and the others from this community?
       You may not have all of them but when you look at them together from Metro Manila, you will
       have enough conclusions.


14. Ms. Tieza Santos, Associate Director of Ateneo Center for Social Entrepreneurship, presented
    Entrepreneurial and Livelihood Opportunities in the Transport Sector (Annex 8).

   The highlights of her presentation are as follows:

      Social entrepreneurship – innovative way of doing things in order to provide a pervasive social
       solution.
   For this component of the project, we would
    like to look at the enterprise landscape and
    potentials of the transport and new mobility
    sector.
   Research Overview (preliminary ideas):
    Goals and Objectives:
        Identify existing transportation related
          social     enterprises     or   mobility
          innovations in the Philippines and
          including other countries.
        Generate ideas and business models on
          new mobility and transport-related
          social enterprises with high potential to
          benefit particularly the poor and the
          vulnerable.
        Identify market barriers and aiders for
          the      development       of   mobility
          innovations.
            - We look at the economics, the Ms. Tieza Santos presenting the proposed study in
                 consumers, and the market. We enterprise landscape and potentials in the transport sector
                 consider the social aspect and
                 elements      governing      these
                 dynamics. And finally the cultural
                 patterns and behaviors.

    Scope and Limitation:
       Focus on commercial enterprise component of the transport and new mobility sector.
            - We consider the things that are more efficient that provide less cost, safe,
                convenient, poor and vulnerable-friendly transport systems.
       The research activities will involve the following:
            - Interviews with proponents, managers, customers of existing mobility enterprises
                and projects
            - Focused group discussions and/or crowd sourcing
       Geographic coverage on Metro Manila

    Preliminary Research Directions:
       The social and economic dimension of the transport sector
             - To look at the social context and cultural mobility in Metro Manila
             - To survey the development and evolution of the transport and mobility in Metro
                 Manila
             - To look at historical changes, economic drivers in national
             - To look at the sociological perspective and behavior patterns of transports and new
                 mobility market

    Main Goal:
      To understand the minds of the people and how goods and services are delivered.
      Moreover, try to answer the following: How policy makers and government officials
         envision the way the city was built, the way they develop our transport system; how
         commercial areas sprung in transport hubs?; How they think and re-think the way they
construct Metro Manila and our cities?; What do we make out of our cities?; and why has
         Metro Manila evolved into what it is today?
        Using the new mobility paradigm, we have two considerations:
           - What were the elements that influence the way you projected and built our city?
           - As Metro Manila reaches a point in terms of population and increasing demands for
               goods and services, did we consider the idea of how the city is built that is central
               to human progress?

   Going back to the roots: the transport sector as an enterprise
      For politicians and planners, we look at transportation as service provider but for
         operators, drivers, it is not just service but an enterprise—it is a livelihood for them
      The content of Search will also include the following:
                Historical overview of the urban transport development in Metro Manila and
                   how it emerged.
                   - How these transport shaped our city today?
                Market overview –the supply and demand analysis, the barriers and enablers
                   that resulted to privatizations, colorums, TODA.
                The development and emergence of transport enterprise in Metro Manila
                   - What are the factors that drove the formal and informal enterprise
                       surrounding the major transportation hubs in the country?
                   - How we would be able to provide new mobility and come up with
                       alternative enterprises for the formal and informal sectors that would be
                       able to increase/address the challenge of new mobility?
                Survey emerging enterprise and innovations in the new mobility paradigm.
                   - Look at people and services
                   - What are the new models that cater to people mobility, the transfer of
                       services, the barriers and enablers, the systems and structural developments
                       that are currently emerging?
                The future direction
                   - The projections of sustainable business models for new mobility and social
                       enterprises in the Philippines.
                           - What can be replicable locally?
                   - What would be the role of social enterprises or social entrepreneurs in
                       addressing the new mobility challenges with particular consideration for the
                       poor and the vulnerable and other dimensions such as safety, convenience,
                       health, efficiency, environment, and the cost? How will the challenges shape
                       the mobility of the people, goods and services in Metro Manila
                Some examples in the transport and mobility sector:
                   - Mobius motors in Africa – low cost and high quality motors
                   - Bikeshare
                   - Suica pasmo in Japan
                What if we do something like that in Metro Manila instead of carrying three pass
                   cards?
                   - Philippines: RoRo, Bayad Center


   Key considerations:
        Efficiency cost, environment, convenience, safety
        What are the enterprises, commercial/social and even public, that can be introduced and
           implemented to address these concerns?
   What are the proximate demands and supply for new mobility mechanism, specifically,
                the characteristics of the demand segment or the consumer profile in terms of
                segmentation that make up for the demand of new transport enterprises and new
                mobility mechanisms, infrastructures and systems that support the various needs of
                mobility consumers?
               What could be the features of new mobility system that would be convenient and
                helpful to consumers?
               What would be the incentives and principles that will govern or encourage the
                emergence of new models to facilitate new mobility of goods, people and services?

       We will be doing research designs and content, finalize survey questionnaires, dry run of the
        survey, preliminary market study and analysis, key sectoral/institutional representatives, FGDs,
        research data processing.


15. The summary of key questions, comments, and recommendations for are as follows:

       Possible to include research on regulatory aspect of public transport?
       Interested also in jeepney model, and have discussion with DOT officials.
       When people have just little money, renting a jeepney becomes an attractive investment.

16. Dr. Danielle Guillen presented the proposed activities of the Search (Annex 9). The highlights of her
    presentation are as follows:

       Launch/mapping in January 2012
           Launching in partnership with
             MMDA
           Mapping exercise – connecting
             the dots. Will involve MMDA
             and 17 LGUs and public sectors
             (e.g.      Department       of
             Transportation), media (e.g.
             print, radio, TV), and private
             sectors (e.g. shopping malls,
             private developers, IT and
             telecom), NGOs, academe,
             planners and other groups,
             International Organizations
                                                 Dr. Danielle Guillen presenting the proposed activities of the New
       Launching of Crowd Sourcing Activity       Mobility in Cities Project
           Crowd sourcing - like an
             innovation award for best
             practice. It is a distributed problem solving and production model. It is a participatory
             process. It will be in a partnership with the academe, or some NGO groups going to these
             communities for them to think of a social enterprise.
           Social enterprises are businesses in the market to fulfill social aims, bringing together
             people and communities together for economic development and social gain.
           We want to create an innovation award in best practice and/or idea for social enterprise
             in the transport sector.
             - Planning          :        November-December 2011
- Launching         :      January 2012
              - Call for Nominations :            February – March 2012
              - Presentation at Rio Summit: May 2012
           Characteristics:
            - Enterprise-oriented involvement
            - Explicit social aims (e.g. job creation, training, provision of local services)
            - Social ownership (autonomous organizations with governance and ownership based on
                participation by stakeholder groups or trustees)
       The project team will create a website to encourage interaction among stakeholders and as a
        resource facility to allow people to get what they need.
       Highlighted that the project is owned by all the stakeholders, not just by ASoG-iBoP Asia or
        Rockefeller Foundation.

17. Dr. La Viña gave the synthesis and ways forward.
    He emphasized that these issues are solvable and
    requires a vision even though it may take time and
    focus. That this is not only the project of ASoG.
    The team wanted to engage with all stakeholders as
    we move along. There are interesting initiatives
    going on in the public and private sector.
    Moreover, the levels of interest to solve the issues
    we are dealing with in terms of transportation are
    very high. We want to keep moving this forward
    and faster. Dr. La Viña emphasized that in a city like
    Metro Manila, he believes in ―mosaic‖ version of
    change, do changes where possible then connect
    the dots. This project is only a starting point of
    work that has to be done. Dr. La Viña thanked
    everyone for coming.

18. For the Closing Remarks, Atty. Alu Dorotan read
    the message from Chairman Francis Tolentino of
    MMDA. He congratulated the organizers –the
    Ateneo School of Government. He also
    commended the Rockefeller Foundation for
    supporting new learning and delivering services for
    the Filipino and conveys his appreciation for making
    Metro Manila the subject of study and for giving
    MMDA the chance to participate in this worthwhile
    undertaking.                                             Above photo: Dr. La Viña giving synthesis and ways forward

    Chairman Tolentino expressed that this is very Below photo: Atty. Dorotan of MMDA reading the message
    important project especially for MMDA since Metro from Chairman Francis Tolentino
    Manila is facing lots of challenges. With the
    increasing rate of urban development, many factors
    affect the delivery of services particularly in the area of transport. This study will provide new
    lessons in looking at transportation beyond infrastructure with the inclusion of the poor and the
    vulnerable. It will provide a human face, which is a very important factor in transport management.

19. The Inception Meeting ended at around 3:00 in the afternoon.
ANNEX 1
List of Persons and Organizations Consulted
CATALYZING NEW MOBILITY IN CITIES: The Case of Metro Manila

                                                               Inception Meeting

                    27 October 2011 | Topaz 2 Gateway Suites, 4th Floor Gateway Mall, Araneta Center, Cubao, Quezon City


                                                                                                                Email Address/
              Name                               Designation                       Organization
                                                                                                            Contact Information
Asinas, Rodney                      PDO                                  Makati City Hall              rdneyasns@gmail.com
Bathan-Baterina, Glynda             Tpolicy & Partnership Manager        CAI-Asia                      Glynda.bathan@cai-asia.org
Bautista, Herbert                   Mayor                                Quezon City                   mhmbqc@yahoo.com
Bercilla, Jessica                   Consultant                           Ateneo School of Government   jbercilla@gmail.com
Buencamino, Victor                  Gen. Manager                         Ortigas Center Association    +63 2 631 7212
Caleda, Mary Jean                   Assistant Dean                       Ateneo School of Government   mj.caleda@gmail.com
Camarillo, Ernesto                  Transport Consultant                 Makati LGU                    ernlcam@yahoo.com
Carreon, Randolph                   Transportation Economist                                           randolphcarreon@gmail.com
Comandao, Armando,                  City Planning and Development        Mandaluyong LGU
                                                                                                       armandocomandao@yahoo.com
                                    Officer
Cordova, Lorenzo Jr.                                                     Ateneo School of Government   lorenzojr.cordova@gmail.com
de la Peña, Benjamin                Associate Director                   Urban Development, The
                                                                                                       randolphcarreon@gmail.com
                                                                         Rockefeller Foundation
Diaz, Jennifer                      Chief, Engineering TOD               Quezon City Government        BdelaPena@rockfound.org
Duran, Anna                         Field Coordinator OCM                Office of the City Mayor

Faulan, Ma. Josefina                Director                             MMDA-OAGMP                    mdps_mmda@yahoo.com
Gison, Michael                      PO V                                 MMDA                          +63 2 882-4151 to 77 loc. 280
Gonzalez, Yves            Director III & OIC TDO           MMDA                             zz@mmda.gov.ph
Gotangco, Kendra          Program Manager, Klima Climate   Manila Observatory
                                                                                            manila@observatory.ph
                          Center
Guillaume, Marion         Intern                           iBoP Asia, ASoG                  Marion.guillaume@gmail.com
Guillen, Marie Danielle   Program Manager                  iBoP Asia-New Mobility Project   danielle.guillen@gmail.com>
Ibrahim, Amira            Associate                        The Rockefeller Foundation       AIbrahim@rockfound.org
Japson, Ma. Corazon       Supervising Transportation       DOTC
                                                                                            corajap@yahoo.com
                          Development Officer
La Viña, Antonio          Dean                             Ateneo School of Government      tonylavs@gmail.com
Laluna, Christian                                          Ateneo School of Government      allycrislna@yahoo.com
Lopez, Eriq               Chief Staff                      Quezon City Government

Marcaida, Jaime           City Transport & Development     Marikina
                          Office
Marin, Michael            City Transport & Development     Marikina
                                                                                            Michael_om020380@yahoo.com
                          Office
Martinez, Al                                               Ateneo School of Government

Medalla, Aly              Councilor                        Quezon City                      alymedalla@yahoo.com
Nilo-Fulo, Marien         Project Officer                  Ateneo School of Government      Marien_nilo@yahoo.com
Ocampo, Danny             Director                         Ateneo Center for Social
                                                                                            Ocampo_d@yahoo.com
                                                           Entrepreneurship
Palarca, Coryell          Legislative Staff                Quezon City Council              Coryell_palarca@yahoo.com
Quesada, Noi              Director                         GK Ateneo                        noiquesada@yahoo.com
Rabe, Corazon             Office Assistant                 ASoG                             csrabe@ateneo.edu
Regidor, Jose Regin       Director                         UP NCTS                          Up.ncts@gmail.com
Romero, Segundo           Program Director                 iBoP Asia Program                doyromero@yahoo.com
Sanchez, Mario       Asst. Head          Quezon City Government

Santos, Esther       President           PLDT-Smart                    santosesther@gmail.com
Santos, Mary Grace   Program Manager     iBoP Asia-UNIID Project       mgpalaciosantos@yahoo.com
Santos, Tieza        Asst. Director      Ateneo Center for Social
                                                                       tiezasantos@yahoo.com
                                         Entrepreneurship
Tan, Salvador        Sr. Div. Mgr.       Ayala Land, Inc.              tan.buddy@ayalaland.com.ph
Ubaldo, Virgilio     TFB                 Quezon City Hall              virgilioubaldo@rocketmail.com
Victorino, Punie     OCM                 Quezon City

Zielinski, Susan     Managing Director   SMART Centre, University of
                                                                       susanz@umich.edu
                                         Michigan
Aliliran, Karen      Documenter          Ateneo School of Government
ANNEX 2
            The Rockefeller Foundation and
the Catalyzing New Mobility in Cities Search
11/29/2011


Catalyzing the New Mobility in Cities Search


                                                       1
11/29/2011


        2
11/29/2011


How fast did Metro Manila grow?


1,440 hectares
180,000 people
         every year since 1948

      =1/2 Makati in land area, each year


             Bangkok


                                                    3
11/29/2011


Mumbai


Caracas


                  4
11/29/2011


by Sachin Suresh Jadhav


       by mylerdude


                                  5
11/29/2011


                       The World’s Megacities
1.    Tokyo-Yokohama, Japan - 33,200,000                1.    Tokyo, Japan - 34,100,000
2.    New York, United States - 17,800,000              2.    Mexico City, Mexico - 22,650,000
3.    Sao Paulo, Brazil - 17,700,000                    3.    Seoul, South Korea - 22,250,000
4.    Seoul-Incheon, South Korea - 17,500,000           4.    New York, United States - 21,850,000
5.    Mexico City, Mexico - 17,400,000                  5.    Sao Paulo, Brazil - 20,200,000
6.    Osaka-Kobe-Kyoto, Japan - 16,425,000              6.    Mumbai, India - 19,700,000
7.    Manila, Philippines - 14,750,000                  7.    Delhi, India - 19,500,000
8.    Mumbai, India (formerly Bombay) - 14,350,000      8.    Los Angeles, United States - 17,950,000
9.    Jakarta, Indonesia - 14,250,000                   9.    Shanghai, China - 17,900,000
10.   Lagos, Nigeria - 13,400,000                       10.   Jakarta, Indonesia - 17,150,000
11.   Kolkata, India (formerly Calcutta) - 12,700,000   11.   Osaka, Japan - 16,800,000
12.   Delhi, India - 12,300,000                         12.   Kolkata, India - 15,550,000
13.   Cairo, Egypt - 12,200,000                         13.   Cairo, Egypt - 15,450,000
14.   Los Angeles, United States - 11,789,000           14.   Manila, Philippines - 14,850,000
15.   Buenos Aires, Argentina - 11,200,000              15.   Karachi, Pakistan - 14,100,000
16.   Rio de Janeiro, Brazil - 10,800,000               16.   Moscow, Russia - 13,750,000
17.   Moscow, Russia - 10,500,000                       17.   Buenos Aires, Argentina - 13,400,000
18.   Shanghai, China - 10,000,000                      18.   Dhaka, Bangladesh - 13,100,000
19.   Karachi, Pakistan - 9,800,000                     19.   Rio de Janeiro, Brazil - 12,100,000
20.   Paris, France – 9,645,000                         20.   Beijing, China - 11,950,000

Source: Demographia.                                    Source: Th. Brinkhoff: The Principal Agglomerations of the World


                                                                                                                                   6
11/29/2011


Bangkok


Mumbai


                  7
11/29/2011


Caracas


          by Sachin Suresh Jadhav


                                            8
11/29/2011


Mumbai


         by Sachin Suresh Jadhav


                by mylerdude


                                           9
11/29/2011


Mexico City
              by mylerdude


                                    10
11/29/2011


                   Bogota


          This is a good thing
 Urbanization and growth go together: no country
  has ever reached middle income status without
      a significant population shift into cities.
        Urbanization is necessary to sustain
(though not necessarily drive) growth in developing
   countries, and it yields other benefits as well.
    But it is not painless or always welcomed by
         policymakers or the general public.
                                     Urbanization and Growth
                          World Bank Growth Commission 2009


                                                                      11
11/29/2011


    70%
Cities’ share of the global economy


                                             12
11/29/2011


“Cities don’t make people poor.
   Cities attract poor people.
    They attract poor people
  because they deliver things
 that people need most of all
  — economic opportunity.”
                Triumph of the City, Ed Glaeser


     London mid 1800s


                                                         13
11/29/2011


London and Cholera in the 19th Century


   23,000 deaths
             1831-1832


   53,000 deaths
             1848-1849


                                                14
11/29/2011


New York late 1800s


New York late 1800s


                             15
11/29/2011


  Meanwhile back in our Mega City…


 2.1% of total land area of the country
     30% of the national economy
    PhP1,933.04 billion GRDP (2005)
Every square kilometer in Metro Manila
 produced more than $3B/year in 2005


                                                 16
11/29/2011


US$ 158,000 sq.km/year
  $1,720 sq.km/year


  Poverty incidence % of families


 National 24.4%
   NCR 4.8%
            NSCB 2003


                                           17
11/29/2011


If Metro Manila is the engine
  of economic opportunity…


    Insanity is doing
     the same thing
   over and over again
      and expecting
    different results.
                        Albert Einstein


                                                 18
11/29/2011


         Myths of decongestion


“Let’s move people out of the city.”
           (mainly the poor)


What does a “decongesting”
      city look like?


                                              19
11/29/2011


Picture by Alex McLean


                                20
11/29/2011


         Myths of decongestion


 “Let’s create alternative growth
centers to relieve the pressure on
          Metro Manila.”


                                     -ß
      R=αS
      The problem of Zipf’s Law
       Rank-Size Distribution for Cities


                                                  21
11/29/2011


      Myths of decongestion


  “We need more roads to
to relieve traffic congestion.”


                                         22
11/29/2011


      Myths of decongestion


“We need more mass transit
to relieve traffic congestion.”


                                  Source: colorfulrag


                                                               23
11/29/2011


For every complex problem,
   there is a solution that
is clear, simple, and wrong.
                        H.L. Mencken


     67,000 jeepneys
       10,754 buses
      61,173 tricycles
1.47 million private vehicles


                                              24
11/29/2011


If gas was severely restricted to
    5% of the existing supply
     would you allocate it to
   public or private transport?


                                           25
11/29/2011


    Metro Manila Land Use distribution


        44.83% residential
        12.22% commercial
         7.62% industrial
        6.90% institutional
28.43% open spaces, parks and roads


   Reasons to be optimistic


                                                26
11/29/2011


  Cities are 100 year projects

  100 years – Burnham’s plan for Chicago
     50 years to clean up the Thames
    30 years to make Copenhagen the
        biking capital of the world


The pedestrian is the indicator
    species for livable and
  sustainable communities.
                                   Harriet Tregoning
                      Chief Planner, Washington D.C.


                                                              27
11/29/2011


Thank you very much

       @benjiedlp
bdelapena@rockfound.org


                                 28
ANNEX 3
                 Connecting the Dots and
International Perspectives in New Mobility
11/29/2011


                             CONNECTING
                             THE
                             DOTS
                             (getting underway:
                             revealing the New Mobility Grid
                             and spurring innovation,
                             economic vitality, and
                             livability for Metro Manila)

      Susan Zielinski, SMART, University of Michigan.
      October 27, 2011, Manila Philippines


DRIVERS


                                                                       1
11/29/2011


ZIPCAR: Wheels When You
Need Them
             services

 FRACTIONAL USE: AUTO RICKSHAWS, TAXIS & COMMUNAL
    CABS, INTERMEDIATE VEHICLES, CARSHARE, BIKE
        SHARE, SOCIAL NETWORKING, SLUGGING


                                                            2
11/29/2011


      new technology

      wayfinding; shared
      use; fare payment;
      traffic management;
      security etc.


Design & new
infrastructure


                                    3
11/29/2011


New modes / modal enhancements


                                         4
11/29/2011


moving people
moving goods
moving less


                        5
11/29/2011


                       VEOLIA Video


             CONNECTIVITY/OPTIMIZATIO
           CONNECTIVITY / OPTIMIZATION
                          N
               (both energy & time)
                           • spatial *
                    • spatial / physical

                  • service (use vs. own)

• technological (wayfind; fare pay; traffic manage; security)

• economic (revitalize; save $; create jobs; boost business)

                 • institutional & policy
                 (public private innovation)

        • cultural / psychological (moving minds)


                                                                        6
11/29/2011


LIVING LABS:
Bangalore
Cape Town
Chennai
Cochin
Detroit Region
Los Angeles
Manila
Mexico City
Mystic
Pasadena
Portland
Seattle
Shanghai
Washington DC
Lisbon / Coimbra / Porto
Etc…
Connecting the Dots; Moving Money; Moving Minds
RESEARCH, EDUCATION, TECH TRANSFER: ACCELERATE IMPLEMENTATION


LIVING LABS:
Bangalore
Cape Town
Chennai
Cochin
Detroit Region
Los Angeles
Manila
Mexico City
Mystic
Pasadena
Portland
Seattle
Shanghai
Washington DC
Lisbon / Coimbra / Porto
Etc…
Connecting the Dots; Moving Money; Moving Minds
RESEARCH, EDUCATION, TECH TRANSFER: ACCELERATE IMPLEMENTATION


                                                                        7
11/29/2011


                                PARTNERS & SPONSORS:

                             National Science Foundation
                           Center for South Asian Studies
                          Transportation Research Board
                                   Rockefeller Foundation
                                          Mott Foundation
                                           FIA Foundation
                                         Alcoa Foundation
                                    Ford Motor (redefining)
                     US Environmental Protection Agency
                                            Cisco Systems
                                                      IBM
                         Federal Highway Administration
                            U.S. Department of Education
                                          CEO’s for Cities
                                    City Connect Chennai
                         Confederation of Indian Industry
                                                     etc…


GAME CHANGE 4.0: SEAMLESSLY CONNECTED OPTIONS
LEAPFROG: Straight to Next Generation Whole Systems Design & Build
- spatial connectivity supported by New Technologies and PPI


NEW MOBILITY GRID: More Choices, More Connected
The Next Infrastructure; The Next Industry Cluster


                                                                             8
11/29/2011


 Transportation Meetings


0:00                                                             1:40 1:50 2:00

Agenda:          WHAT IS NOT WORKING
                                             Solutions Laundry List
                                          Quick attempts at prioritization
                                                                        Adjourn

  Attendees: Usual Suspects


  A heart? A lung? Pituitary gland? Your choice

  What is better? What is the silver bullet?

  I only use my heart I’m too rich and powerful to use my capillaries


                                                                                          9
11/29/2011


           ROLLING OUT THE GRID: 4 STEPS

1. CONVENING – The Crucial & Often Under-Rated First Step
   (not just the usual suspects – public private innovation

2. MAPPING – An Engaging and Tangible Catalyst for Action

3. PILOTING & ROLL-OUT – Start with Hologram for Wider Spread
   Roll-Out

4. MOVING MINDS – Speak a new language (Rumi, Philip K. Dick)

5. NETWORK (SMART network – “twinning” for shared genius)


          CONVENING


                                                                       10
11/29/2011


           MAPPING

                and

          PILOTING


                      Washington, DC

                      Ann Arbor, Michigan


     CHENNAI:
  Linking design, value
  capture, cycles, auto
rickshaws, pedestrians,
  local business & new
    technologies (e.g.
Mapunity, Cisco, Ashok,
         thru CII)


                                                   11
11/29/2011


 COCHIN (quiet leapfrog)
Links train, metro, bus, ferry, auto, taxi, parking, 2 wheelers & cycles
Linked to commercial, entertainment, tourism, lifestyle
70% of people need not enter city (larger hubs gateways to grid of smaller hubs)
Transform economy & lifestyle
Sustainable – supported by real estate elements


              Mexico City


                                                                                           12
11/29/2011


CAPE TOWN – entrepreneurial ventures, way-finding,
workplaces, public-private innovation, moving minds


Moving
Minds
Did Philip K. Dick predict or shape the future?


                                                             13
11/29/2011


SYSTEM OF SYSTEMS: CHANGES THE GAME

Connects Mode Service Product Technology Design

 Door to Door (feeds trunk, focused on user)

 Scalable / incremental / ALL YESES / induces demand

 For all shapes & sizes of communities & regions

 Short term / long term (not land use / policy dependent)

 Appealing (design, cool status) & Safe & Equitable

 Resilient & Robust (to climate / geopolitical challenges)

 Business, Innovation, Job Opportunities
       (New Mobility Industry Cluster Multi-Billion $)


         NEW MOBILITY ECONOMIC BENEFITS

         Saves Money

         Creates Jobs

         Boosts Business

         Revitalizes Local Economy


                                                                     14
11/29/2011


                                  TELECOMMUNICATIONS
                                      & WIRELESS
                  CLEAN ENERGY                          E- BUSINESS
                                                        & NEW MEDIA


     TRANSPORTATION                                                   INFORMATION
       EQUIPMENT                                                      TECHNOLOGY


FINANCIAL SERVICES,
                                                                              TOURISM
     BAN KING &
    INVESTMENT
                                  NEW MOBILITY                                & RETAIL

                                    INDUSTRY

                                                                      TRANSPORTATION
      GEOMATICS                                                         OPERATIONS
                                                                        & SERVICES


                   REAL ESTATE
                  CONSTRUCTION,                        GOODS MOVEMENT
                   PLANNING &                           & SUPPLY CHAIN
                                       INTELLIGENT       MANAGEMENT
                   OPERATIONS
                                     TRANSPORTATION
                                         SYSTEMS


                                                                                                15
11/29/2011


             NEW ROLES (AND OPPORTUNTIES)

    PUBLIC SECTOR – incentives to connectivity / systems
     convening beyond the usual players / implementing,
   integrative frameworks / platforms to boost innovation &
                implementation. MOBILIZATION

    PRIVATE SECTOR – public-private innovation (action
    affects policy), new products, marketing New Mobility
            culture PUBLIC PRIVATE INNOVATION

   ACADEME – new models / tech transfer based on real
  world contexts, understanding & advancing solutions (not
    just problems). ACCELERATING IMPLEMENTATION

       NGO’s – informing / new approaches, partnering,
          engaging constituencies / implementing


                                          METRO MANILA

                           What Dots Are Already Connected?

                          What dots can be easily connected?

                                      What needs to be added
                                   (locally and system wide)?

    What benefits can be reaped? Social, ecological economic?

                              Who else should be at the table?

What policies, business models, marketing approaches can help
                                      address the challenges?

                                     When does the fun start?


                                                                        16
11/29/2011


             THE TRANSFORMATION BEGINS:

 STEP 1: NAME THE DOTS. ACCENTUATE THE POSITIVE

                       1 minute each


                       • Your Name

                    • Your effort / group

• The thing you’re most proud, happy, excited, hopeful about

    • One other person / group you’d bring to the table


                  SMART CONNECTIONS:

 • http://um-smart.org/blog or email me susanz@umich.edu

 • Living Labs (in pilot communities & regions) & NETWORK

           • Primer (Connecting & Transforming)

• Global Learning Community (education & capacity building)

• SMART Exchange collaborative tool -- smartumich.ning.com

                     • Business network

                  • Research collaborative

  • Regular gatherings / summits of the “systems” network


                                                                      17
ANNEX 4
             Metropolitan Manila Transport and
Traffic Development and Management Program
Source: National Statistical Coordination Board


                                                  1
Circumferential Roads
C-1   Claro M. Recto Avenue, P. Casal St., Ayala Boulevard and P. Burgos St.

C-2   Tayuman Road, Arsenio Lacson Avenue, Nagtahan Boulevard and Quirino
      Avenue

C-3   Libis Gochuico St., 5th Avenue, Sgt. Rivera St., G. Araneta Avenue, South
      Avenue, Makati Avenue, Ayala Avenue and Gil Puyat Avenue

C-4   Letre Road, Samson Road and EDSA

C-5   C.P. Garcia Avenue, E. Rodriguez Jr. Ave., Boni Serrano Ave., Katipunan
      Avenue, Congressional Ave. Ext., Tandang Sora Ave., Mindanao Ave., and NLEX

Radial Roads
R-1   Delpan St., Bonifacio Drive, Roxas Boulevard
R-2   Antonio Villegas Road, Taft Avenue and E. Quirino Avenue
R-3   Metro Manila Skyway SLEX
R-4   Pedro Gil. St., Tejeron St., J.P.Rizal St., J.P. Rizal Ext. and Pasig River Expressway
R-5   Ramon Magsaysay Boulevard, V. Mapa Boulevard, P. Sanchez St., Shaw
      Boulevard and Pasig Boulevard
R-6   Legarda St., R. Magsaysay Boulevard, Aurora Boulevard & Marcos Highway
R-7   Quezon Boulevard, Lerma St., Quezon Avenue, Elliptical Road, Commonwealth
      Avenue, Quirino Highway and Manila-Del Monte-Garay Road
R-8   Alfonso Mendoza St. Dimasalang St., A. Bonifacio Avenue and NLEX
R-9   McArthur Bridge, Rizal Avenue, Manila North Road, McArthur Highway
R-10 Pres. Marcos Highway and Manila-Bataan Coastal Road


                                                                                               2
2008           2009        2010
         PHILIPPINES                 5,891,271      6,220,433   6,634,855
              NCR                    1,670,150      1,768,033   1,904,395
                           CARS        423,759       415,568     435,473
            UTILITY VEHICLES           525,342       526,910     558,123
 SPORTS UTILITY VEHICLES               112,887       121,984     145,438
                          BUSES             9,521     12,319      14,184
                        TRUCKS          61,336        68,119      69,181
             MOTORCYCLES /
                 TRICYCLES
                                       525,082       608,839     667,424
                      TRAILERS          12,223        14,294      14,572

Source: Land Transportation Office
                                                                       5


                                                                            3
No. of           85
terminals
in Metro
Manila
Terminals        Sampaloc =29
clusters         EDSA – Cubao = 26
                 EDSA – Pasay = 19
                 Buendia – Pasay=7
                 Monumento =4
No. of     60
provincial
bus
companies
No. of PUB 7,368
units


                                                            FRANCHISE            UNIT
METRO MANILA CITY BUS                                                92           5,083
METRO MANILA PROVINCIAL BUS                                         653           6,999
SHUTTLE SERVICE                                                     151           1,227
TAXI                                                                236           14,038
TOURIST BUS                                                          32            876
TOURIST CAR                                                          20           1,575
TRUCK FOR HIRE                                                      410           15,902
UTILITY VEHICLE                                                     125           2,814
                    TOTAL                                        1,719           48,514


SOURCE: Land Transportation Franchising and Regulatory Board (LTFRB) Data Base


                                                                                           4
Northrail
                                                                                    MRT7
                                             LRT 1 NORTH EXT (Closing the Loop).


                                                     MRT4                            LRT2


                                                                                        MRT8


                                                                          MRT3
                       LRT1
        PROPOSED


          EXISTING
                                         h


                                                                PNR Northrail-Southrail Linkage Phase 1
                                nsio Sout


               LRT Line 2                                       (Caloocan-Alabang, 34 km)
                            Exte Line I


               PNR Line
                                    n


               LRT Line 1
                                                                       PNR Northrail-Southrail Linkage Phase 2
                             LRT


               Metro Star                                              (Alabang-Calamba, 27 km)


     PARTICULAR                          LRT 1                     LRT 2             MRT 3                PNR
                                    (including the               (Mega Tren)       (Metro Star)
                                     line 1/MRT 3
                                         Loop)
No. of Light Rail                             111 LRVs            13 train sets       73 LRVs          18 LRV
Vehicles (LRV)
(operational cars,
coaches or train sets)
Capacity per LRV, Car or             81 seated/293                232 seated/       80 seated/      194 seated/
Coach (passengers)                     standees                   349 standees     314 standees     360 standees
Annual Ridership                     155.91 Million               63.36 Million     153 Million     9.138 Million
                                        (2010)                       (2010)           (2010)           (2009)
Daily Average Ridership                       427,151                172,850          420,482          397,989
                                               (2010)                 (2010)           (2010)           (2009)

SOURCE: Department of Transportation and Communication


                                                                                                                    5
SOURCE: Department of Transportation and Communication


                                                Non Fatal        Damage to   Grand
        Month                   Fatal
                                                 Injury           Property   Total
January                          33              1,266             4,780     6,079
February                         24              1,309             4,830     6,163
March                            32              1,296             5,156     6,484
April                            31              1,185             4,821     6,037
May                              30              1,164             5,037     6,231
June                             34              1,120             4,960     6,114
July                             42              1,298             5,642     6,982
August                           37              1,355             5,405     6,797
September                        34              1,244             5,294     6,572
October                          25              1,170             5,265     6,460
November                         27              1,269             4,799     6,095
December                         31              1,143             5,465     6,639
     Grand Total                 380             14,853            61,705    76,938
SOURCE: Metro Manila Accident Reporting and Analysis System (MMARAS)


                                                                                      6
Non Fatal         Damage to            Grand
        Month                     Fatal
                                                 Injury            Property            Total
January                            34            1,397              4,717              6,148
February                           35            1,218              4,508              5,561
March                              34            1,385              5,134              6,553
April                              30            1,230              4,329              5,589
May                                30            1,091              4,274              5,395
     Grand Total                  168             6,321                22,962          29,446


SOURCE: Metro Manila Accident Reporting and Analysis System (MMARAS)


                                          Non Fatal         Damage to
                      Fatal                                                      Grand Total
 Month                                     Injury            Property

               2010       2011          2010    2011      2010         2011     2010      2011
January           0           0            8      2        28           11      36         13
February          1           0           35     24        106          60      142        84
March             2           2           26     27        111          74      139        103
April             0           0           24     32        93           80      117        112
May               1           1           18     19        42           49      61         69
  Grand
                  4           3         118     104        380          274     495        381
  Total


SOURCE: Metro Manila Accident Reporting and Analysis System (MMARAS)


                                                                                                 7
2010                                         2011
    TYPE OF
    PERSON
   INVOLVED           KILLED      INJURED          TOTAL          KILLED        INJURED       TOTAL


      DRIVER            0            66              66                0          62           62
  PASSENGER             1            41              42                1          81           82
 PEDESTRIAN             3            21              24                2          20           22

      TOTAL             4           128             132                3         163           166


SOURCE: Metro Manila Accident Reporting and Analysis System (MMARAS)


   NO PHYSICAL CONTACT APPREHENSION ALONG COMMONWEALTH AVENUE
                period coverage (January 26 to April 10, 2011)

              VIOLATION                    BUS             PRIVATE         PUJ      TAXI     TOTAL
  1      PUV LANE ORDINANCE               11,636              0            29        1       11,666
  2     LOADING/UNLOADING IN               991                0             1        5        997
           PROHIBITED ZONE
  3         RECKLESS DRIVING                 16               0            0           0      16
  4          ILLEGAL PARKING                  0               1            0           1      2
               (NOT TOWED)
  5        OPEN DOOR POLICY                 130              0             0            0     130
  6         OVERSPEEDING                    452             648            9           235   1,344
  7          OBSTRUCTION                     3               0             0            0      3
                   TOTAL                  13,228            649            39          242   14,158

 No. of Summon/Citation mailed = 10,422


                                                                                                      8
COLORUM
        MONTH                            PERCENT INCREASE /
                    2010      2011
                                             DECREASE
JANUARY               55      188              242%
FEBRUARY              78      88                13%
MARCH                 89      172               93%
APRIL                 56      84                50%
MAY                   65       ---               ---
JUNE                  53       ---               ---
JULY                 132       ---               ---
AUGUST               248       ---               ---
SEPTEMBER            209       ---               ---
OCTOBER              129       ---               ---
NOVEMBER             168       ---               ---
DECEMBER             141       ---               ---
         TOTAL      1,423     532


1. Obstructions and illegal structures along the
   carriageways
2. Outmoded traffic signal system
3. Poor road condition
4. Inadequate public transport
5. Vehicular and pedestrian accidents
6. Low or weak enforcement of transport and
   traffic related-laws/regulations, and
7. Lack of discipline and poor road behavior


                                                              9
FLAGSHIP PROGRAMS


                    10
● Establishment of the Mega Manila Provincial Integrated Bus
  Axis System (MM-PIBAS)
● Development of Airport Tram System
● Installation of Intelligent Transport System
● Development of alternative modes of transport


• Installation of road signs and markings following
  international standards
• Construction of rotundas
• Landscaping and beautification


                                                               11
● Construction of short span left-turn fly-over

                                             Possible Sites:

                                             1.MIA Road –
                                               Domestic Road
                                             2.Roxas Boulevard
                                               – MIA Road
                                             3. North Avenue –
                                               Mindanao Avenue


● Replacement of high-pressure sodium streetlights to
energy - efficient LED lights


                                                                 12
13
LOCATION                         PEDESTRIAN COUNT                                             LOCATION                         PEDESTRIAN COUNT
1 ALABANG - SOUTH SUPER HIGHWAY/MONTILLANO (INFRONT OF JOLLIBEE)              449,848 35 EDSA - NORTH AVENUE b                                                              104,580
2 AMA SOUTH SUPER HIGHWAY - MAKATI                                                  … 36 EDSA - ORTIGAS AVENUE b                                                            129,331
3 AURORA BOULEVARD - ARANETA CENTER b                                          19,378 37 EDSA - PROJECT 7                                                                    10,227
4 AURORA BOULEVARD - KATIPUNAN AVENUE b                                        29,627 38 EDSA - QUEZON AVENUE a                                                             121,352
5    BICUTAN INTERCHANGE a                                                    202,223   39   EDSA - ROOSEVELT AVENUE b                                                      114,532
6    C.M. RECTO - LEGARDA - MENDIOLA                                           91,013   40   EDSA - SM NORTH ANNEX                                                           23,445
7    C4 - DAGAT-DAGATAN                                                        47,757   41   EDSA - TAFT AVENUE                                                             169,764
8    C5 - BETWEEN MARKET MARKET & PETRON (MINI PARK)                            2,952   42   EDSA - TINIO                                                                     6,089
9    C5 - BLUE BOZ                                                              8,611   43   EDSA BETWEEN NORTH AVE. & QUEZON AVE. (CENTRAL TERMINAL)                         6,664
                                                                                        44   JUAN LUNA - TAYUMAN (PRITIL)                                                     4,780
10   C5 - DIEGO SILANG                                                         10,686
11   C5 - EASTWOOD AVENUE                                                      16,641   45 MARCOS HIGHWAY - A. RODRIGUEZ / LIGAYA ab                                          7,135
12   C5 - INFRONT OF CENTENNIAL VILLAGE                                         1,218   46 MARCOS HIGHWAY - F. MARIANO / MANILA BAPTIST b                                    13,568
13   C5 - JULIA VARGAS b                                                        6,125   47 MARCOS HIGHWAY - IMELDA AVENUE / STA. LUCIA ab                                    62,053
14   C5 - KALAYAAN AVENUE                                                       5,828   48 MARCOS HIGHWAY - INFRONT OF MONTE VISTA SUBDIVISION b                              2,476
15   C5 - MERCURY                                                               1,480   49 MARCOS HIGHWAY - TAYUG ab                                                          8,455
                                                                                                                                            b
16   COMMONWEALTH AVENUE - BATASAN                                             74,679   50   MARCOS HIGHWAY INFRONT OF SAN BENILDE SCHOOL                                     3,708
17   COMMONWEALTH AVENUE - INFRONT OF COA                                       9,663   51   MC ARTHUR HIGHWAY - GEN. T. DE LEON STREET (KARUHATAN)                           5,873
18   COMMONWEALTH AVENUE - INFRONT OF DILIMAN PREP.
                                                       a
                                                                                9,361   52   MINDANAO AVENUE - TANDANG SORA                                                  14,577
19   COMMONWEALTH AVENUE - INFRONT OF IGLESIA NI CRISTO                        11,340   53   QUEZON AVE. BETWEEN SCOUT CHUATOCO & ROOESEVELT                                  7,891
20   COMMONWEALTH AVENUE - INFRONT OF ST. PETER CHURCH                          6,304   54   QUEZON AVENUE - ARANETA AVENUE b                                                45,488
21   COMMONWEALTH AVENUE - LUZON AVENUE (PUREGOLD)                             26,305   55   QUEZON AVENUE - BANAWE b                                                        12,639
22   COMMONWEALTH AVENUE - TANDANG SORA                                        16,464   56   QUEZON AVENUE - ESPAŇA ROTUNDA                                                  24,217
23   COMMONWEALTH AVENUE - UP AYALA TECHNO HUB                                  2,630   57   QUEZON AVENUE - ROCES AVENUE b                                                  10,839
24   COMMONWEALTH AVENUE INFRONT OF U.P. AIT                                    3,097   58   QUEZON AVENUE - SCOUT BORROMEO                                                   8,998
25   DR. SANTOS AVENUE - NEAR CANAYNAY AVENUE (EVACOM)                         12,494   59   QUEZON AVENUE - SCOUT MAGBANUA b                                                 4,362
26   EDSA - AURORA BOULEVARD                                                  153,006   60 QUEZON AVENUE - STO. DOMINGO b                                                    14,468
27   EDSA - BAGONG BARRIO (GEN. TIRONA) b                                      15,864   61 QUEZON AVENUE - WEST AVENUE b                                                     12,309
28   EDSA - F.B. HARRISSON                                                      8,387   62 QUEZON AVENUE INFRONT OF LUNG CENTER                                               3,404
29   EDSA - GEN. MALVAR STREET                                                  7,997   63 ROXAS BOULEVARD - MIA ROAD                                                        57,605
30   EDSA - INFRONT OF CENTRAL COMMERCIAL ARCADE                               18,628   64 ROXAS BOULEVARD - US EMBASSY, MANILA                                                   …
31   EDSA - KATIPUNAN STREET NEAR BALINTAWAK                                   12,794                                                                   TOTAL:           2,342,463
32   EDSA - LIBERTAD                                                            6,021
                                                                                        a
33   EDSA - MAIN AVENUE                                                         6,401        footbridge with ramp
34   EDSA - MONUMENTO INFRONT OF MCU b                                         36,812   b
                                                                                             footbridge with stair step cover


                                                                                                                                                                                      14
DIRECTION           2010         2011         % CHANGE
                TRAVEL TRAVEL TRAVEL TRAVEL TRAVEL  TRAVEL
                 TIME SPEED    TIME   SPEED  TIME    SPEED
                                                            20%       22.82%
NORTHBOUND       0:43:56    33.18     0:35:09    40.75
                                                          DECREASE   INCREASE


                                                           12.20%     26.38%
SOUTHBOUND       0:57:30    24.87     0:50:29    31.43
                                                          DECREASE   INCREASE

                                                           15.58%     24.36%
  AVERAGE        0:50:43    29.03    0:42:49     36.09
                                                          DECREASE   INCREASE

Source: MMDA-TEC
Date of Survey: November 11, 2010 and February 17, 2011


                                                                                15
BACLARAN ( REDEMPTORIST - ROXAS BLVD.)


                                         16
17
18
19
Maraming Salamat


                   20
ANNEX 5
Background and Overview of the Project on Catalyzing
     New Mobility in Cities: the Case of Metro Manila
11/29/2011


Catalyzing New Mobility in Cities:
The Case of Metro Manila
                              ATENEO SCHOOL OF GOVERNMENT
                              The Graduate School of Leadership and Public Service


  What are the Expected Take-Aways
  from this Inception Meeting
      An understanding of the background, objectives, scope,
       and deliverables of the New Mobility in Metro Manila
       project
      A shared awareness of the related initiatives of key
       partners
      An initial discussion of the focus and approach of the
       proposed major research components of the project
      A road map of the process of cooperation and
       conversation among stakeholders over the next year
      An openness to the idea that a new perspective like
       New Mobility may help trigger positive changes in the
       Metro Manila traffic situation


                                                                                             1
11/29/2011


          Let us stop battling traffic
          congestion and think for a moment
         Is it possible the ordinary Metro Manilan is left out in the planning and
          operation of the transport and traffic system in Metro Manila?
         Is it possible the ordinary Metro Manilan has valuable exclusive but
          segmented and fragmented knowledge of the existing Metro Manila
          traffic and transport system?
         Is it possible there are types of stakeholders in Metro Manila traffic and
          transport system we have not heard of and from?
         Is it possible our preferred strategies for dealing with traffic congestion
          in Metro Manila may not be the most effective, efficient, or equitable
          approaches to the problem?
         Is it possible there are innovative initiatives that have worked to
          increase mass mobility in other countries that we have not considered
          for Metro Manila?
         Is it possible we have sought to serve rather than to empower the
          people?


Purpose
   The project focuses on the introduction and use of New
    Mobility as a lens in search of more sustainable and
    innovative solutions in the urban public transport system in
    Metro Manila, in particular, ensuring that the needs of the
    poor and the vulnerable are met.
   It aims to utilize and complement existing studies by initiating
    a sustainable Metro wide conversation among stakeholders to
    introduce the New Mobility framework and find out how they
    can begin actualizing their vision the future of the public
    transport system.


                                                                                                2
11/29/2011


Attention to the Poor and
Vulnerable Sectors

   The project considers how the current public
    transport system affects the poor and the
    vulnerable population of Metro Manila and
    gives importance to identifying new or
    emerging entrepreneurial or livelihood
    opportunities responsive to the mobility needs
    of the general public especially of the poor and
    the vulnerable.


The New Mobility initiative
   Incorporates the dimensions of
    sustainability in transportation such as
    social equity, economic and financial
    well-being, health, ecology, physical
    environment, air quality and noise and
    climate change.


                                                               3
11/29/2011


The New Mobility initiative
   Enlarging the discourse on transport by
    promoting a multi-disciplinary, multi-sector,
    top-bottom and bottom-top approach to
    address the issue of moving people and
    goods and making the existing transport
    infrastructure and services really work for
    all.


New Mobility Initiative
   The Initiative helps provide an enabling
    environment in the transport sector to
    ensure stakeholders’ involvement
    particularly that of the poor and the
    vulnerable to expand their mobility-related
    choices.


                                                            4
11/29/2011


Implementing Organization
   This Project is another expression of Ateneo de
    Manila University-School of Government’s
    (ASoG) Knowledge and Practice Areas (KPA)
   KPAs conduct action researches with partners
    from government, civil society organizations,
    private sector, communities and development
    organizations, the results of which are then fed
    into its academic and executive training
    modules.


Project Collaborators
   ASoG will collaborate with the University of
    Michigan’s Sustainable Mobility & Accessibility
    Research & Transformation (SMART) and
    World Resources Institute (WRI)-EMBARQ
    India, themselves in search of actionable
    opportunities for demonstrating the efficacy
    and responsiveness of the New Mobility
    paradigm to the poor and vulnerable sectors
    of society.


                                                               5
11/29/2011


Rockefeller Foundation
   This search for actionable opportunities in New
    Mobility is made possible by a grant from the
    Rockefeller Foundation, which has a century-old
    tradition and success in funding strategic
    initiatives that significantly improve overall
    human well-being.


Three Main components over next
12-months
 Stakeholder workshops
 Mapping and Research
 Information and Promotion


                                                              6
11/29/2011


    Multi-Stakeholder Workshops
       Envision multi-stakeholders in Metro Manila’s mobility
        system -- the policy makers, in particular Metropolitan
        Manila Development Authority(MMDA) and Metro
        Manila Local Government Units (LGUs), the private and
        civil society sectors – are engaged in Metro-level
        mobility summits and workshops to create a system of
        discourse, engagement, and ownership in the project


    Research
   Mapping of the ”visible” (physical) and invisible
    (“behavioral”) public transport system, especially the
    informal hubs in Metro Manila
   Understanding the impact/costs of (inefficient) public
    transportation particularly on the poor and vulnerable in
    MM and
   identification and classification of emerging (or existing)
    entrepreneurial or livelihood opportunities and
    determining policy or market barriers and/or enablers, and


                                                                          7
11/29/2011


Knowledge Sharing
   Knowledge Sharing is designed for stakeholders to
    better understand the New Mobility initiative. The
    project complements the iBoP Asia’s core programs in
    Enabling Innovation in Policy, Learning and Capacity
    Building and Business for Inclusive Development.
   It is expected that the Search develop a new platform,
    resource centre and enabler of innovation for socially
    inclusive mobility in the region using Metro Manila as a
    case study.


New Mobility Imbues Metro Manila Traffic
and Transport Action Plan with an
Inclusiveness Dimension

 Inclusiveness in Safety
 Inclusiveness in Mobility
 Inclusiveness in Productivity
 Inclusiveness in Civility


                                                                       8
11/29/2011


What the Government aims for
Metro Manila
   Inclusiveness – design the transportation system for the
    pedestrian, the bicyclist, the commuter, the short to
    long tripper, the inner-outer tripper
   Safety – design safety for the pedestrian
   Mobility – design mobility for the pedestrian
   Productivity – design productivity for rich and poor,
    students and professionals alike
   Civility – design civility into interactions – focus on
    cooperative vs conflictful interactions, solving common
    problems rather than filing cases in court, etc.


Getting the Others On Board --
Target Beneficiary Motivation

• Car-Owners, Commuters, Bikers,
  Pedestrians
• Metro Manilans, Mega Manilans, Other
  Filipinos
• Past, Present, Future Generations


                                                                       9
11/29/2011


Building an Enabling Environment for
Multi-Stakeholder Empowerment

 Shared Knowledge
 Discourse and Ferment
 Mobility and connectivity Initiatives


New Mobility Facts
 Where are the informal transportation
  hubs? What are the attributes of this
  network? How does it compare with the
  formal network?
 What is the formal transportation
  network as planned? What is the formal
  network as it actually exists?
 How do Metro Manilans actually combine
  modes, services, etc. of transportation to
  reach their destinations?


                                                      10
11/29/2011


Economics of Mobility
 What are the costs of poor access to
  transport to the urban poor and
  vulnerable sectors?
 What contributions to productivity will
  democratized access to transportation
  generate?


Social enterprise
 What are the entrepreneurial
  opportunities and solutions that exist or
  can be generated to make transport more
  democratically accessible?
 How can we encourage the poor and the
  vulnerable to participate in transport-
  oriented enterprises?


                                                     11
11/29/2011


Governance, Not Government
   Focus on building habits of cooperative decision-making,
    not enforcement rules
   We are always told – never say “lack of resources” is
    the problem
   In this project, we restrain ourselves from saying that
    government “policy” is the problem.
   Rather than waiting for the right policy, we ask, what
    can target beneficiaries do to improve the mobility of
    the poor and vulnerable Metro Manilans, and how can
    they continue to develop the capacity and persistence
    to continue enhancing their mobility by absorbing more
    workable ideas and innovations.


Connect “Islands” of transportation
systems
  As highlighted in the SMART Primer (2011), transportation
   can be viewed as a “system of systems”, connecting nodes,
   services, technologies and designs according to the best
   option for the purpose.
  Thus, the concept of transportation goes beyond
   infrastructure. It involves behavioral mobility changes as well
   as innovations coming from various stakeholders.
• It even involves building bridges across “mobility enclaves”
   (e.g., TODA districts) bounded by belts of “uncharted”
   territory
  We must learn that mobility is the means, accessibility is the
   goal.


                                                                            12
11/29/2011


        Paradigm for New Mobility In Metro Manila
                Current Situation                            New Approaches
Goal            Mobility via additional road capacity        To provide accessibility; demand is managed through road capacity and utilizing
                seems to be the goal.                        other means and connections like Pasig River and all other available modes.
                                                             Public transport that is multi-modal and interconnected is central; a people-
                                                             centered approach
Basis           Deterministic model forecasts by technical Plans are based on sustainable policies and strategic planning; robustness,
                experts; outputs provide the answers: a    technical soundness, and stakeholder support are criteria for policy/project
                detailed plan with good rates of return    adoption.
Preparation for Usually based on old studies; use of simple Preparation for the future involving various stakeholders is central; more relevant
an uncertain    sensitivity testing.                         strategies and projects result.
future          In the public sector, the decision-making is
                fragmented and prone to morphing with
                changes in political winds.

Content         Building projects, mainly roads, bridges,    Scoping, research and management/integration of the existing transport system;
                flyovers within the city; frequent           focus on inter-modal public transport modes and non-motorized transport systems
                megaprojects.                                including pedestrian improvements
                                                             The approach is interdisciplinary and is expected to involve all the sectors.
Financing       Affordability is assumed. Reliance on        Affordability is an input and financial and technical planning proceed together;
                national government for funding of           focus on sustainability of operations and role of private sector (PPP approach) and
                transport infrastructure.                    entrepreneurs especially in transportation information systems, network
                                                             optimization strategies and business opportunities (employment opportunities),
                                                             incentives programs etc.
Stakeholder     Plans devised by technical experts using     Strong stakeholder involvement and influence; technical inputs are fit for purpose;
involvement     transport models; little stakeholder         strong consensus is a requirement.
                influence.
Implementatio Seen as a problem to be sorted out later       Implementation processes are put in place and impediments are addressed early.
n                                                            Identification of market and policy barriers and enablers.
Governance      The planning process is often politicized;   The planning process is technocratic and informs hard political decisions;
and             often, technical analyses provide            improved governance is a prerequisite; the focus is on creating an enabling
institutions    justification for political decisions        environment


                                                                                                      Project Organization

                      Project Organization
  Project Director                  Provide overall direction and coordination and oversee
                                    implementation of the New Mobility Project
  Project Manager                   Oversee the manage the day-to-day implementation of the Project
                                    Plan
  GIS Expert                        Provide key background information and analysis of the visible and
                                    invisible public transport sector in Metro Manila
  Economist
                                    Examine the existing and emerging entrepreneurial or livelihood
  Social Enterprise                 opportunities (including finding models/ideas from other
  Specialist                        countries/cities) generated by the public transportation systems.

                                    Identify how the current and planned programs complement and
                                    overlap with the policies and governance/institutional arrangements,
                                    including identifying policy, market barriers, and/or enablers for the
                                    new mobility
  M&E Specialist                    To monitor and evaluate the progress/ deliverables of the project
                                    following iBoP Asia framework
  Support Staff                     Senior Research Associate
                                    Communication Associate
                                    Project Associate


                                                                                                                                                          13
11/29/2011


Project Components
                               Sustained
                                                                 Increased
                           Multi-Stakeholder
                                                             Accessibility for All
                           Discourse on New
                                                              Metro Manilans
                                Mobility


                          Research (Key Gaps           Profile Raising &
Workshops & Fora
                           in Existing Data)          Knowledge Sharing


                                                                                     Govern-
                                                                                      ment
                                                    Identifying Existing &           Policy &
   Mapping the Public     Transportation Cost of
  Transport System in     the Poor and Vulnerable
                                                      Emerging Entrep &               Action
                                                    Livelihood Opp in the
     Metro Manila         Groups in Metro Manila
                                                        Transp Sector


              Growing a Research Framework
                  The research framework for the study is a work in progress,
                   subject to stakeholder consultation and inputs
                  Key to the success of the research and mapping process is to
                   come up with specifications of the outputs that will be
                   responsive to the needs of target beneficiaries who are now
                   being asked to articulate a vision and take action on access
                   to transport issues.
                  Descriptive model – what are the physical and behavioral
                   patterns out there?
                  Explanatory model – what are the drivers of the existing
                   traffic and transport situation in Metro Manila
                  Prescriptive model – what should we do to democratize
                   access to transport?


                                                                                                       14
11/29/2011


Indicative Project Work Program


    Follow-on Presentations
      Research Projects
      Other Project Activities


                                         15
11/29/2011


Metro Manila is indestructible

   Manila was the second most devastated city
    after World War II, after Warsaw, Poland
   It will survive and will persist in time.
   But we should be able to shape it in accordance
    with the collective vision and aspirations of the
    people to better well-being.
   It is up to people to get what they think they
    deserve


         Maraming Salamat Po!

         END OF
         PRESENTATION


                                                               16
ANNEX 6
Mapping of Public Transport Networks
11/29/2011


   Mapping of Public Transport
          Networks


               Jun Castro, Dr. Eng.
                   27 Oct 2011


   The need for database in planning


 Effective planning requires a reliable database

 Lack of common-use database for planning purposes
  makes decision-making difficult and prone to political
  intervention

 Hence, there is a need to establish a common
  comprehensive database system to provide base
  information for urban and transport planning


                                                                   1
11/29/2011


                Database concepts


 Database - a collection of structured data, including the data
  dictionary that describes the data, the data integrity rules used
  to protect the data, as well as stored procedures which enable
  users to access the database.

 Database system - a data processing system composed of the
  database and its database engine, user interfaces, application
  programs and communication software.

 Database systems can be implemented on different computer
  platforms ranging from a single desktop personal computer to a
  cluster of computers and workstations in a networked
  environment.


 Types of Data in a Planning Database

 Two types: spatial data and attribute data

 Spatial data - data that can be displayed, manipulated and
  analyzed by means of a spatial attribute, normally provided in
  the form of coordinate points, denoting a location on the surface
  of the Earth. Classified into two fundamental forms - raster
  and vector.

 Attribute data - relate to characteristics of real world features,
  which include demographic characteristics and socio-economic
  data. They cannot be analyzed or displayed spatially until they
  are digitized and registered to a particular geographic
  coordinate system


                                                                               2
11/29/2011


                                               Spatial data types

                                                                                        Spatial data       Attribute data
                                                                                                           Land Parcel
                                                                                                            Owner
                                                                                                            Value
                                        Spatial data                                                        Land use
                                                                                                            Zoning

                                                                                                           Utilities
                                                                                                            Water Mains
                                                                                                            Electricity
        Vector data                                          Attribute data                                 Telephone

                                                                                                           Transportation
                                                                                                            Road network
Topographic     Application                            Demographic      Scanned
   Base            Data                                                  Maps                               Traffic flows

                                                                                                           Administrative
                                 Raster data                                                                Electoral Districts
                                                                                                            Postal Districts
                                                                                                            Local Authorities
                  Spatial data
                                                                                                           Statistical
                    Layers
                                                                                                            Population
                                                                                                            Socio-economic data
                                                                                                            Planning zones

                                                                                                           Natural Resources
  GIS as suitable platform for                                                        Common Spatial
                                                                                      Referencing
                                                                                                            Land Cover
                                                                                                            Water Resources
  spatial and attribute data                                                          Framework             Geology
                                                                                                            Forestry
                                                                                                            Agriculture


              Geographic Information System (GIS)
                                                                               a computer-based technology
                                                                                designed to:
                                                                                 1. capture geographic data from
                                                                                    various sources, and
                                                                                 2. process these data to produce
                                                                                    information and graphical
                                                                                    outputs

                                                                                  in support of planning,
                                                                                      management and decision-
                                                                                      making concerning the
                                                                                      utilization of land resources

                                                                                   a computer-based tool for
                                                                                    mapping and analyzing things
                                                                                    that exist and events that
                                                                                    happen on earth.


                                                                                                                                           3
11/29/2011


           GIS structure: Thematic Layers
                                            Addresses


                                            Boundaries


                                            Land use/land
                                            cover

                                            Parcels


                                            Planimetry - Buildings,
                                            streets, water bodies

                                           Orthophoto with
                                           contour

                                           Geodetic Control


              Focus Areas for the Study

 Due to limitation on time and resources, focus on 4-5
 areas along EDSA
      North Ave MRT station
      Quezon Ave Station
      Cubao Station
      Ortigas Station
      Ayala Station

 PT transport data will be collected on proximate areas
 (within 500m radius from the MRT Station)
      PT routes
      Terminals/Embarkation/Disembarkation points
      Parking areas
      Pedestrian facilities
      U-turns, etc.


                                                                              4
11/29/2011


         Transport Database and Sources

 Road network and capacities (MMDA, DPWH)
 Vehicle types and volumes (MMDA, DPWH)
 Public Transport services (rail, jeepney, bus, tricycles,
  etc) (DOTC, LTFRB, LGUs)
     PT Routes
     Terminals/Embarkation/disembarkation areas
     Coverage areas
 Pedestrian improvements (MMDA, LGUs)
   Facilities (pedestrian lanes, walkways) and Services (elderly ,
    persons with disabilities, pregnant women)
 Traffic Management (MMDA)


                    SAMPLE MAPS


                                                                              5
11/29/2011


Road network: Number of lanes


   Public Transport Routes


                                        6
11/29/2011


 PT Facilities: North Ave Station


PT Facilities: Quezon Ave Station


                                            7
11/29/2011


PT Facilities: Cubao Station


PT Facilities: Ortigas Station


                                         8
11/29/2011


       PT Facilities: Ayala Station


Database can be shared using Google Earth


                                                    9
11/29/2011


Thank you for your attention.


                                       10
ANNEX 7
Impact and Cost of Public Transport
    on the Poor and the Vulnerable
Ateneo School of Government                                                                                      11/29/2011


                     Catalyzing New Mobility in Cities:
                        The Case of Metro Manila
                                            Inception Meeting
                        Gateway Suites, 4th Floor Gateway Mall, Araneta Center, Cubao, Quezon City
                                                     October 27, 2011


                                                                                    with generous support from


                                    Impact and Cost of Public
                                   Transport on the Poor and
                                              the Vulnerable


                                                  Randolph D. Carreon, MATP, BSEcon
                                                                            Transport Economist


                                                                                                                         1
Ateneo School of Government                                                                                   11/29/2011


                                                     Background
                              •   The poor comprise a considerable part of the population of Metro
                                  Manila.
                              •   The cost of transport, specifically that of public transport, has been on
                                  an increasing trend over the past few years.
                              •   The increasing cost of public transport has a much greater impact on
                                  those within the lower income brackets.
                              •   Vulnerable groups include (i) Persons With Disability (PWDs), (ii) Senior
                                  Citizens, and (iii) Women and Children.
                              •   These sectors have specific transport needs.
                              •   The transport needs of these vulnerable groups have relatively received
                                  less attention.

                              •   Public transportation plays a vital part of the transport system in Metro
                                  Manila.
                              •   It is estimated that approximately 78% of all person trips are made
                                  through public transport.
                              •   An inefficient public transport system entails (i) higher transport costs
                                  and (ii) other non–quantifiable costs.


                                      Objectives of the Study
                              •   The Study aims :
                                   – to understand the nature of the transport needs,
                                     accessibility, mobility and transport costs of the poor
                                     and vulnerable groups.
                              •   Specifically, the Study aims to:
                                   – establish the travel demand patterns of the poor and
                                     vulnerable groups;
                                   – look qualitatively into the efficiency of the public transport
                                     system vis-à-vis the needs of the poor and the vulnerable
                                     groups;
                                   – estimate the cost of transport of the poor;
                                   – estimate the actual and desired cost of transport of those
                                     within the vulnerable groups; and
                                   – examine other non–quantifiable costs, if any, incurred by the
                                     vulnerable groups


                                                                                                                      2
Ateneo School of Government                                                                                            11/29/2011


                                          Scope and Limitation
                              •   The Study will cover:
                                   – The “Poor” as those living within “colonies” of informal
                                     settlers.
                                   – The “Vulnerable Groups”
                                       • (i) PWDs, (ii) Senior Citizens, and (iii) Women and
                                          Children.
                                   – An additional category consisting of those working in
                                     Business Process Outsourcing (BPO)will also be covered.
                              •   The Study will use primary and secondary data, covering all the
                                  LGUs in Metro Manila, will be collected
                                   – Primary data will be gathered from selected areas
                                   – Secondary data to be gathered will cover all the LGUs in
                                     Metro Manila


                                  Primary Data Gathering Methodology
                              •   The Study will conduct household interview surveys in:
                                   – At least three (3) informal settler colonies:
                                         • Areas being considerde:
                                              – Barangay Old Balara, Quezon City;
                                              – Along Agham Road, Quezon City;
                                              – Barangay Addition Hills, San Juan; and
                                              – Sangandaan (EDSA Extension), Caloocan City

                              •   The sampling rate for the household interviews will be approximately 2.5% per
                                  area.
                              •   The Study will conduct individual interview surveys among
                                   – (i) PWDs, (ii) Senior Citizens, (iii) Women and Children, and (iv) BPO workers.
                                          • The interviews will be conducted in public places such as public
                                             transport terminals, MRT Stations, malls, to name a few. BPO workers
                                             will be interviewed in their respective offices.
                                   – The target number of samples is 2,000 respondents from among all the
                                        vulnerable groups.
                              •   The Study will conduct Key Informant Interviews (KII) / Focused Group
                                  Discussions (FGD) with organizations of vulnerable groups within the different
                                  Local Government Units in Metro Manila.


                                                                                                                               3
Ateneo School of Government                                                                            11/29/2011


                                              Expected Outputs
                              •   The Study Report:
                                   – Impact and Cost of Public Transport on the Poor and
                                       the Vulnerable
                                   – The analyses will be done to encompass the entire study area.


                              •   Specific Case Studies will be prepared to highlight certain
                                  facets/portions of the Study. These will cover:
                                   –   Typical Family/Household within the informal settler colonies
                                   –   Person With Disability
                                   –   Senior Citizen
                                   –   Working Woman
                                   –   Employee of a BPO


                                                      Time Frame
                                               Activity                     Inclusive Dates
                                    Study Outline                      End - November 2011
                                    (Finalization)
                                    Review of Previous                 November 2011
                                    Studies/Literature
                                    Study Methodology                  End – November 2011
                                    (Finalization)
                                    Data Gathering                     Nov – Dec 2011
                                    Initial Findings                   End-January 2012
                                    Completion of Analyses             Dec 2011 – Feb 2012
                                    (Draft) Final Report               March 2012
                                    Final Report                       End – March 2012


                                                                                                               4
Ateneo School of Government               11/29/2011


                              Thank You


                                                  5
ANNEX 8
Enterprise Landscape and Potentials
11/29/2011


Catalyzing New Mobility in Cities:
   The Case of Metro Manila
                   Inception Meeting
Gateway Suites, 4th Floor Gateway Mall, Araneta Center, Cubao, Quezon City
                              October 27, 2011


                                                           with generous support from


             Ateneo Center for Social Entrepreneurship


                                                                                                1
11/29/2011


             RESEARCH OVERVIEW
        Research Goals & Objectives
        Scope & Limitations

        Preliminary Research Direction
I.       The Social and Economic Dimension of the Transport
         Sector and New Mobility
II.      Mapping the Transport Sector as an Enterprise
III.     Commercial and Enterprise Activities
IV.      Emerging Enterprises and Innovations in New Mobility
V.       Future Directions

        Key Framework Design for Research Questions
        Research Activities & Timeline


     RESEARCH GOALS & OBJECTIVES

I.   Identify existing transportation related social enterprises
     or mobility innovations in the Philippines and other
     countries (i.e. BRT – Colombia, France, Curitiba)
II. Generate ideas and business models on new mobility
     and transport-related social enterprises with high
     potential to benefit the poor and the vulnerable
III. Identify market barriers and enablers for the
     development of new mobility innovations
          Economic (Consumers, Market)
          Social (Relations that govern these elements and dynamics)
          Cultural Patterns and Behaviors


                                                                                2
11/29/2011


                    SCOPE & LIMITATIONS
I.         Focus: Commercial and enterprise component of the
           transport and new mobility sector
       •        More efficient, less cost, safe, convenient and poor
                and vulnerable-friendly transport systems
       •        Market Drivers (Barriers/Enablers)
II. Research activities will involve the following:
    1. Interviews with proponents, managers and customers
       of existing mobility enterprises and projects
    2. Focused group discussions (FGD) / crowd sourcing to
       generate ideas on transport related social enterprises
III. Geographic coverage: Metro Manila
IV. Will not deal substantially on policy issues


       PRELIMINARY RESEARCH DIRECTION
I.         The Social and Economic Dimension of the
           Transport Sector and New Mobility
       •        Social context / Cultural landscape of Mobility in
                Metro Manila
       •        Developments and evolution of the transport and new
                mobility in Metro Manila
       •        Historical changes - economic drivers and rationale,
                sociological perspective
       •        Behavioral Patterns of the transport and new mobility
                market
II.        Mapping the Transport Sector as an Enterprise
III.       Commercial and Enterprise Activities
IV.        Emerging Enterprises and Innovations in New Mobility
V.         Future Directions


                                                                                3
11/29/2011


       PRELIMINARY RESEARCH DIRECTION
I.          The Social and Economic Dimension of the Transport Sector and New Mobility
II.       Going Back to the Roots: The Transport Sector as an Enterprise
       a.    Historical Overview of the Urban Transport Development in Metro
             Manila
       b.    Mapping Metro Manila’s Transport Sector
            1.           Formal
                  i.        Rail Transit
                  ii.       Bus Transit
                  iii.      Jeep
                  iv.       FX
                  v.        Taxi
                  vi.       Tricycle, Pedicab, Padyak (TODA)
            2.           Informal (Collorum, Car Sharing)
       c.         Rationale of the Emergence of the Transport Enterprise Activities
       d.         Market Overview
            1.           Supply – Demand Analysis
            2.           Barriers and Enablers
III.        Commercial and Enterprise Activities
IV.         Emerging Enterprises and Innovations in New Mobility
V.          Future Directions


       PRELIMINARY RESEARCH DIRECTION
I.          The Social and Economic Dimension of the Transport Sector and New Mobility
II.         Mapping the Transport Sector as an Enterprise
III.        Commercial and Enterprise Activities
       1.     Development and Emergence of Commercial and Enterprise
              Activities in Metro Manila
            1.           Historical Background
            2.           Mapping the Developments of Commercial Centers in Manila
            3.           Formal Enterprise Activities
                  i.        Malls, Supermarkets, Restaurants, Boutiques, etc.
                  ii.       Transportation – Goods Hubs (i.e. FTI, Mega Markets, “Bagsakan”)
                  iii.      Other business centers where people gain access to basic goods and
                            services
            4.           Informal Enterprise Activities
                  i.        Street Peddling
                  ii.       Others
       2.         Rationale of the Emergence of the Commercial Enterprise Activities
       3.         Market Overview
            i.           Supply – Demand Analysis
            ii.          Barriers and Enablers
IV.         Emerging Enterprises and Innovations in New Mobility
V.          Future Directions


                                                                                                         4
11/29/2011


       PRELIMINARY RESEARCH DIRECTION
I.          The Social and Economic Dimension of the Transport Sector and New Mobility
II.         Mapping the Transport Sector as an Enterprise
III.        Commercial and Enterprise Activities

IV. Emerging Enterprises and Innovations in the New Mobility
            Paradigm
       1.           Emerging Models and Activities of Enterprise Innovations in
                    New Mobility - Commercial and Social (Business) Enterprises
             •           People
             •           Goods
             •           Services
       2.           Market Overview
             i.          Supply – Demand Analysis
             ii.         Barriers and Enablers
             iii.        Systems and Structural Developments
                    a)     IT
                    b)     Market System
                    c)     Others
       3.           Rationale of Development
       4.           Socio-Economic Potential and Success Factors
       V. Future Directions


       PRELIMINARY RESEARCH DIRECTION
I.          The Social and Economic Dimension of the Transport Sector and New Mobility
II.         Mapping the Transport Sector as an Enterprise
III.        Commercial and Enterprise Activities
IV.         Emerging Enterprises and Innovations in New Mobility

V.          Future Directions
                   Projections of sustainable business models for new
                    mobility social enterprises in Metro Manila – potentials
                    and challenges
                   Replicability of existing models and ideas generated from
                    RRL studies and crowd sourcing activities
                   Role of social enterprises / social entrepreneurship and
                    social business innovation in addressing the new mobility
                    challenges with particular consideration for the poor and
                    vulnerable and other dimensions
                   Dimensions:
             -           Safety      - Health                                   - Economy/Cost
             -           Convenience - Efficiency                               - Environment
                   How will the challenges shape the mobility of people,
                    goods and services?


                                                                                                         5
11/29/2011


Social Entrepreneurship /
Social Enterprise
 Innovative ways of providing solutions to pervasive
  social problem
    Sustainable
    Innovative
    Addresses a social problem
    Enterprising


Examples of Innovations in the
Transport and Mobility Sector
             Mobius                        WMATA
             Motors (Africa)               Trip Planner (DC)


             Capital
             Bikeshare (DC)
                                           RORO
                                           (Phils, Others)
             Suica, Pasmo (Japan)


                                            Bayad Centers
                                            (Phils)
             Bambike (Phils)


                                                                       6
11/29/2011


Key Considerations for Research Framework
            and Guide Questions
 Considerations for emerging new mobility sector:
   - Efficiency (time to get from point A to point B)
   - Cost (cheaper transport fare)
   - Environmental
   - Convenience and Safety

 What are the enterprises - commercial, social and public - that can be introduced and
   implemented to address these concerns

 Proximate demands and supply for new mobility mechanisms – (characteristics of the
   demand segment) consumer profile in terms of segmentation that make up for the
   demand for new transport enterprises/new mobility

 Mechanisms, infrastructures, systems (i.e. IT, control hubs, online reservations,
   applications, information access, etc.) that can support the various needs and
   requirements of the new mobility consumers

 What could be the features of the new mobility system that will be convenient and
   helpful to the consumers (ie. intermodal, centralized)

 What are the incentives and principles that govern/encourages the emergence of new
   models to facilitate mobility of goods, people and services


PRELIMINARY RESEARCH ACTIVITIES & TIMELINE
               • Finalize Research Design and Content
               • Finalize Research Survey and Questionnaire
Nov ‘11        • Output: Research Design, Methodology and Survey Questionnaire


               • Dry-run Survey Activities
               • Output: Field Notes / Preliminary Field Report
Dec ‘11

               • Conduct Preliminary Market Study and Market Analysis
               • Interview Key Sectoral/Institutional Representatives
Jan ‘12        • Output: Initial Market Study Report


                                                                                                  7
11/29/2011


PRELIMINARY RESEARCH ACTIVITIES & TIMELINE

          •   Validation Study
          •   Crowdsourcing
          •   Research Data Processing
Feb ‘12   •   Output: Documentation,of FGDs, Report Draft 1


          • Final Report Writing
          • Output: Final Draft
Mar ‘12


                                                                      8
ANNEX 9
Activities Proposed and Tentative Schedule
Ateneo School of Government                                                                                       11/29/2011


                     Catalyzing New Mobility in Cities:
                        The Case of Metro Manila
                                            Inception Meeting
                        Gateway Suites, 4th Floor Gateway Mall, Araneta Center, Cubao, Quezon City
                                                     October 27, 2011

                                                            Dr. Danielle Guillen, Project Manager
                                                                                     with generous support from


                               Activities Proposed
                               and Tentative Schedule


                                                                                                                          1
Ateneo School of Government                                                        11/29/2011


                          Activities Proposed and Tentative Schedule

                  ACTIVITIES                DATE                   Partners
                  Convening
                  New Mobility Project      January 2012
                  Launch/Mapping
                  Consultative Research     March 2012-April
                  Seminars                  2012
                  Transport & Mobility      July 2012
                  Summit
                  High-level                August 2012
                  consultation meeting


                          New Mobility Project
                          Launch/Mapping, January 2012
                              1.Launch of partnership with MMDA
                              2.Mapping Exercise: Connecting Dots (Good news)
                                 • MMDA & 17 LGUs in Metro Manila
                                 • Public Sectors:
                                   Department of Transportation
                                   Department of Public Works & Highways
                                   Department of Sciences & Technology
                                   Department of Environment & Natural Resources
                                   Department of Labor & Employment
                                   Department of Trade & Industry
                                   Department of Energy
                                   Department of Tourism


                                                                                           2
Ateneo School of Government                                                   11/29/2011


                          New Mobility Project Launching
                               •Media
                                  •Print, radio, tv, web and blogs
                               •Private Sector
                                  • Shopping Malls (Developer &
                                  Management)
                                  • Private Developers
                                  •Companies eg. BPOs
                                  • IT & Telecom
                                  • Lobby Groups – eg. Firefly Brigade,
                                  Cycling lane Advocates
                                  • NGOs


                          New Mobility Project Launching
                               • Academe & Professional Groups
                                  eg. PIEP, TSSP, UAP

                               •International Organizations
                                   • WB, ADB, JICA

                         3. Launching of Crowd-sourcing activity:

                              Innovation Award in Best Practice and/or Idea
                              for Social Enterprise in the Transport Sector


                                                                                      3
Ateneo School of Government                                                  11/29/2011


                          Crowd sourcing is a distributed problem-
                          solving and production model

                              • ensure participatory process
                              • inputs to research
                              • profile raising

                        Social Enterprises      are businesses that trade
                        in the market in order to fulfil social aims. They
                        bring people and communities together for
                        economic development and social gain


                              Innovation Award in Best Practice
                              and/or Idea for Social Enterprise in
                              the Transport Sector
                    Schedule:
                    Planning: Nov – Dec 2011
                    Launch : January 2012
                    Call for Nominations: Feb-Mar 2012
                    Committee deliberation: April 2012
                    Presentation to Rio Entrepreneurship Summit: May
                    2012


                                                                                     4
Ateneo School of Government                                                                                  11/29/2011


                              Innovation Award in Best Practice
                              and/or Idea for Social Enterprise in
                              the Transport Sector
                              Characteristics:
                              Enterprise Oriented -involvement
                              Social Aims - explicit social aims such as job creation, training
                              and provision of local services; ethical values including a
                              commitment to local capacity building; accountable to their members
                              and the wider community for their social, environmental and economic
                              impact.
                              Social Ownership - autonomous organisations with a governance
                              and ownership structure based on participation by stakeholder groups
                              (users or clients, local community groups, etc.) or by trustees. Profits are
                              distributed as profit sharing by stakeholders or used to improve the
                              enterprise, or for the benefit of the community.


                              Planning for the crowd sourcing
                              activity:
                              • Committee
                              • Criteria for selection
                              • Definition/Scale/Categories
                              • Media Plan


                                                                                                                     5
Ateneo School of Government                                                 11/29/2011


                         Activities Proposed and Tentative Schedule
                  ACTIVITIES             DATE                Notes
                  Research Activities    Nov.2011-Mar.2012
                  Mapping of public         Nov.2011-Mar.2012
                  transport service
                  including informal hubs
                  Impact/Cost Study of      Nov.2011-Mar.2012
                  Inefficient Public
                  Transportation System
                  Entrepreneurial &         Nov.2011-Mar.2012
                  Livelihood Opportunity
                  Identification
                  Policy and Market         Feb. –July 2012
                  Barriers


                          Activities Proposed and Tentative Schedule
                          ACTIVITIES               DATE          Notes
                          Profile Raising          Oct2011-
                                                   Nov.2012
                          Crowd sourcing activity: Jan.-Mar 2012 With
                                                                 partners
                          Website                    Jan.2012    Portal
                          Representations to
                          Conference
                          Study Tours for LGUs                   WRI
                          Presentation at the New    May 2012
                          Mobility Entrepreneur’s
                          Conference in Rio
                          Tri-media plan             Oct 2011-
                                                     Nov2012


                                                                                    6
Ateneo School of Government               11/29/2011


                              Thank you


                                                  7

Inception Meeting Documentation Report

  • 1.
    Catalyzing New Mobilityin Cities: The Case of Metro Manila Catalyzing New Mobility in Cities: Inception Meeting Documentation Report The Case of Metro Manila NOVEMBER 2011 The Report was prepared by the Ateneo School of Government for the Rockefeller Foundation
  • 2.
    EXECUTIVE SUMMARY The AteneoSchool of Government’s iBoP Asia (Innovation for Inclusive Development) Program with support from Rockefeller Foundation is implementing a project entitled “Catalyzing New Mobility in Cities: The Case of Metro Manila”. This project aims to use New Mobility as a lens in search of more sustainable and innovative solutions in the transport sector, especially in Metro Manila, that address problems of the poor and the vulnerable. The Inception Meeting was held last October 27, 2011 in Gateway Suites, Cubao, Quezon City and was attended by total of 44 participants from various Local Government Units of the Cities of Quezon, Makati, Marikina, and Mandaluyong; National Government Agencies (Department of Transportation, Metro Manila Development Authority); Non-government Organizations and corporate foundation (Manila Observatory, CAI-Asia, Gawad Kalinga, PLDT-Smart Foundation); the private sector (Ayala land, Inc., Ortigas Center Association Inc.); development organization (The Rockefeller Foundation); and research and academic institutions (Ateneo De Manila University, UP NCTS, University of Michigan). Mr. Benjamin de la Peña (Associate Director for Urban Development of Rockefeller Foundation) highlighted that the more the city is urbanized, the higher the economic growth. However, he emphasized that in order to make a sustainable and liveable city, there is a need to make the pedestrians a priority. Ms. Susan Zielinski (Managing Director, SMART-University of Michigan.) supported this idea and further elaborated that it is within the cities where most opportunities can be sought. The challenge however in moving forward with New Mobility is to connect the dots. But there are reasons to be hopeful for Metro Manila with the participants’ involvement on this. Atty. Yves Gonzales of MMDA presented about the current transport and mobility situation in Metro Manila. He reiterated that the metro comprises 1/8 of the country’s population contributing to a lot of transport-related issues and challenges. The MMDA, however, envisions a world-class, vibrant, safe and healthy metropolis – which can be achieved by implementing effective programs. The project background was presented by Dr. Segundo Romero (iBoP Asia Program Director) followed by the presentation of the Project Team of the research plans for the following: (1) mapping of public transports in the metro; (2) the impact and cost of public transport on the poor and the vulnerable; and (3) the entrepreneurial and livelihood opportunities in the transport sector. Having this multi-sectoral representation of the inception meeting has been instrumental in surfacing of inputs and suggestions to the research plans of the Project. The remarks gathered contributed to determining the focus of the researches, identification of study area(s), key persons and organizations, improving the research methods, defining the variables of the researches, and possible collaborations with LGUs and national government agencies. Moreover, the interaction of participants helped determine the interrelationship and integration of the three researches to better present the baseline of the transport system in Metro Manila, and also the promise of engagements and collaboration with the stakeholders present in the meeting. Dr. Danielle Guillen also presented the Project Activities in the next 12 months and is hopeful to continuously get the support of the stakeholders. Dr. Antonio La Viña gave the closing remarks and emphasized that the issues are solvable and requires a vision even though it may take time and focus. He also expressed enthusiasm to engage with all stakeholders in doing changes in areas possible then connect the dots. Atty. Alu Dorotan read the message from Chairman Francis Tolentino of MMDA. He congratulated the organizers –the Ateneo School of Government and commended the Rockefeller Foundation for supporting new learning and delivering services for the Filipino and conveys his appreciation for making Metro Manila the subject of study and for giving MMDA the chance to participate in this worthwhile undertaking. Chairman Tolentino is optimistic that this study will provide new lessons in looking at transportation beyond infrastructure with the inclusion of the poor and the vulnerable. That it will provide a human face, which is a very important factor in transport management.
  • 3.
    CATALYZING NEW MOBILITYIN CITIES: THE CASE OF METRO MANILA INCEPTION MEETING Topaz Room 2, Gateway Suites, Araneta Center, Cubao, Quezon City 27 October 2011 9:00 am to 3:00 pm HIGHLIGHTS 1. The Ateneo School of Government under its iBoP Asia (Innovation for Inclusive Development) Program with support from Rockefeller Foundation hosted the Inception Meeting held last October 27, 2011 in Gateway Suites, Cubao, Quezon City for the project entitled ―Catalyzing New Mobility in Cities: The Case of Metro Manila‖. It was attended by 44 participants from from various Local Government Units of the Cities of Quezon, Makati, Marikina, and Mandaluyong; National Government Agencies (Department of Transportation and Communication, Metro Manila Development Authority); Non-government Organizations and corporate foundation (Manila Observatory, CAI-Asia, Gawad Kalinga, PLDT-SMART Foundation); the private sector (Ayala Land Inc., Inc., Ortigas Center Association, Inc. ); development organization (The Rockefeller Foundation); and research and academic institutions (Ateneo de Manila University, UP NCTS, University of Michigan). The list of attendees can be found in Annex 1. 2. The event started with invocation, national anthem, and the welcome remarks given by Prof. Mary Jean Caleda, the Assistant Dean of Ateneo School of Government. 3. Mr. Benjamin de la Peña, the Associate Director for Urban Development of Rockefeller Foundation, gave a presentation about the Foundation, some facts about Metro Manila, and the need for understanding Manila’s urban development. His presentation is attached as Annex 2. The following are some key points of his presentation:  Metro Manila grew in the last 50 years by 1440 ha/year with an average of 180,000 people/year. This is about half the size of Makati in land area each year. There is no agency in the world that could have cope with this kind of growth. This led to problems like informal settlements, slums, and traffic. To cope up with this kind of growth, there is a need to build 100 houses per day –at a no vacations, no weekends and no holidays assumption.  The situation in Metro Manila (e.g. slums, traffic congestion) is not unique to the country and can be found in other major cities/ metropolitan in the world.  The more the city is urbanized, the higher the economic growth. The US is about 80% urbanized, Korea is 92%, and Japan is even more so. The only place in the world that does not have horizontal slums is China because it is intentionally urbanized. These countries see the connection between urbanization and growth. Here in Metro Manila, it is not realized.  Cities share 70% of the global economy and are considered the economic engines of the world. It has a huge share for a very miniscule size of the world’s land area.  Mr. dela Peña shared his favorite quote from Triumph of the City by Ed Glaeser:
  • 4.
    “Cities don’t makepeople poor. Cities attract poor people. They attract poor people because they deliver things that people need most of all — economic opportunity.”  There is a demographic shift happening. The World Bank thought that in order to solve world poverty, people don’t have to go into cities. They come to realize over the last five years that it cannot happen—that people come to cities because of opportunities.  Metro Manila is only 2.1% of the total land area of the country, but it produces 1/3 of the national economy. Every square kilometer in Metro Manila produces more than $ 3 billion dollars per year. Mr. de la Peña presenting the facts about the contribution of cities in  Comparatively, Metro Manila national economy produces about $158,000 per sq. km. per year versus $1,720 for every square kilometer per year in the rural areas.  Poverty incidence of families of NCR (4.8%) is lower than in whole of the country (24.4%). Lower poverty incidence is due to economic opportunities. Starting a business in the city or finding a job is nine times higher than being in the rural areas.  The myths of decongesting Metro Manila and traffic are as follows:  Moving people out of the City (mainly the poor). An example is Balik Probinsya Program in the 1950s.  Create alternative growth centers to relieve pressure.  Need more mass transit to relieve the traffic congestion  There are two ways of solving congestion: (1) traffic congestion pricing and (2) high gas cost  One way to decongest the city is to kill its economy.  The more roads you build, the more people drive.  Mr. de la Peña emphasized that if we want a sustainable and a livable city, it is the pedestrian that needs to be king. All that happens in cities depend on people. The way to make a sustainable and livable city is to make the pedestrians a priority. That’s the indicator species, not the person in the car. 4. Ms. Susan Zielinski, the Managing Director of Sustainable, Mobility and Accessibility Research and Transformation (SMART) Center at the University of Michigan, gave a presentation on the international perspectives on New Mobility. Before Ms. Zielinski started her presentation, she asked everyone to introduce themselves, their affiliation, and tell a positive word that represents ―transportation.‖ Some of the participants’ responses included the following: speed, legroom, potent, space, convenience, movement, choice, service, door-to-door, connectivity, safe, seamless, enforcement, clean air, engineering, people, democratic, integrated, and sustainable.
  • 5.
    She gave apresentation with the theme ―connecting the dots.‖ Her presentation can be found in Annex 3. The highlights of her presentation are as follows:  Urbanizing world is an opportunity to think differently about solutions. We have to think creatively, not only focusing on what’s wrong or what the problems are, but looking at innovations all around the world.  There are new ways of providing services including fractional use (e.g. zipcar), new technologies (iphone applications telling us when trains are coming, integrated fare payment), new kinds of design and infrastructure (bike parking, urban design—transportation as a framework for city building), new modes of transportation (foldable bikes, new types of buses) and cultural shifts.  We should consider not just people’s movements but also goods movements, and the lesson to be learned from the latter. Transportation is not just going from A to B, it is also about making trips shorter or eliminating it (e.g. building a corner store in a neighborhood eliminates longer trips). Transportation is a means not an end. Good movement should be multilevel, door-to- door, IT-enhanced and seamless.  A three-minute video presentation (created by Veolia) was shown to give the participants ideas on new mobility.  Ms. Zielinski emphasized that it is important to identify transportation grid that already exist in the city then look at how it increases connectivity. Connectivity infrastructure rather than roads as infrastructure.  She also discussed the Four-step Approach – convening, mapping, piloting and roll out, and moving minds.  According to Ms. Zielinski, convening identifies great things, so as to bring them together and make them better. It’s beyond usual suspects. It’s not just the city planners and engineers but also the entrepreneurs (e.g. doing iphone apps, people at Cisco doing neat IT, NGOs), and sometimes labor.  Mapping and piloting on the other hand should be able to identify things that make sense and should generate interest, more demands, and public participation of the city’s transportation.  There are many industries involved in the traditional transportation industry as follows: real estate, tourism, logistics, IT and GIS. With New mobility, it further contributes to economic benefits. It saves money, creates jobs, boosts businesses, and revitalizes local economies.  Ms. Zielinski asked the participants to think of a thing in Metro Manila that they are most excited, proud and hopeful for the future. Furthermore, give at least whom they would like to bring to participate in the table. The participants said they are proud of the following:  Train system (MRT) – it may be insufficient but at least Metro Manila already has it.  Transportation rich; excited about transportation issues and possible solutions.  Connections have greatly improved  Alternate routes  Rationalizing public transit  Retaining public transit share  Cooperation among stakeholders  Covered walks and the efforts of various groups to improve it  Current initiative in Commonwealth Avenue for motorcycle lane  People Power  Growing awareness of importance of health
  • 6.
    Hoping for a subway in Metro Manila  Partnerships with NGOs  Existing improvements  People welcome positive changes  People here in the room who came with an open mind and willing to Right photo: Ms. Zielinski listens to the participants while giving their insights on what collaborate with they are excited, proud of and hopeful in the future of transportation in Metro Manila. everyone  Enthusiasm and Left photo: Local Government representatives from City of Marikina and CAI-Asia sharing interest of their thoughts different sectors of the community  Renewed zeal/ desire of young people to be part of city and nation building  Numerous options to live in the places where you work  Organizations promoting paradigm shift from infrastructure building to shifts in mass transit; excited by projects of line 7 and line 9  Streets are already marked  Potential as center for innovation  Capacity to talk about traffic rather than coup d’etats and crime  Talking about mobility and not just transportation/ traffic  People have open minds, not looking at Manila as a dead end Groups and/ or individuals identified by the participants are as follows:  Bus operators (80% of traffic caused by buses, lack of discipline thereof)  Councilors of the different LGUs especially Chairpersons of the Committee on Transportation  People working on urban air quality  Students and those studying more efficient transport systems  Representatives of car users  Mayors of Pasig, Mandaluyong and Quezon City (for the Ortigas Business District)  National government agencies  Motorcycle users  President  Urban planners  Public transport operators  Commuters  Social entrepreneurs  Youth groups  Township developers  Church  People working in transport services sector to better understand the economic situation  Core users, especially those in lower-income tax brackets  Drivers
  • 7.
    Ateneo community (future leaders, entrepreneurs)  Future problem solvers, including young children  Bloggers/media  Young planners hungry for development  Artists who could help visualize what the real identity of Metro Manila should be 5. The following are the highlights of the discussion:  Mr. Danilo Ocampo asked if there is a room for discussions and planning on some manageable innovations and mobility system at the local level.  Mr. de la Peña responded that what happens and what we can do in this table should not be defined by the funders or the proponents. It should be defined by the participants. And in order to effect change, it is important to change minds. With this, what we can do is to shift the framing of the problem. He cited US as an example, that, it is a mistake to count cars instead of people. He emphasized that if we count people and consider it to be at the core, which we forget, we will be thinking about how many people can be moved as fast as possible. 6. Atty. Yves Gonzales, Director of the Traffic Discipline Office of the MMDA, presented about the Metropolitan Manila Transport and Traffic Development and Management Program (Annex 4). The highlights of his presentation are as follows:  The Philippines is about 88 million in population, Metro Manila comprised its 11 million. The classification of the roads is about 44% concrete and about 56% of the national road is in asphalt. The road network composes of five circumferential roads (C-roads) and 10 radial roads.  The vehicle registration in 2010 totaled to 6.6 million. There is an increase in vehicle registration from 2008 and 2010.  As the country progresses, more and more people buy cars and traffic congestion gets worse.  For buses that passes thru EDSA, there a total of 3,700 city buses and 3,088 provincial buses. For non-EDSA there are total of 1,589 city buses and 4,280 provincial buses. These accounted to a total of 5,321 for EDSA and 7,368 for non- EDSA buses.  Based on a study, the actual limit of buses is just about 1,600. There is oversupply of Atty. Yves Gonzales presenting the initiatives of MMDA city buses. In addition, provincial buses also contribute to traffic and congestion.  There are 85 bus stations clustered in the areas of Sampaloc-Manila (29), EDSA-Cubao (26), EDSA-Pasay (19), Buendia-Pasay (7) and Monumento (4). Currently, there are 1,719 franchise holders for a total of 48,514 units.  We also have the rail system, MRT, LRT 1 and 2, and PNR. The expansions MRT 7, MRT 4 are also part of the expansion plans. The LRT 1 has 111 trains, the LRT 2 has 13 train sets, and MRT 3, the most popular has 73, and the Philippine National Railways has 18 trains.
  • 8.
    There is also the Pasig River Ferry System. However, its operation is currently suspended. The DOTC has plans to bring it back and strengthen because it is one of the alternative means to get around Metro Manila.  There are a total of 76,938 of traffic-related accidents from January to December 2010 in Metro Manila. 380 are fatal accidents, 14,853 non-fatal accidents, and 61,705 damage to property. While from January to May 2011, we have 168 fatal accidents, 6,321 non-fatal injuries, 22,962 damaged properties, and a total of 29,446 accidents.  The number of accidents along Commonwealth Avenue has been reduced by 23% as compared to 2010.  The Issues and Challenges are:  Obstructions and illegal structures along the carriageways  Outmoded traffic signal system  Poor road condition  Inadequate public transport  Vehicular and pedestrian accidents  Low or weak enforcement of transport and traffic related-laws/regulations; and  Lack of discipline and poor road behavior  Metro Manila’s vision is to be a world-class, vibrant, safe and healthy metropolis. We are not yet there but we are getting there.  The MMDA has proposed/implemented the following flagship programs:  The establishment of the Mega Manila North and South Provincial Bus Axis System or PIBAS. The goal: to decongest EDSA from buses.  The development of the Airport Tram System aims to inter-connect all the three (3) international airport terminals.  The installation of an Intelligent Transport System. It consists of two parts: (1) to improve Metro Manila’s traffic signaling system—improving traffic lights, changing LEDs and installing counters which shows the number of seconds for the red time, yellow time and green time, (2) to increase monitoring and surveillance abilities by installing of additional cameras; the more parts of the road that we can monitor, the better services we can provide for the people.  Installation of road signs and markings following international standards.  Construction of rotondas to improve the traffic flow.  Landscaping and beautification of the road.  Installation of strategic traffic safety and traffic flow enhancement facilities.  Improving illumination of roads.  Transport and traffic entry summit and stakeholder’s consultation meeting.  Construction of pedestrian footbridges. Currently there are 66 footbridges serving a total of 2.3 million pedestrians a day. It is equivalent to 2.3 million pedestrians that are not on the road.  Deployment of lady traffic enforcers to areas with severe traffic problems. Motorists tend to be more compliant and try to obey traffic laws when lady traffic enforcer is around.  Expansion of Unified Vehicular Volume Reduction Program (UVVRP). Number coding system.  Introduction of Christmas lanes, also known as Mabuhay Lanes. These are alternate routes that the motorists can traverse, instead of the major roads. The MMDA deploy enforcers to ensure that these routes remain free flowing.  Employment of female bus drivers. MMDA believed that female bus drivers are more caring and less aggressive in driving PUVs.
  • 9.
    Setting speed limit of 60 kph and introduction of motorcycle lanes along Commonwealth and Macapagal Avenues.  Vehicle tagging scheme that aims to tag all vehicles to allow identification of vehicles (e.g. during accidents, etc.) via CCTV. It is also important for the identification of vehicles and out-in-line vehicles. There is no cost to government because the vehicles are tag voluntarily by operators.  Establishment of MMDA twitter account that replaced MMDA radio/TV operations. It is much cheaper and currently has 144,000 followers. It is simple, it is cheap and efficient.  Metro Manila Traffic Navigator aims to provide traffic information in line with major thoroughfares—EDSA, C-5, SLEX, NLEX, Roxas Boulevard, Quezon Avenue, España, Commonwealth, Ortigas, and Marcos Highway.  Creation of MMDA iOS mobile application. 7. The highlights of comments, questions, and recommendations for the presentation given by Atty. Gonzales are as follows:  Mr. Ocampo asked if the MMDA thought about replicating the MRT system to a situation of buses and jeepneys.  Atty. Gonzales responded that improving public transportation is one of the solutions to solve traffic problems. Establishing Bus Rapid Transit may take time because of political challenges. It is also cheaper but will require new capital for buses. The improvement of public transportation is not exactly a mandate of MMDA but of DOTC. The MMDA is working with DOTC, LTO, and LTFRB to come up with solutions to improve our level of transportation. BRT system is one of Mr. Danny Ocampo asking Atty. Gonzales, if MMDA has thought about them. Next year, Chairman Tolentino replicating MRT system to bus and jeepneys. is planning to introduce a project regarding the loading and unloading. Again, this is one of the problems in traffic situation because people just load and unload everywhere.  Ms. Jessica Bercilla cited that wherever there is increase in mobility, there are new social hubs that evolve. Where there are new evolving social hubs, the more vulnerable sectors and the urban poor sectors, are very quick at finding opportunities. In relation to this, she asked if MMDA, in all the innovations implemented, has thought about addressing the issues of the urban poor who use and benefit in the evolving mobility that we have in Metro Manila.  Atty. Gonzales said that MMDA is concentrating on it mandates to provide better transportation management services in Metro Manila. The result of will be reaching down to the poor and the vulnerable. However, MMDA don’t have that project right now that is why we are talking with the ASoG to have an initial meeting on how these people - the poor and the vulnerable - will benefit from agencies transportation project especially in Metro Manila.  Mr. de la Peña, asked the participants to name one city in the world, a vibrant city that has no traffic. He cited that even Singapore has traffic. The goal of traffic-less city is probably impossible. He also gave New York, Tokyo and Hong Kong as examples of cities that have the best transport systems in the world. Even these cities have traffic. He congratulate MMDA with
  • 10.
    its initiatives andwith the Traffic Navigator, it shows how we can achieve our objectives in the future.  On the Traffic Navigator, Atty. Gonzales said that their vision is to cover everywhere. It is built in a modular way so that more roads can be added fairly.  Mayor Herbert Bautista on the other hand asked the group on what is the basis of planning, is it transportation or land use? Moreover, what are the regulations regarding the use of ten- year old cars?  Dr. Antonio La Viña emphasized that the whole point of the Search is to try to answer the questions that the stakeholders have. He is also optimistic that the group can do a lot of things on transportation that is good for the environment, for progress, for development, and for energy. Dr. La Viña also emphasized one of the reasons we invited the local government officials (e.g. Quezon City) is for the team to move forward on this initiative and be able to locating these issues in specific places.  Mr. de la Peña responded to the query raised by Mayor Baustista. He said that transportations are city shapers. In understanding levels of development (e.g. in Quezon City), it is important to consider the following questions: How many cars will have to pass Above photo: Ms. Jessica Bercilla asking Atty. Angeles if MMDA (given before thinking about expanding the their innovations) thought of addressing the issue of urban poor who use road? But what if, we count people and benefit in the evolving mobility that we have in Metro Manila. instead of cars? Then how many people will be coming through here then how Below photo: Dr. La Viña explaining the objective of the Search. do we carry that people? Is the most efficient, cars? Is the plan based on transportation or land use, would you be doing plan based on people? Where will people go? How will they move? How many of them can we move? Where do we get down and get off? How do we make it more convenient for them?  On the query of Mayor Bautista about the regulation on cars, Ms. Corazon Japson (Supervising Transportation Development Officer, DOTC) mentioned that there is a DOTC regulation that limits the age of public utility vehicles to 10 years. The agency will not give franchise if they exceed to 10 years. It is not that strict for private cars, so long as the vehicle passes the requirements for motor-vehicles registration and NBI safety road forms. 8. The morning session ended with a photo shoot of all the meeting participants. The presentation about the project and its research components were moved in the afternoon.
  • 11.
    The participants ofthe Inception Meeting from LGUs, national government agencies, private sector, academe, non-government organizations and development partners. 9. In the afternoon session, Dr. Segundo Romero (iBoP Asia Program Director), gave a presentation entitled, ―Background and Overview of the Project on Catalyzing New Mobility in Cities: the Case of Metro Manila.‖ The presentation is attached as Annex 5. The highlights of his presentation are as follows:  Government agencies are repositories of a lot of information that are not shared.  The Metro Manila Action Plan should be able to contain provisions on safety, mobility, productivity, and civility. For inclusiveness, it is to design the public transport system for the pedestrians, the bicyclists, the commuters, the long trippers.  Design safety for the pedestrians.  For mobility, we should also look how it affects the productivity for the rich and poor.  Dr. Romero raised the following questions that the project wanted to answer for this Search:  Is it possible to design civility into interactions on the road?  If the streets show the attitude and our citizenship, how do we focus on cooperative and interactions? Dr. Romero presenting the background and overview of the project  Where are the informal transport hubs? What are their attributes?  Where are the formal transport networks?  How to combine different modes of travel?  How Metro Manila combine these services, etc?
  • 12.
    What basically designs to ride a jeep rather than a bus?  Economics and mobility.  Social enterprise opportunities  Focus on governance not government  Connect ―islands‖ of transportation systems. The SMART primer highlights transportation as a system of systems, connecting nodes, services, etc. Thus the concept of transportation also includes behavioral mobility changes and innovations from various stakeholders.  In the end, we want to increase the accessibility in Metro Manila. The output that we are promising is a sustained multi-stakeholder discourse on new mobility—a series of discourses on mobility beyond the project line. We are going to feed it with workshops and fora, research, communication and information activities that enriches knowledge sharing.  In the next 12 months, the project will do the following:  Stakeholder workshops  Mapping and research - both visible and invisible public transport system. The team wanted to map behavioral patterns and understand the impacts/ costs of public transportation, particularly on the poor and vulnerable, and identify existing and emerging entrepreneurial activities in the transport sector.  Profile raising activities 10. Mr. Lorenzo Cordova, Jr., Research Associate of iBoP Asia Program, presented the Mapping of Public Transport Networks in Metro Manila (Annex 6) in behalf of Dr. Jun Castro. The highlights of his presentation are as follows:  Database is very effective in planning if it is reliable and updated. If it is updated, it should be relevant as well.  In building database, it is important to answer the following:  What is the purpose of the data?  Who needs the data?  Should it be able to be implemented on various platforms?  What are the platforms available for the users?  GIS-based maps and database can be overlaid with several layers to come up with guidance in an effective decision making. Results and analyses will be useful in policy making, management, guide in planning your system, traffic information in your GIS.  The study will select four to fiv areas in EDSA (e.g. from MRT stations), and will cover the 500 meter radius from the area identified.  The One-year time frame limits the study.  For the road network and capacities, we have MMDA and DPWH as sources of data—vehicle types and volumes, public transport services, pedestrian improvements, and traffic management. He emphasized that LGU have critical roles as well.  Mr. Cordova raised some questions to the participants to sought guidance from the participants to improve the study. These are:  What is the purpose of mapping?  What are we trying to connect for this invention? What are we trying to achieve? What are we looking at?  Who are the people who will use this data or these GIS maps?  What needs to be added given the existing information that we have?  How do GIS maps help define or determine the socio-economic and new mobility programs to be implemented by the LGUs, as well as the policies?
  • 13.
    11. The summaryof key questions, comments, and recommendations for the mapping component of the Search are as follows:  Dr. Regidor gave recommendations to ask the following considering the perspectives of using maps as follows: 1) What were the objectives of the maps based on the maps presented by the MMDA? 2) Depending on the objectives, we have to define what level of detail we want in these maps; 3) What type of information exactly do we want to put in these maps? Then we can define what type of data we will be putting in the layers of the maps (e.g. travel speed, volume). 4) Do we need to determine densities, Dr. Regidor of UP NCTS sharing his insights for the mapping vehicle mixes? component of the Search  For the informal hubs, the connectivity will be identified. It’s one of the basic objectives--to see how the urban poor commute.  If the study will only look at three MRT stations along EDSA and we want to focus on inclusion, why not map an urban poor community and find out how they are traveling and to where? These stations are just exchange points.  Importance of language and legibility in creating maps  ―New mobility map‖  Understand connection points  Maps should give opportunity for both users and for the entrepreneurs who want to fill up the system and identify gaps  Define the purpose of the map and the mapping exercise.  If maps should promote dialogue, then what kind of design will support conversations? 12. Mr. Randolph Carreon, Transportation Economist, presented Impact and Cost of Public Transport on the Poor and Vulnerable (Annex 7). The highlights of his presentation are as follows:  The poor comprised considerable part of the population of the Metro Manila. The cost of transportation, especially public transport, has been increasing over the past years. The increasing costs are felt especially from those belonging in the low-income bracket.  The vulnerable groups include persons with disability, senior citizens, women and children. These sectors have specific transport needs however received less attention in the previous years and studies. Public transport is a vital part of the transportation system in Metro Manila.  The objective is to understand the nature of the transportation needs, accessibility, mobility, and cost of the poor and the vulnerable groups.
  • 14.
    The study aims to establish the travel demand of the poor and the vulnerable groups. Specifically, how these people move from their house, from their work, school. Moreover, to look qualitatively at the efficiency of the transport system compared to the needs of the poor and the vulnerable groups.  The study will also estimate the cost of transportation of the poor, estimate the actual and the desired cost of transport of those within the vulnerable groups and examine other quantifiable cost incurred by these groups.  The ―poor‖ will be defined as those living within the colonies of the informal settlers. Typically we define poor in terms of income, relatively those in the poverty line but for the purpose of this study, we would assume that once you live in the colony of informal settler, you could be considered poor.  The ―vulnerable groups‖ will include PWDs, senior citizens, and women and children. Additional category consists of those working in BPOs will be covered because this is a new and emerging industry. Mr. Randolph Carreon presenting the study on  The study will use primary and secondary data covering Impact and Cost of Public Transport on the Poor all the LGUs in Metro Manila. The primary data will be and Vulnerable gathered from selected areas, while secondary data will be gathered, hopefully, from all the LGUs in Metro Manila. Then, we can expand the primary data gathering.  We plan to conduct household interview surveys to determine travel demand patterns and transport cost. Currently we are considering the colonies of Bgy. Old Balara, Agham Road, and along EDSA extension. We are hoping to have a sampling rate of approximately 2.5% per area.  The study will conduct individual interviews among PWDs, senior citizens, women and children, and BPO workers. The interviews will be conducted in public places such as terminals at mall stations, in short, where we can find them, we will interview them.  The target number of samples is 2,000 respondents from all the vulnerable groups.  The study will utilize other methods:  Key-informant interviews  Focus group discussions  Since we have selected study areas, we will try to get some specific case studies, for example, a typical family within the informal settler colony. We will try to document how they move out to go to school, how they get their income, and what are the costs. For each of the vulnerable group, we will get one specific case study.  By end of January, we will have the initial findings after we do the initial running of the results. And on March, we will be able to finalize the report. 13. The summary of key questions, comments, and recommendations for the Impact and Cost of Public Transport on the Poor and Vulnerable component of the Search are as follows:  Stratify the approach. Are we talking only of informal settlers with no land title or no tenure and some informal settlers with tenure already, whether those are awarded lots? The areas chosen are mixed since the focus is along EDSA.
  • 15.
    Areas far from EDSA are still under consideration to get the feeder of the movement (e.g. people in EDSA that are walking towards to and from the MRT; the tricycle and pedicab movements are not recorded).  Consider including the community that was relocated to see what is the impact on their transportation.  Mayor Bautista cited the example of the QC government’s idea of donating about five jeepneys (creating transport cooperative) so the people can build and eventually own. The Matandang Balara is okay for the study, it is far from EDSA, however, most of them are dense and many of the residents are working outside Quezon City. He also expressed to support the project and will be very much willing to volunteer Quezon City as one of the study areas.  If the research looks at the cost of public transit and how it causes traffic, there is a tendency to deal with it instead of the cars  Is there a ―language‖ that can say something on public transit opportunities, and impacts of motorized transportation on the poor/vulnerable? It might be a semantic thing but at first glance, it may look like that transit is seen as bad.  Up to what degree of specificity and usefulness you can devise the study such that the information Mayor Herbert Bautista of Quezon City shares his insights and expressing would be useful to prospective his support to the project. social entrepreneurs who can devise very specific focus in transport systems that will make sense to those poor and vulnerable sectors? (e.g. people with disabilities, one way of looking at it is, what is the actual mode of transport they are using now?)  Need focus on specific communities and see how dynamically they do their transport  We are trying to look at transport data and impact. We are also looking at socio- entrepreneurship data. If we have to do them in the same communities and in same locations, there is no way we will be able to inter-relate that data and integrate theoretical ferment that might be useful to our people. Is it possible to look at specific communities where we can do all these studies but in an integrated manner?  Ideographic case studies are good.  Why don’t we try to locate the senior citizens, the PWDs, and the others from this community? You may not have all of them but when you look at them together from Metro Manila, you will have enough conclusions. 14. Ms. Tieza Santos, Associate Director of Ateneo Center for Social Entrepreneurship, presented Entrepreneurial and Livelihood Opportunities in the Transport Sector (Annex 8). The highlights of her presentation are as follows:  Social entrepreneurship – innovative way of doing things in order to provide a pervasive social solution.
  • 16.
    For this component of the project, we would like to look at the enterprise landscape and potentials of the transport and new mobility sector.  Research Overview (preliminary ideas): Goals and Objectives:  Identify existing transportation related social enterprises or mobility innovations in the Philippines and including other countries.  Generate ideas and business models on new mobility and transport-related social enterprises with high potential to benefit particularly the poor and the vulnerable.  Identify market barriers and aiders for the development of mobility innovations. - We look at the economics, the Ms. Tieza Santos presenting the proposed study in consumers, and the market. We enterprise landscape and potentials in the transport sector consider the social aspect and elements governing these dynamics. And finally the cultural patterns and behaviors. Scope and Limitation:  Focus on commercial enterprise component of the transport and new mobility sector. - We consider the things that are more efficient that provide less cost, safe, convenient, poor and vulnerable-friendly transport systems.  The research activities will involve the following: - Interviews with proponents, managers, customers of existing mobility enterprises and projects - Focused group discussions and/or crowd sourcing  Geographic coverage on Metro Manila Preliminary Research Directions:  The social and economic dimension of the transport sector - To look at the social context and cultural mobility in Metro Manila - To survey the development and evolution of the transport and mobility in Metro Manila - To look at historical changes, economic drivers in national - To look at the sociological perspective and behavior patterns of transports and new mobility market Main Goal:  To understand the minds of the people and how goods and services are delivered.  Moreover, try to answer the following: How policy makers and government officials envision the way the city was built, the way they develop our transport system; how commercial areas sprung in transport hubs?; How they think and re-think the way they
  • 17.
    construct Metro Manilaand our cities?; What do we make out of our cities?; and why has Metro Manila evolved into what it is today?  Using the new mobility paradigm, we have two considerations: - What were the elements that influence the way you projected and built our city? - As Metro Manila reaches a point in terms of population and increasing demands for goods and services, did we consider the idea of how the city is built that is central to human progress?  Going back to the roots: the transport sector as an enterprise  For politicians and planners, we look at transportation as service provider but for operators, drivers, it is not just service but an enterprise—it is a livelihood for them  The content of Search will also include the following:  Historical overview of the urban transport development in Metro Manila and how it emerged. - How these transport shaped our city today?  Market overview –the supply and demand analysis, the barriers and enablers that resulted to privatizations, colorums, TODA.  The development and emergence of transport enterprise in Metro Manila - What are the factors that drove the formal and informal enterprise surrounding the major transportation hubs in the country? - How we would be able to provide new mobility and come up with alternative enterprises for the formal and informal sectors that would be able to increase/address the challenge of new mobility?  Survey emerging enterprise and innovations in the new mobility paradigm. - Look at people and services - What are the new models that cater to people mobility, the transfer of services, the barriers and enablers, the systems and structural developments that are currently emerging?  The future direction - The projections of sustainable business models for new mobility and social enterprises in the Philippines. - What can be replicable locally? - What would be the role of social enterprises or social entrepreneurs in addressing the new mobility challenges with particular consideration for the poor and the vulnerable and other dimensions such as safety, convenience, health, efficiency, environment, and the cost? How will the challenges shape the mobility of the people, goods and services in Metro Manila  Some examples in the transport and mobility sector: - Mobius motors in Africa – low cost and high quality motors - Bikeshare - Suica pasmo in Japan  What if we do something like that in Metro Manila instead of carrying three pass cards? - Philippines: RoRo, Bayad Center  Key considerations:  Efficiency cost, environment, convenience, safety  What are the enterprises, commercial/social and even public, that can be introduced and implemented to address these concerns?
  • 18.
    What are the proximate demands and supply for new mobility mechanism, specifically, the characteristics of the demand segment or the consumer profile in terms of segmentation that make up for the demand of new transport enterprises and new mobility mechanisms, infrastructures and systems that support the various needs of mobility consumers?  What could be the features of new mobility system that would be convenient and helpful to consumers?  What would be the incentives and principles that will govern or encourage the emergence of new models to facilitate new mobility of goods, people and services?  We will be doing research designs and content, finalize survey questionnaires, dry run of the survey, preliminary market study and analysis, key sectoral/institutional representatives, FGDs, research data processing. 15. The summary of key questions, comments, and recommendations for are as follows:  Possible to include research on regulatory aspect of public transport?  Interested also in jeepney model, and have discussion with DOT officials.  When people have just little money, renting a jeepney becomes an attractive investment. 16. Dr. Danielle Guillen presented the proposed activities of the Search (Annex 9). The highlights of her presentation are as follows:  Launch/mapping in January 2012  Launching in partnership with MMDA  Mapping exercise – connecting the dots. Will involve MMDA and 17 LGUs and public sectors (e.g. Department of Transportation), media (e.g. print, radio, TV), and private sectors (e.g. shopping malls, private developers, IT and telecom), NGOs, academe, planners and other groups, International Organizations Dr. Danielle Guillen presenting the proposed activities of the New  Launching of Crowd Sourcing Activity Mobility in Cities Project  Crowd sourcing - like an innovation award for best practice. It is a distributed problem solving and production model. It is a participatory process. It will be in a partnership with the academe, or some NGO groups going to these communities for them to think of a social enterprise.  Social enterprises are businesses in the market to fulfill social aims, bringing together people and communities together for economic development and social gain.  We want to create an innovation award in best practice and/or idea for social enterprise in the transport sector. - Planning : November-December 2011
  • 19.
    - Launching : January 2012 - Call for Nominations : February – March 2012 - Presentation at Rio Summit: May 2012  Characteristics: - Enterprise-oriented involvement - Explicit social aims (e.g. job creation, training, provision of local services) - Social ownership (autonomous organizations with governance and ownership based on participation by stakeholder groups or trustees)  The project team will create a website to encourage interaction among stakeholders and as a resource facility to allow people to get what they need.  Highlighted that the project is owned by all the stakeholders, not just by ASoG-iBoP Asia or Rockefeller Foundation. 17. Dr. La Viña gave the synthesis and ways forward. He emphasized that these issues are solvable and requires a vision even though it may take time and focus. That this is not only the project of ASoG. The team wanted to engage with all stakeholders as we move along. There are interesting initiatives going on in the public and private sector. Moreover, the levels of interest to solve the issues we are dealing with in terms of transportation are very high. We want to keep moving this forward and faster. Dr. La Viña emphasized that in a city like Metro Manila, he believes in ―mosaic‖ version of change, do changes where possible then connect the dots. This project is only a starting point of work that has to be done. Dr. La Viña thanked everyone for coming. 18. For the Closing Remarks, Atty. Alu Dorotan read the message from Chairman Francis Tolentino of MMDA. He congratulated the organizers –the Ateneo School of Government. He also commended the Rockefeller Foundation for supporting new learning and delivering services for the Filipino and conveys his appreciation for making Metro Manila the subject of study and for giving MMDA the chance to participate in this worthwhile undertaking. Above photo: Dr. La Viña giving synthesis and ways forward Chairman Tolentino expressed that this is very Below photo: Atty. Dorotan of MMDA reading the message important project especially for MMDA since Metro from Chairman Francis Tolentino Manila is facing lots of challenges. With the increasing rate of urban development, many factors affect the delivery of services particularly in the area of transport. This study will provide new lessons in looking at transportation beyond infrastructure with the inclusion of the poor and the vulnerable. It will provide a human face, which is a very important factor in transport management. 19. The Inception Meeting ended at around 3:00 in the afternoon.
  • 20.
    ANNEX 1 List ofPersons and Organizations Consulted
  • 21.
    CATALYZING NEW MOBILITYIN CITIES: The Case of Metro Manila Inception Meeting 27 October 2011 | Topaz 2 Gateway Suites, 4th Floor Gateway Mall, Araneta Center, Cubao, Quezon City Email Address/ Name Designation Organization Contact Information Asinas, Rodney PDO Makati City Hall rdneyasns@gmail.com Bathan-Baterina, Glynda Tpolicy & Partnership Manager CAI-Asia Glynda.bathan@cai-asia.org Bautista, Herbert Mayor Quezon City mhmbqc@yahoo.com Bercilla, Jessica Consultant Ateneo School of Government jbercilla@gmail.com Buencamino, Victor Gen. Manager Ortigas Center Association +63 2 631 7212 Caleda, Mary Jean Assistant Dean Ateneo School of Government mj.caleda@gmail.com Camarillo, Ernesto Transport Consultant Makati LGU ernlcam@yahoo.com Carreon, Randolph Transportation Economist randolphcarreon@gmail.com Comandao, Armando, City Planning and Development Mandaluyong LGU armandocomandao@yahoo.com Officer Cordova, Lorenzo Jr. Ateneo School of Government lorenzojr.cordova@gmail.com de la Peña, Benjamin Associate Director Urban Development, The randolphcarreon@gmail.com Rockefeller Foundation Diaz, Jennifer Chief, Engineering TOD Quezon City Government BdelaPena@rockfound.org Duran, Anna Field Coordinator OCM Office of the City Mayor Faulan, Ma. Josefina Director MMDA-OAGMP mdps_mmda@yahoo.com Gison, Michael PO V MMDA +63 2 882-4151 to 77 loc. 280
  • 22.
    Gonzalez, Yves Director III & OIC TDO MMDA zz@mmda.gov.ph Gotangco, Kendra Program Manager, Klima Climate Manila Observatory manila@observatory.ph Center Guillaume, Marion Intern iBoP Asia, ASoG Marion.guillaume@gmail.com Guillen, Marie Danielle Program Manager iBoP Asia-New Mobility Project danielle.guillen@gmail.com> Ibrahim, Amira Associate The Rockefeller Foundation AIbrahim@rockfound.org Japson, Ma. Corazon Supervising Transportation DOTC corajap@yahoo.com Development Officer La Viña, Antonio Dean Ateneo School of Government tonylavs@gmail.com Laluna, Christian Ateneo School of Government allycrislna@yahoo.com Lopez, Eriq Chief Staff Quezon City Government Marcaida, Jaime City Transport & Development Marikina Office Marin, Michael City Transport & Development Marikina Michael_om020380@yahoo.com Office Martinez, Al Ateneo School of Government Medalla, Aly Councilor Quezon City alymedalla@yahoo.com Nilo-Fulo, Marien Project Officer Ateneo School of Government Marien_nilo@yahoo.com Ocampo, Danny Director Ateneo Center for Social Ocampo_d@yahoo.com Entrepreneurship Palarca, Coryell Legislative Staff Quezon City Council Coryell_palarca@yahoo.com Quesada, Noi Director GK Ateneo noiquesada@yahoo.com Rabe, Corazon Office Assistant ASoG csrabe@ateneo.edu Regidor, Jose Regin Director UP NCTS Up.ncts@gmail.com Romero, Segundo Program Director iBoP Asia Program doyromero@yahoo.com
  • 23.
    Sanchez, Mario Asst. Head Quezon City Government Santos, Esther President PLDT-Smart santosesther@gmail.com Santos, Mary Grace Program Manager iBoP Asia-UNIID Project mgpalaciosantos@yahoo.com Santos, Tieza Asst. Director Ateneo Center for Social tiezasantos@yahoo.com Entrepreneurship Tan, Salvador Sr. Div. Mgr. Ayala Land, Inc. tan.buddy@ayalaland.com.ph Ubaldo, Virgilio TFB Quezon City Hall virgilioubaldo@rocketmail.com Victorino, Punie OCM Quezon City Zielinski, Susan Managing Director SMART Centre, University of susanz@umich.edu Michigan Aliliran, Karen Documenter Ateneo School of Government
  • 24.
    ANNEX 2 The Rockefeller Foundation and the Catalyzing New Mobility in Cities Search
  • 25.
    11/29/2011 Catalyzing the NewMobility in Cities Search 1
  • 26.
  • 27.
    11/29/2011 How fast didMetro Manila grow? 1,440 hectares 180,000 people every year since 1948 =1/2 Makati in land area, each year Bangkok 3
  • 28.
  • 29.
    11/29/2011 by Sachin SureshJadhav by mylerdude 5
  • 30.
    11/29/2011 The World’s Megacities 1. Tokyo-Yokohama, Japan - 33,200,000 1. Tokyo, Japan - 34,100,000 2. New York, United States - 17,800,000 2. Mexico City, Mexico - 22,650,000 3. Sao Paulo, Brazil - 17,700,000 3. Seoul, South Korea - 22,250,000 4. Seoul-Incheon, South Korea - 17,500,000 4. New York, United States - 21,850,000 5. Mexico City, Mexico - 17,400,000 5. Sao Paulo, Brazil - 20,200,000 6. Osaka-Kobe-Kyoto, Japan - 16,425,000 6. Mumbai, India - 19,700,000 7. Manila, Philippines - 14,750,000 7. Delhi, India - 19,500,000 8. Mumbai, India (formerly Bombay) - 14,350,000 8. Los Angeles, United States - 17,950,000 9. Jakarta, Indonesia - 14,250,000 9. Shanghai, China - 17,900,000 10. Lagos, Nigeria - 13,400,000 10. Jakarta, Indonesia - 17,150,000 11. Kolkata, India (formerly Calcutta) - 12,700,000 11. Osaka, Japan - 16,800,000 12. Delhi, India - 12,300,000 12. Kolkata, India - 15,550,000 13. Cairo, Egypt - 12,200,000 13. Cairo, Egypt - 15,450,000 14. Los Angeles, United States - 11,789,000 14. Manila, Philippines - 14,850,000 15. Buenos Aires, Argentina - 11,200,000 15. Karachi, Pakistan - 14,100,000 16. Rio de Janeiro, Brazil - 10,800,000 16. Moscow, Russia - 13,750,000 17. Moscow, Russia - 10,500,000 17. Buenos Aires, Argentina - 13,400,000 18. Shanghai, China - 10,000,000 18. Dhaka, Bangladesh - 13,100,000 19. Karachi, Pakistan - 9,800,000 19. Rio de Janeiro, Brazil - 12,100,000 20. Paris, France – 9,645,000 20. Beijing, China - 11,950,000 Source: Demographia. Source: Th. Brinkhoff: The Principal Agglomerations of the World 6
  • 31.
  • 32.
    11/29/2011 Caracas by Sachin Suresh Jadhav 8
  • 33.
    11/29/2011 Mumbai by Sachin Suresh Jadhav by mylerdude 9
  • 34.
    11/29/2011 Mexico City by mylerdude 10
  • 35.
    11/29/2011 Bogota This is a good thing Urbanization and growth go together: no country has ever reached middle income status without a significant population shift into cities. Urbanization is necessary to sustain (though not necessarily drive) growth in developing countries, and it yields other benefits as well. But it is not painless or always welcomed by policymakers or the general public. Urbanization and Growth World Bank Growth Commission 2009 11
  • 36.
    11/29/2011 70% Cities’ share of the global economy 12
  • 37.
    11/29/2011 “Cities don’t makepeople poor. Cities attract poor people. They attract poor people because they deliver things that people need most of all — economic opportunity.” Triumph of the City, Ed Glaeser London mid 1800s 13
  • 38.
    11/29/2011 London and Cholerain the 19th Century 23,000 deaths 1831-1832 53,000 deaths 1848-1849 14
  • 39.
    11/29/2011 New York late1800s New York late 1800s 15
  • 40.
    11/29/2011 Meanwhileback in our Mega City… 2.1% of total land area of the country 30% of the national economy PhP1,933.04 billion GRDP (2005) Every square kilometer in Metro Manila produced more than $3B/year in 2005 16
  • 41.
    11/29/2011 US$ 158,000 sq.km/year $1,720 sq.km/year Poverty incidence % of families National 24.4% NCR 4.8% NSCB 2003 17
  • 42.
    11/29/2011 If Metro Manilais the engine of economic opportunity… Insanity is doing the same thing over and over again and expecting different results. Albert Einstein 18
  • 43.
    11/29/2011 Myths of decongestion “Let’s move people out of the city.” (mainly the poor) What does a “decongesting” city look like? 19
  • 44.
  • 45.
    11/29/2011 Myths of decongestion “Let’s create alternative growth centers to relieve the pressure on Metro Manila.” -ß R=αS The problem of Zipf’s Law Rank-Size Distribution for Cities 21
  • 46.
    11/29/2011 Myths of decongestion “We need more roads to to relieve traffic congestion.” 22
  • 47.
    11/29/2011 Myths of decongestion “We need more mass transit to relieve traffic congestion.” Source: colorfulrag 23
  • 48.
    11/29/2011 For every complexproblem, there is a solution that is clear, simple, and wrong. H.L. Mencken 67,000 jeepneys 10,754 buses 61,173 tricycles 1.47 million private vehicles 24
  • 49.
    11/29/2011 If gas wasseverely restricted to 5% of the existing supply would you allocate it to public or private transport? 25
  • 50.
    11/29/2011 Metro Manila Land Use distribution 44.83% residential 12.22% commercial 7.62% industrial 6.90% institutional 28.43% open spaces, parks and roads Reasons to be optimistic 26
  • 51.
    11/29/2011 Citiesare 100 year projects 100 years – Burnham’s plan for Chicago 50 years to clean up the Thames 30 years to make Copenhagen the biking capital of the world The pedestrian is the indicator species for livable and sustainable communities. Harriet Tregoning Chief Planner, Washington D.C. 27
  • 52.
    11/29/2011 Thank you verymuch @benjiedlp bdelapena@rockfound.org 28
  • 53.
    ANNEX 3 Connecting the Dots and International Perspectives in New Mobility
  • 54.
    11/29/2011 CONNECTING THE DOTS (getting underway: revealing the New Mobility Grid and spurring innovation, economic vitality, and livability for Metro Manila) Susan Zielinski, SMART, University of Michigan. October 27, 2011, Manila Philippines DRIVERS 1
  • 55.
    11/29/2011 ZIPCAR: Wheels WhenYou Need Them services FRACTIONAL USE: AUTO RICKSHAWS, TAXIS & COMMUNAL CABS, INTERMEDIATE VEHICLES, CARSHARE, BIKE SHARE, SOCIAL NETWORKING, SLUGGING 2
  • 56.
    11/29/2011 new technology wayfinding; shared use; fare payment; traffic management; security etc. Design & new infrastructure 3
  • 57.
    11/29/2011 New modes /modal enhancements 4
  • 58.
  • 59.
    11/29/2011 VEOLIA Video CONNECTIVITY/OPTIMIZATIO CONNECTIVITY / OPTIMIZATION N (both energy & time) • spatial * • spatial / physical • service (use vs. own) • technological (wayfind; fare pay; traffic manage; security) • economic (revitalize; save $; create jobs; boost business) • institutional & policy (public private innovation) • cultural / psychological (moving minds) 6
  • 60.
    11/29/2011 LIVING LABS: Bangalore Cape Town Chennai Cochin DetroitRegion Los Angeles Manila Mexico City Mystic Pasadena Portland Seattle Shanghai Washington DC Lisbon / Coimbra / Porto Etc… Connecting the Dots; Moving Money; Moving Minds RESEARCH, EDUCATION, TECH TRANSFER: ACCELERATE IMPLEMENTATION LIVING LABS: Bangalore Cape Town Chennai Cochin Detroit Region Los Angeles Manila Mexico City Mystic Pasadena Portland Seattle Shanghai Washington DC Lisbon / Coimbra / Porto Etc… Connecting the Dots; Moving Money; Moving Minds RESEARCH, EDUCATION, TECH TRANSFER: ACCELERATE IMPLEMENTATION 7
  • 61.
    11/29/2011 PARTNERS & SPONSORS: National Science Foundation Center for South Asian Studies Transportation Research Board Rockefeller Foundation Mott Foundation FIA Foundation Alcoa Foundation Ford Motor (redefining) US Environmental Protection Agency Cisco Systems IBM Federal Highway Administration U.S. Department of Education CEO’s for Cities City Connect Chennai Confederation of Indian Industry etc… GAME CHANGE 4.0: SEAMLESSLY CONNECTED OPTIONS LEAPFROG: Straight to Next Generation Whole Systems Design & Build - spatial connectivity supported by New Technologies and PPI NEW MOBILITY GRID: More Choices, More Connected The Next Infrastructure; The Next Industry Cluster 8
  • 62.
    11/29/2011 Transportation Meetings 0:00 1:40 1:50 2:00 Agenda: WHAT IS NOT WORKING Solutions Laundry List Quick attempts at prioritization Adjourn Attendees: Usual Suspects A heart? A lung? Pituitary gland? Your choice What is better? What is the silver bullet? I only use my heart I’m too rich and powerful to use my capillaries 9
  • 63.
    11/29/2011 ROLLING OUT THE GRID: 4 STEPS 1. CONVENING – The Crucial & Often Under-Rated First Step (not just the usual suspects – public private innovation 2. MAPPING – An Engaging and Tangible Catalyst for Action 3. PILOTING & ROLL-OUT – Start with Hologram for Wider Spread Roll-Out 4. MOVING MINDS – Speak a new language (Rumi, Philip K. Dick) 5. NETWORK (SMART network – “twinning” for shared genius) CONVENING 10
  • 64.
    11/29/2011 MAPPING and PILOTING Washington, DC Ann Arbor, Michigan CHENNAI: Linking design, value capture, cycles, auto rickshaws, pedestrians, local business & new technologies (e.g. Mapunity, Cisco, Ashok, thru CII) 11
  • 65.
    11/29/2011 COCHIN (quietleapfrog) Links train, metro, bus, ferry, auto, taxi, parking, 2 wheelers & cycles Linked to commercial, entertainment, tourism, lifestyle 70% of people need not enter city (larger hubs gateways to grid of smaller hubs) Transform economy & lifestyle Sustainable – supported by real estate elements Mexico City 12
  • 66.
    11/29/2011 CAPE TOWN –entrepreneurial ventures, way-finding, workplaces, public-private innovation, moving minds Moving Minds Did Philip K. Dick predict or shape the future? 13
  • 67.
    11/29/2011 SYSTEM OF SYSTEMS:CHANGES THE GAME Connects Mode Service Product Technology Design  Door to Door (feeds trunk, focused on user)  Scalable / incremental / ALL YESES / induces demand  For all shapes & sizes of communities & regions  Short term / long term (not land use / policy dependent)  Appealing (design, cool status) & Safe & Equitable  Resilient & Robust (to climate / geopolitical challenges)  Business, Innovation, Job Opportunities (New Mobility Industry Cluster Multi-Billion $) NEW MOBILITY ECONOMIC BENEFITS Saves Money Creates Jobs Boosts Business Revitalizes Local Economy 14
  • 68.
    11/29/2011 TELECOMMUNICATIONS & WIRELESS CLEAN ENERGY E- BUSINESS & NEW MEDIA TRANSPORTATION INFORMATION EQUIPMENT TECHNOLOGY FINANCIAL SERVICES, TOURISM BAN KING & INVESTMENT NEW MOBILITY & RETAIL INDUSTRY TRANSPORTATION GEOMATICS OPERATIONS & SERVICES REAL ESTATE CONSTRUCTION, GOODS MOVEMENT PLANNING & & SUPPLY CHAIN INTELLIGENT MANAGEMENT OPERATIONS TRANSPORTATION SYSTEMS 15
  • 69.
    11/29/2011 NEW ROLES (AND OPPORTUNTIES) PUBLIC SECTOR – incentives to connectivity / systems convening beyond the usual players / implementing, integrative frameworks / platforms to boost innovation & implementation. MOBILIZATION PRIVATE SECTOR – public-private innovation (action affects policy), new products, marketing New Mobility culture PUBLIC PRIVATE INNOVATION ACADEME – new models / tech transfer based on real world contexts, understanding & advancing solutions (not just problems). ACCELERATING IMPLEMENTATION NGO’s – informing / new approaches, partnering, engaging constituencies / implementing METRO MANILA What Dots Are Already Connected? What dots can be easily connected? What needs to be added (locally and system wide)? What benefits can be reaped? Social, ecological economic? Who else should be at the table? What policies, business models, marketing approaches can help address the challenges? When does the fun start? 16
  • 70.
    11/29/2011 THE TRANSFORMATION BEGINS: STEP 1: NAME THE DOTS. ACCENTUATE THE POSITIVE 1 minute each • Your Name • Your effort / group • The thing you’re most proud, happy, excited, hopeful about • One other person / group you’d bring to the table SMART CONNECTIONS: • http://um-smart.org/blog or email me susanz@umich.edu • Living Labs (in pilot communities & regions) & NETWORK • Primer (Connecting & Transforming) • Global Learning Community (education & capacity building) • SMART Exchange collaborative tool -- smartumich.ning.com • Business network • Research collaborative • Regular gatherings / summits of the “systems” network 17
  • 71.
    ANNEX 4 Metropolitan Manila Transport and Traffic Development and Management Program
  • 72.
    Source: National StatisticalCoordination Board 1
  • 73.
    Circumferential Roads C-1 Claro M. Recto Avenue, P. Casal St., Ayala Boulevard and P. Burgos St. C-2 Tayuman Road, Arsenio Lacson Avenue, Nagtahan Boulevard and Quirino Avenue C-3 Libis Gochuico St., 5th Avenue, Sgt. Rivera St., G. Araneta Avenue, South Avenue, Makati Avenue, Ayala Avenue and Gil Puyat Avenue C-4 Letre Road, Samson Road and EDSA C-5 C.P. Garcia Avenue, E. Rodriguez Jr. Ave., Boni Serrano Ave., Katipunan Avenue, Congressional Ave. Ext., Tandang Sora Ave., Mindanao Ave., and NLEX Radial Roads R-1 Delpan St., Bonifacio Drive, Roxas Boulevard R-2 Antonio Villegas Road, Taft Avenue and E. Quirino Avenue R-3 Metro Manila Skyway SLEX R-4 Pedro Gil. St., Tejeron St., J.P.Rizal St., J.P. Rizal Ext. and Pasig River Expressway R-5 Ramon Magsaysay Boulevard, V. Mapa Boulevard, P. Sanchez St., Shaw Boulevard and Pasig Boulevard R-6 Legarda St., R. Magsaysay Boulevard, Aurora Boulevard & Marcos Highway R-7 Quezon Boulevard, Lerma St., Quezon Avenue, Elliptical Road, Commonwealth Avenue, Quirino Highway and Manila-Del Monte-Garay Road R-8 Alfonso Mendoza St. Dimasalang St., A. Bonifacio Avenue and NLEX R-9 McArthur Bridge, Rizal Avenue, Manila North Road, McArthur Highway R-10 Pres. Marcos Highway and Manila-Bataan Coastal Road 2
  • 74.
    2008 2009 2010 PHILIPPINES 5,891,271 6,220,433 6,634,855 NCR 1,670,150 1,768,033 1,904,395 CARS 423,759 415,568 435,473 UTILITY VEHICLES 525,342 526,910 558,123 SPORTS UTILITY VEHICLES 112,887 121,984 145,438 BUSES 9,521 12,319 14,184 TRUCKS 61,336 68,119 69,181 MOTORCYCLES / TRICYCLES 525,082 608,839 667,424 TRAILERS 12,223 14,294 14,572 Source: Land Transportation Office 5 3
  • 75.
    No. of 85 terminals in Metro Manila Terminals Sampaloc =29 clusters EDSA – Cubao = 26 EDSA – Pasay = 19 Buendia – Pasay=7 Monumento =4 No. of 60 provincial bus companies No. of PUB 7,368 units FRANCHISE UNIT METRO MANILA CITY BUS 92 5,083 METRO MANILA PROVINCIAL BUS 653 6,999 SHUTTLE SERVICE 151 1,227 TAXI 236 14,038 TOURIST BUS 32 876 TOURIST CAR 20 1,575 TRUCK FOR HIRE 410 15,902 UTILITY VEHICLE 125 2,814 TOTAL 1,719 48,514 SOURCE: Land Transportation Franchising and Regulatory Board (LTFRB) Data Base 4
  • 76.
    Northrail MRT7 LRT 1 NORTH EXT (Closing the Loop). MRT4 LRT2 MRT8 MRT3 LRT1 PROPOSED EXISTING h PNR Northrail-Southrail Linkage Phase 1 nsio Sout LRT Line 2 (Caloocan-Alabang, 34 km) Exte Line I PNR Line n LRT Line 1 PNR Northrail-Southrail Linkage Phase 2 LRT Metro Star (Alabang-Calamba, 27 km) PARTICULAR LRT 1 LRT 2 MRT 3 PNR (including the (Mega Tren) (Metro Star) line 1/MRT 3 Loop) No. of Light Rail 111 LRVs 13 train sets 73 LRVs 18 LRV Vehicles (LRV) (operational cars, coaches or train sets) Capacity per LRV, Car or 81 seated/293 232 seated/ 80 seated/ 194 seated/ Coach (passengers) standees 349 standees 314 standees 360 standees Annual Ridership 155.91 Million 63.36 Million 153 Million 9.138 Million (2010) (2010) (2010) (2009) Daily Average Ridership 427,151 172,850 420,482 397,989 (2010) (2010) (2010) (2009) SOURCE: Department of Transportation and Communication 5
  • 77.
    SOURCE: Department ofTransportation and Communication Non Fatal Damage to Grand Month Fatal Injury Property Total January 33 1,266 4,780 6,079 February 24 1,309 4,830 6,163 March 32 1,296 5,156 6,484 April 31 1,185 4,821 6,037 May 30 1,164 5,037 6,231 June 34 1,120 4,960 6,114 July 42 1,298 5,642 6,982 August 37 1,355 5,405 6,797 September 34 1,244 5,294 6,572 October 25 1,170 5,265 6,460 November 27 1,269 4,799 6,095 December 31 1,143 5,465 6,639 Grand Total 380 14,853 61,705 76,938 SOURCE: Metro Manila Accident Reporting and Analysis System (MMARAS) 6
  • 78.
    Non Fatal Damage to Grand Month Fatal Injury Property Total January 34 1,397 4,717 6,148 February 35 1,218 4,508 5,561 March 34 1,385 5,134 6,553 April 30 1,230 4,329 5,589 May 30 1,091 4,274 5,395 Grand Total 168 6,321 22,962 29,446 SOURCE: Metro Manila Accident Reporting and Analysis System (MMARAS) Non Fatal Damage to Fatal Grand Total Month Injury Property 2010 2011 2010 2011 2010 2011 2010 2011 January 0 0 8 2 28 11 36 13 February 1 0 35 24 106 60 142 84 March 2 2 26 27 111 74 139 103 April 0 0 24 32 93 80 117 112 May 1 1 18 19 42 49 61 69 Grand 4 3 118 104 380 274 495 381 Total SOURCE: Metro Manila Accident Reporting and Analysis System (MMARAS) 7
  • 79.
    2010 2011 TYPE OF PERSON INVOLVED KILLED INJURED TOTAL KILLED INJURED TOTAL DRIVER 0 66 66 0 62 62 PASSENGER 1 41 42 1 81 82 PEDESTRIAN 3 21 24 2 20 22 TOTAL 4 128 132 3 163 166 SOURCE: Metro Manila Accident Reporting and Analysis System (MMARAS) NO PHYSICAL CONTACT APPREHENSION ALONG COMMONWEALTH AVENUE period coverage (January 26 to April 10, 2011) VIOLATION BUS PRIVATE PUJ TAXI TOTAL 1 PUV LANE ORDINANCE 11,636 0 29 1 11,666 2 LOADING/UNLOADING IN 991 0 1 5 997 PROHIBITED ZONE 3 RECKLESS DRIVING 16 0 0 0 16 4 ILLEGAL PARKING 0 1 0 1 2 (NOT TOWED) 5 OPEN DOOR POLICY 130 0 0 0 130 6 OVERSPEEDING 452 648 9 235 1,344 7 OBSTRUCTION 3 0 0 0 3 TOTAL 13,228 649 39 242 14,158 No. of Summon/Citation mailed = 10,422 8
  • 80.
    COLORUM MONTH PERCENT INCREASE / 2010 2011 DECREASE JANUARY 55 188 242% FEBRUARY 78 88 13% MARCH 89 172 93% APRIL 56 84 50% MAY 65 --- --- JUNE 53 --- --- JULY 132 --- --- AUGUST 248 --- --- SEPTEMBER 209 --- --- OCTOBER 129 --- --- NOVEMBER 168 --- --- DECEMBER 141 --- --- TOTAL 1,423 532 1. Obstructions and illegal structures along the carriageways 2. Outmoded traffic signal system 3. Poor road condition 4. Inadequate public transport 5. Vehicular and pedestrian accidents 6. Low or weak enforcement of transport and traffic related-laws/regulations, and 7. Lack of discipline and poor road behavior 9
  • 81.
  • 82.
    ● Establishment ofthe Mega Manila Provincial Integrated Bus Axis System (MM-PIBAS) ● Development of Airport Tram System ● Installation of Intelligent Transport System ● Development of alternative modes of transport • Installation of road signs and markings following international standards • Construction of rotundas • Landscaping and beautification 11
  • 83.
    ● Construction ofshort span left-turn fly-over Possible Sites: 1.MIA Road – Domestic Road 2.Roxas Boulevard – MIA Road 3. North Avenue – Mindanao Avenue ● Replacement of high-pressure sodium streetlights to energy - efficient LED lights 12
  • 84.
  • 85.
    LOCATION PEDESTRIAN COUNT LOCATION PEDESTRIAN COUNT 1 ALABANG - SOUTH SUPER HIGHWAY/MONTILLANO (INFRONT OF JOLLIBEE) 449,848 35 EDSA - NORTH AVENUE b 104,580 2 AMA SOUTH SUPER HIGHWAY - MAKATI … 36 EDSA - ORTIGAS AVENUE b 129,331 3 AURORA BOULEVARD - ARANETA CENTER b 19,378 37 EDSA - PROJECT 7 10,227 4 AURORA BOULEVARD - KATIPUNAN AVENUE b 29,627 38 EDSA - QUEZON AVENUE a 121,352 5 BICUTAN INTERCHANGE a 202,223 39 EDSA - ROOSEVELT AVENUE b 114,532 6 C.M. RECTO - LEGARDA - MENDIOLA 91,013 40 EDSA - SM NORTH ANNEX 23,445 7 C4 - DAGAT-DAGATAN 47,757 41 EDSA - TAFT AVENUE 169,764 8 C5 - BETWEEN MARKET MARKET & PETRON (MINI PARK) 2,952 42 EDSA - TINIO 6,089 9 C5 - BLUE BOZ 8,611 43 EDSA BETWEEN NORTH AVE. & QUEZON AVE. (CENTRAL TERMINAL) 6,664 44 JUAN LUNA - TAYUMAN (PRITIL) 4,780 10 C5 - DIEGO SILANG 10,686 11 C5 - EASTWOOD AVENUE 16,641 45 MARCOS HIGHWAY - A. RODRIGUEZ / LIGAYA ab 7,135 12 C5 - INFRONT OF CENTENNIAL VILLAGE 1,218 46 MARCOS HIGHWAY - F. MARIANO / MANILA BAPTIST b 13,568 13 C5 - JULIA VARGAS b 6,125 47 MARCOS HIGHWAY - IMELDA AVENUE / STA. LUCIA ab 62,053 14 C5 - KALAYAAN AVENUE 5,828 48 MARCOS HIGHWAY - INFRONT OF MONTE VISTA SUBDIVISION b 2,476 15 C5 - MERCURY 1,480 49 MARCOS HIGHWAY - TAYUG ab 8,455 b 16 COMMONWEALTH AVENUE - BATASAN 74,679 50 MARCOS HIGHWAY INFRONT OF SAN BENILDE SCHOOL 3,708 17 COMMONWEALTH AVENUE - INFRONT OF COA 9,663 51 MC ARTHUR HIGHWAY - GEN. T. DE LEON STREET (KARUHATAN) 5,873 18 COMMONWEALTH AVENUE - INFRONT OF DILIMAN PREP. a 9,361 52 MINDANAO AVENUE - TANDANG SORA 14,577 19 COMMONWEALTH AVENUE - INFRONT OF IGLESIA NI CRISTO 11,340 53 QUEZON AVE. BETWEEN SCOUT CHUATOCO & ROOESEVELT 7,891 20 COMMONWEALTH AVENUE - INFRONT OF ST. PETER CHURCH 6,304 54 QUEZON AVENUE - ARANETA AVENUE b 45,488 21 COMMONWEALTH AVENUE - LUZON AVENUE (PUREGOLD) 26,305 55 QUEZON AVENUE - BANAWE b 12,639 22 COMMONWEALTH AVENUE - TANDANG SORA 16,464 56 QUEZON AVENUE - ESPAŇA ROTUNDA 24,217 23 COMMONWEALTH AVENUE - UP AYALA TECHNO HUB 2,630 57 QUEZON AVENUE - ROCES AVENUE b 10,839 24 COMMONWEALTH AVENUE INFRONT OF U.P. AIT 3,097 58 QUEZON AVENUE - SCOUT BORROMEO 8,998 25 DR. SANTOS AVENUE - NEAR CANAYNAY AVENUE (EVACOM) 12,494 59 QUEZON AVENUE - SCOUT MAGBANUA b 4,362 26 EDSA - AURORA BOULEVARD 153,006 60 QUEZON AVENUE - STO. DOMINGO b 14,468 27 EDSA - BAGONG BARRIO (GEN. TIRONA) b 15,864 61 QUEZON AVENUE - WEST AVENUE b 12,309 28 EDSA - F.B. HARRISSON 8,387 62 QUEZON AVENUE INFRONT OF LUNG CENTER 3,404 29 EDSA - GEN. MALVAR STREET 7,997 63 ROXAS BOULEVARD - MIA ROAD 57,605 30 EDSA - INFRONT OF CENTRAL COMMERCIAL ARCADE 18,628 64 ROXAS BOULEVARD - US EMBASSY, MANILA … 31 EDSA - KATIPUNAN STREET NEAR BALINTAWAK 12,794 TOTAL: 2,342,463 32 EDSA - LIBERTAD 6,021 a 33 EDSA - MAIN AVENUE 6,401 footbridge with ramp 34 EDSA - MONUMENTO INFRONT OF MCU b 36,812 b footbridge with stair step cover 14
  • 86.
    DIRECTION 2010 2011 % CHANGE TRAVEL TRAVEL TRAVEL TRAVEL TRAVEL TRAVEL TIME SPEED TIME SPEED TIME SPEED 20% 22.82% NORTHBOUND 0:43:56 33.18 0:35:09 40.75 DECREASE INCREASE 12.20% 26.38% SOUTHBOUND 0:57:30 24.87 0:50:29 31.43 DECREASE INCREASE 15.58% 24.36% AVERAGE 0:50:43 29.03 0:42:49 36.09 DECREASE INCREASE Source: MMDA-TEC Date of Survey: November 11, 2010 and February 17, 2011 15
  • 87.
    BACLARAN ( REDEMPTORIST- ROXAS BLVD.) 16
  • 88.
  • 89.
  • 90.
  • 91.
  • 92.
    ANNEX 5 Background andOverview of the Project on Catalyzing New Mobility in Cities: the Case of Metro Manila
  • 93.
    11/29/2011 Catalyzing New Mobilityin Cities: The Case of Metro Manila ATENEO SCHOOL OF GOVERNMENT The Graduate School of Leadership and Public Service What are the Expected Take-Aways from this Inception Meeting  An understanding of the background, objectives, scope, and deliverables of the New Mobility in Metro Manila project  A shared awareness of the related initiatives of key partners  An initial discussion of the focus and approach of the proposed major research components of the project  A road map of the process of cooperation and conversation among stakeholders over the next year  An openness to the idea that a new perspective like New Mobility may help trigger positive changes in the Metro Manila traffic situation 1
  • 94.
    11/29/2011 Let us stop battling traffic congestion and think for a moment  Is it possible the ordinary Metro Manilan is left out in the planning and operation of the transport and traffic system in Metro Manila?  Is it possible the ordinary Metro Manilan has valuable exclusive but segmented and fragmented knowledge of the existing Metro Manila traffic and transport system?  Is it possible there are types of stakeholders in Metro Manila traffic and transport system we have not heard of and from?  Is it possible our preferred strategies for dealing with traffic congestion in Metro Manila may not be the most effective, efficient, or equitable approaches to the problem?  Is it possible there are innovative initiatives that have worked to increase mass mobility in other countries that we have not considered for Metro Manila?  Is it possible we have sought to serve rather than to empower the people? Purpose  The project focuses on the introduction and use of New Mobility as a lens in search of more sustainable and innovative solutions in the urban public transport system in Metro Manila, in particular, ensuring that the needs of the poor and the vulnerable are met.  It aims to utilize and complement existing studies by initiating a sustainable Metro wide conversation among stakeholders to introduce the New Mobility framework and find out how they can begin actualizing their vision the future of the public transport system. 2
  • 95.
    11/29/2011 Attention to thePoor and Vulnerable Sectors  The project considers how the current public transport system affects the poor and the vulnerable population of Metro Manila and gives importance to identifying new or emerging entrepreneurial or livelihood opportunities responsive to the mobility needs of the general public especially of the poor and the vulnerable. The New Mobility initiative  Incorporates the dimensions of sustainability in transportation such as social equity, economic and financial well-being, health, ecology, physical environment, air quality and noise and climate change. 3
  • 96.
    11/29/2011 The New Mobilityinitiative  Enlarging the discourse on transport by promoting a multi-disciplinary, multi-sector, top-bottom and bottom-top approach to address the issue of moving people and goods and making the existing transport infrastructure and services really work for all. New Mobility Initiative  The Initiative helps provide an enabling environment in the transport sector to ensure stakeholders’ involvement particularly that of the poor and the vulnerable to expand their mobility-related choices. 4
  • 97.
    11/29/2011 Implementing Organization  This Project is another expression of Ateneo de Manila University-School of Government’s (ASoG) Knowledge and Practice Areas (KPA)  KPAs conduct action researches with partners from government, civil society organizations, private sector, communities and development organizations, the results of which are then fed into its academic and executive training modules. Project Collaborators  ASoG will collaborate with the University of Michigan’s Sustainable Mobility & Accessibility Research & Transformation (SMART) and World Resources Institute (WRI)-EMBARQ India, themselves in search of actionable opportunities for demonstrating the efficacy and responsiveness of the New Mobility paradigm to the poor and vulnerable sectors of society. 5
  • 98.
    11/29/2011 Rockefeller Foundation  This search for actionable opportunities in New Mobility is made possible by a grant from the Rockefeller Foundation, which has a century-old tradition and success in funding strategic initiatives that significantly improve overall human well-being. Three Main components over next 12-months  Stakeholder workshops  Mapping and Research  Information and Promotion 6
  • 99.
    11/29/2011 Multi-Stakeholder Workshops  Envision multi-stakeholders in Metro Manila’s mobility system -- the policy makers, in particular Metropolitan Manila Development Authority(MMDA) and Metro Manila Local Government Units (LGUs), the private and civil society sectors – are engaged in Metro-level mobility summits and workshops to create a system of discourse, engagement, and ownership in the project Research  Mapping of the ”visible” (physical) and invisible (“behavioral”) public transport system, especially the informal hubs in Metro Manila  Understanding the impact/costs of (inefficient) public transportation particularly on the poor and vulnerable in MM and  identification and classification of emerging (or existing) entrepreneurial or livelihood opportunities and determining policy or market barriers and/or enablers, and 7
  • 100.
    11/29/2011 Knowledge Sharing  Knowledge Sharing is designed for stakeholders to better understand the New Mobility initiative. The project complements the iBoP Asia’s core programs in Enabling Innovation in Policy, Learning and Capacity Building and Business for Inclusive Development.  It is expected that the Search develop a new platform, resource centre and enabler of innovation for socially inclusive mobility in the region using Metro Manila as a case study. New Mobility Imbues Metro Manila Traffic and Transport Action Plan with an Inclusiveness Dimension  Inclusiveness in Safety  Inclusiveness in Mobility  Inclusiveness in Productivity  Inclusiveness in Civility 8
  • 101.
    11/29/2011 What the Governmentaims for Metro Manila  Inclusiveness – design the transportation system for the pedestrian, the bicyclist, the commuter, the short to long tripper, the inner-outer tripper  Safety – design safety for the pedestrian  Mobility – design mobility for the pedestrian  Productivity – design productivity for rich and poor, students and professionals alike  Civility – design civility into interactions – focus on cooperative vs conflictful interactions, solving common problems rather than filing cases in court, etc. Getting the Others On Board -- Target Beneficiary Motivation • Car-Owners, Commuters, Bikers, Pedestrians • Metro Manilans, Mega Manilans, Other Filipinos • Past, Present, Future Generations 9
  • 102.
    11/29/2011 Building an EnablingEnvironment for Multi-Stakeholder Empowerment  Shared Knowledge  Discourse and Ferment  Mobility and connectivity Initiatives New Mobility Facts  Where are the informal transportation hubs? What are the attributes of this network? How does it compare with the formal network?  What is the formal transportation network as planned? What is the formal network as it actually exists?  How do Metro Manilans actually combine modes, services, etc. of transportation to reach their destinations? 10
  • 103.
    11/29/2011 Economics of Mobility What are the costs of poor access to transport to the urban poor and vulnerable sectors?  What contributions to productivity will democratized access to transportation generate? Social enterprise  What are the entrepreneurial opportunities and solutions that exist or can be generated to make transport more democratically accessible?  How can we encourage the poor and the vulnerable to participate in transport- oriented enterprises? 11
  • 104.
    11/29/2011 Governance, Not Government  Focus on building habits of cooperative decision-making, not enforcement rules  We are always told – never say “lack of resources” is the problem  In this project, we restrain ourselves from saying that government “policy” is the problem.  Rather than waiting for the right policy, we ask, what can target beneficiaries do to improve the mobility of the poor and vulnerable Metro Manilans, and how can they continue to develop the capacity and persistence to continue enhancing their mobility by absorbing more workable ideas and innovations. Connect “Islands” of transportation systems  As highlighted in the SMART Primer (2011), transportation can be viewed as a “system of systems”, connecting nodes, services, technologies and designs according to the best option for the purpose.  Thus, the concept of transportation goes beyond infrastructure. It involves behavioral mobility changes as well as innovations coming from various stakeholders. • It even involves building bridges across “mobility enclaves” (e.g., TODA districts) bounded by belts of “uncharted” territory  We must learn that mobility is the means, accessibility is the goal. 12
  • 105.
    11/29/2011 Paradigm for New Mobility In Metro Manila Current Situation New Approaches Goal Mobility via additional road capacity To provide accessibility; demand is managed through road capacity and utilizing seems to be the goal. other means and connections like Pasig River and all other available modes. Public transport that is multi-modal and interconnected is central; a people- centered approach Basis Deterministic model forecasts by technical Plans are based on sustainable policies and strategic planning; robustness, experts; outputs provide the answers: a technical soundness, and stakeholder support are criteria for policy/project detailed plan with good rates of return adoption. Preparation for Usually based on old studies; use of simple Preparation for the future involving various stakeholders is central; more relevant an uncertain sensitivity testing. strategies and projects result. future In the public sector, the decision-making is fragmented and prone to morphing with changes in political winds. Content Building projects, mainly roads, bridges, Scoping, research and management/integration of the existing transport system; flyovers within the city; frequent focus on inter-modal public transport modes and non-motorized transport systems megaprojects. including pedestrian improvements The approach is interdisciplinary and is expected to involve all the sectors. Financing Affordability is assumed. Reliance on Affordability is an input and financial and technical planning proceed together; national government for funding of focus on sustainability of operations and role of private sector (PPP approach) and transport infrastructure. entrepreneurs especially in transportation information systems, network optimization strategies and business opportunities (employment opportunities), incentives programs etc. Stakeholder Plans devised by technical experts using Strong stakeholder involvement and influence; technical inputs are fit for purpose; involvement transport models; little stakeholder strong consensus is a requirement. influence. Implementatio Seen as a problem to be sorted out later Implementation processes are put in place and impediments are addressed early. n Identification of market and policy barriers and enablers. Governance The planning process is often politicized; The planning process is technocratic and informs hard political decisions; and often, technical analyses provide improved governance is a prerequisite; the focus is on creating an enabling institutions justification for political decisions environment Project Organization Project Organization Project Director Provide overall direction and coordination and oversee implementation of the New Mobility Project Project Manager Oversee the manage the day-to-day implementation of the Project Plan GIS Expert Provide key background information and analysis of the visible and invisible public transport sector in Metro Manila Economist Examine the existing and emerging entrepreneurial or livelihood Social Enterprise opportunities (including finding models/ideas from other Specialist countries/cities) generated by the public transportation systems. Identify how the current and planned programs complement and overlap with the policies and governance/institutional arrangements, including identifying policy, market barriers, and/or enablers for the new mobility M&E Specialist To monitor and evaluate the progress/ deliverables of the project following iBoP Asia framework Support Staff Senior Research Associate Communication Associate Project Associate 13
  • 106.
    11/29/2011 Project Components Sustained Increased Multi-Stakeholder Accessibility for All Discourse on New Metro Manilans Mobility Research (Key Gaps Profile Raising & Workshops & Fora in Existing Data) Knowledge Sharing Govern- ment Identifying Existing & Policy & Mapping the Public Transportation Cost of Transport System in the Poor and Vulnerable Emerging Entrep & Action Livelihood Opp in the Metro Manila Groups in Metro Manila Transp Sector Growing a Research Framework  The research framework for the study is a work in progress, subject to stakeholder consultation and inputs  Key to the success of the research and mapping process is to come up with specifications of the outputs that will be responsive to the needs of target beneficiaries who are now being asked to articulate a vision and take action on access to transport issues.  Descriptive model – what are the physical and behavioral patterns out there?  Explanatory model – what are the drivers of the existing traffic and transport situation in Metro Manila  Prescriptive model – what should we do to democratize access to transport? 14
  • 107.
    11/29/2011 Indicative Project WorkProgram Follow-on Presentations  Research Projects  Other Project Activities 15
  • 108.
    11/29/2011 Metro Manila isindestructible  Manila was the second most devastated city after World War II, after Warsaw, Poland  It will survive and will persist in time.  But we should be able to shape it in accordance with the collective vision and aspirations of the people to better well-being.  It is up to people to get what they think they deserve Maraming Salamat Po! END OF PRESENTATION 16
  • 109.
    ANNEX 6 Mapping ofPublic Transport Networks
  • 110.
    11/29/2011 Mapping of Public Transport Networks Jun Castro, Dr. Eng. 27 Oct 2011 The need for database in planning  Effective planning requires a reliable database  Lack of common-use database for planning purposes makes decision-making difficult and prone to political intervention  Hence, there is a need to establish a common comprehensive database system to provide base information for urban and transport planning 1
  • 111.
    11/29/2011 Database concepts  Database - a collection of structured data, including the data dictionary that describes the data, the data integrity rules used to protect the data, as well as stored procedures which enable users to access the database.  Database system - a data processing system composed of the database and its database engine, user interfaces, application programs and communication software.  Database systems can be implemented on different computer platforms ranging from a single desktop personal computer to a cluster of computers and workstations in a networked environment. Types of Data in a Planning Database  Two types: spatial data and attribute data  Spatial data - data that can be displayed, manipulated and analyzed by means of a spatial attribute, normally provided in the form of coordinate points, denoting a location on the surface of the Earth. Classified into two fundamental forms - raster and vector.  Attribute data - relate to characteristics of real world features, which include demographic characteristics and socio-economic data. They cannot be analyzed or displayed spatially until they are digitized and registered to a particular geographic coordinate system 2
  • 112.
    11/29/2011 Spatial data types Spatial data Attribute data Land Parcel  Owner  Value Spatial data  Land use  Zoning Utilities  Water Mains  Electricity Vector data Attribute data  Telephone Transportation  Road network Topographic Application Demographic Scanned Base Data Maps  Traffic flows Administrative Raster data  Electoral Districts  Postal Districts  Local Authorities Spatial data Statistical Layers  Population  Socio-economic data  Planning zones Natural Resources GIS as suitable platform for Common Spatial Referencing  Land Cover  Water Resources spatial and attribute data Framework  Geology  Forestry  Agriculture Geographic Information System (GIS)  a computer-based technology designed to: 1. capture geographic data from various sources, and 2. process these data to produce information and graphical outputs in support of planning, management and decision- making concerning the utilization of land resources  a computer-based tool for mapping and analyzing things that exist and events that happen on earth. 3
  • 113.
    11/29/2011 GIS structure: Thematic Layers Addresses Boundaries Land use/land cover Parcels Planimetry - Buildings, streets, water bodies Orthophoto with contour Geodetic Control Focus Areas for the Study  Due to limitation on time and resources, focus on 4-5 areas along EDSA  North Ave MRT station  Quezon Ave Station  Cubao Station  Ortigas Station  Ayala Station  PT transport data will be collected on proximate areas (within 500m radius from the MRT Station)  PT routes  Terminals/Embarkation/Disembarkation points  Parking areas  Pedestrian facilities  U-turns, etc. 4
  • 114.
    11/29/2011 Transport Database and Sources  Road network and capacities (MMDA, DPWH)  Vehicle types and volumes (MMDA, DPWH)  Public Transport services (rail, jeepney, bus, tricycles, etc) (DOTC, LTFRB, LGUs)  PT Routes  Terminals/Embarkation/disembarkation areas  Coverage areas  Pedestrian improvements (MMDA, LGUs)  Facilities (pedestrian lanes, walkways) and Services (elderly , persons with disabilities, pregnant women)  Traffic Management (MMDA) SAMPLE MAPS 5
  • 115.
    11/29/2011 Road network: Numberof lanes Public Transport Routes 6
  • 116.
    11/29/2011 PT Facilities:North Ave Station PT Facilities: Quezon Ave Station 7
  • 117.
    11/29/2011 PT Facilities: CubaoStation PT Facilities: Ortigas Station 8
  • 118.
    11/29/2011 PT Facilities: Ayala Station Database can be shared using Google Earth 9
  • 119.
    11/29/2011 Thank you foryour attention. 10
  • 120.
    ANNEX 7 Impact andCost of Public Transport on the Poor and the Vulnerable
  • 121.
    Ateneo School ofGovernment 11/29/2011 Catalyzing New Mobility in Cities: The Case of Metro Manila Inception Meeting Gateway Suites, 4th Floor Gateway Mall, Araneta Center, Cubao, Quezon City October 27, 2011 with generous support from Impact and Cost of Public Transport on the Poor and the Vulnerable Randolph D. Carreon, MATP, BSEcon Transport Economist 1
  • 122.
    Ateneo School ofGovernment 11/29/2011 Background • The poor comprise a considerable part of the population of Metro Manila. • The cost of transport, specifically that of public transport, has been on an increasing trend over the past few years. • The increasing cost of public transport has a much greater impact on those within the lower income brackets. • Vulnerable groups include (i) Persons With Disability (PWDs), (ii) Senior Citizens, and (iii) Women and Children. • These sectors have specific transport needs. • The transport needs of these vulnerable groups have relatively received less attention. • Public transportation plays a vital part of the transport system in Metro Manila. • It is estimated that approximately 78% of all person trips are made through public transport. • An inefficient public transport system entails (i) higher transport costs and (ii) other non–quantifiable costs. Objectives of the Study • The Study aims : – to understand the nature of the transport needs, accessibility, mobility and transport costs of the poor and vulnerable groups. • Specifically, the Study aims to: – establish the travel demand patterns of the poor and vulnerable groups; – look qualitatively into the efficiency of the public transport system vis-à-vis the needs of the poor and the vulnerable groups; – estimate the cost of transport of the poor; – estimate the actual and desired cost of transport of those within the vulnerable groups; and – examine other non–quantifiable costs, if any, incurred by the vulnerable groups 2
  • 123.
    Ateneo School ofGovernment 11/29/2011 Scope and Limitation • The Study will cover: – The “Poor” as those living within “colonies” of informal settlers. – The “Vulnerable Groups” • (i) PWDs, (ii) Senior Citizens, and (iii) Women and Children. – An additional category consisting of those working in Business Process Outsourcing (BPO)will also be covered. • The Study will use primary and secondary data, covering all the LGUs in Metro Manila, will be collected – Primary data will be gathered from selected areas – Secondary data to be gathered will cover all the LGUs in Metro Manila Primary Data Gathering Methodology • The Study will conduct household interview surveys in: – At least three (3) informal settler colonies: • Areas being considerde: – Barangay Old Balara, Quezon City; – Along Agham Road, Quezon City; – Barangay Addition Hills, San Juan; and – Sangandaan (EDSA Extension), Caloocan City • The sampling rate for the household interviews will be approximately 2.5% per area. • The Study will conduct individual interview surveys among – (i) PWDs, (ii) Senior Citizens, (iii) Women and Children, and (iv) BPO workers. • The interviews will be conducted in public places such as public transport terminals, MRT Stations, malls, to name a few. BPO workers will be interviewed in their respective offices. – The target number of samples is 2,000 respondents from among all the vulnerable groups. • The Study will conduct Key Informant Interviews (KII) / Focused Group Discussions (FGD) with organizations of vulnerable groups within the different Local Government Units in Metro Manila. 3
  • 124.
    Ateneo School ofGovernment 11/29/2011 Expected Outputs • The Study Report: – Impact and Cost of Public Transport on the Poor and the Vulnerable – The analyses will be done to encompass the entire study area. • Specific Case Studies will be prepared to highlight certain facets/portions of the Study. These will cover: – Typical Family/Household within the informal settler colonies – Person With Disability – Senior Citizen – Working Woman – Employee of a BPO Time Frame Activity Inclusive Dates Study Outline End - November 2011 (Finalization) Review of Previous November 2011 Studies/Literature Study Methodology End – November 2011 (Finalization) Data Gathering Nov – Dec 2011 Initial Findings End-January 2012 Completion of Analyses Dec 2011 – Feb 2012 (Draft) Final Report March 2012 Final Report End – March 2012 4
  • 125.
    Ateneo School ofGovernment 11/29/2011 Thank You 5
  • 126.
  • 127.
    11/29/2011 Catalyzing New Mobilityin Cities: The Case of Metro Manila Inception Meeting Gateway Suites, 4th Floor Gateway Mall, Araneta Center, Cubao, Quezon City October 27, 2011 with generous support from Ateneo Center for Social Entrepreneurship 1
  • 128.
    11/29/2011 RESEARCH OVERVIEW  Research Goals & Objectives  Scope & Limitations  Preliminary Research Direction I. The Social and Economic Dimension of the Transport Sector and New Mobility II. Mapping the Transport Sector as an Enterprise III. Commercial and Enterprise Activities IV. Emerging Enterprises and Innovations in New Mobility V. Future Directions  Key Framework Design for Research Questions  Research Activities & Timeline RESEARCH GOALS & OBJECTIVES I. Identify existing transportation related social enterprises or mobility innovations in the Philippines and other countries (i.e. BRT – Colombia, France, Curitiba) II. Generate ideas and business models on new mobility and transport-related social enterprises with high potential to benefit the poor and the vulnerable III. Identify market barriers and enablers for the development of new mobility innovations  Economic (Consumers, Market)  Social (Relations that govern these elements and dynamics)  Cultural Patterns and Behaviors 2
  • 129.
    11/29/2011 SCOPE & LIMITATIONS I. Focus: Commercial and enterprise component of the transport and new mobility sector • More efficient, less cost, safe, convenient and poor and vulnerable-friendly transport systems • Market Drivers (Barriers/Enablers) II. Research activities will involve the following: 1. Interviews with proponents, managers and customers of existing mobility enterprises and projects 2. Focused group discussions (FGD) / crowd sourcing to generate ideas on transport related social enterprises III. Geographic coverage: Metro Manila IV. Will not deal substantially on policy issues PRELIMINARY RESEARCH DIRECTION I. The Social and Economic Dimension of the Transport Sector and New Mobility • Social context / Cultural landscape of Mobility in Metro Manila • Developments and evolution of the transport and new mobility in Metro Manila • Historical changes - economic drivers and rationale, sociological perspective • Behavioral Patterns of the transport and new mobility market II. Mapping the Transport Sector as an Enterprise III. Commercial and Enterprise Activities IV. Emerging Enterprises and Innovations in New Mobility V. Future Directions 3
  • 130.
    11/29/2011 PRELIMINARY RESEARCH DIRECTION I. The Social and Economic Dimension of the Transport Sector and New Mobility II. Going Back to the Roots: The Transport Sector as an Enterprise a. Historical Overview of the Urban Transport Development in Metro Manila b. Mapping Metro Manila’s Transport Sector 1. Formal i. Rail Transit ii. Bus Transit iii. Jeep iv. FX v. Taxi vi. Tricycle, Pedicab, Padyak (TODA) 2. Informal (Collorum, Car Sharing) c. Rationale of the Emergence of the Transport Enterprise Activities d. Market Overview 1. Supply – Demand Analysis 2. Barriers and Enablers III. Commercial and Enterprise Activities IV. Emerging Enterprises and Innovations in New Mobility V. Future Directions PRELIMINARY RESEARCH DIRECTION I. The Social and Economic Dimension of the Transport Sector and New Mobility II. Mapping the Transport Sector as an Enterprise III. Commercial and Enterprise Activities 1. Development and Emergence of Commercial and Enterprise Activities in Metro Manila 1. Historical Background 2. Mapping the Developments of Commercial Centers in Manila 3. Formal Enterprise Activities i. Malls, Supermarkets, Restaurants, Boutiques, etc. ii. Transportation – Goods Hubs (i.e. FTI, Mega Markets, “Bagsakan”) iii. Other business centers where people gain access to basic goods and services 4. Informal Enterprise Activities i. Street Peddling ii. Others 2. Rationale of the Emergence of the Commercial Enterprise Activities 3. Market Overview i. Supply – Demand Analysis ii. Barriers and Enablers IV. Emerging Enterprises and Innovations in New Mobility V. Future Directions 4
  • 131.
    11/29/2011 PRELIMINARY RESEARCH DIRECTION I. The Social and Economic Dimension of the Transport Sector and New Mobility II. Mapping the Transport Sector as an Enterprise III. Commercial and Enterprise Activities IV. Emerging Enterprises and Innovations in the New Mobility Paradigm 1. Emerging Models and Activities of Enterprise Innovations in New Mobility - Commercial and Social (Business) Enterprises • People • Goods • Services 2. Market Overview i. Supply – Demand Analysis ii. Barriers and Enablers iii. Systems and Structural Developments a) IT b) Market System c) Others 3. Rationale of Development 4. Socio-Economic Potential and Success Factors V. Future Directions PRELIMINARY RESEARCH DIRECTION I. The Social and Economic Dimension of the Transport Sector and New Mobility II. Mapping the Transport Sector as an Enterprise III. Commercial and Enterprise Activities IV. Emerging Enterprises and Innovations in New Mobility V. Future Directions  Projections of sustainable business models for new mobility social enterprises in Metro Manila – potentials and challenges  Replicability of existing models and ideas generated from RRL studies and crowd sourcing activities  Role of social enterprises / social entrepreneurship and social business innovation in addressing the new mobility challenges with particular consideration for the poor and vulnerable and other dimensions  Dimensions: - Safety - Health - Economy/Cost - Convenience - Efficiency - Environment  How will the challenges shape the mobility of people, goods and services? 5
  • 132.
    11/29/2011 Social Entrepreneurship / SocialEnterprise  Innovative ways of providing solutions to pervasive social problem  Sustainable  Innovative  Addresses a social problem  Enterprising Examples of Innovations in the Transport and Mobility Sector Mobius WMATA Motors (Africa) Trip Planner (DC) Capital Bikeshare (DC) RORO (Phils, Others) Suica, Pasmo (Japan) Bayad Centers (Phils) Bambike (Phils) 6
  • 133.
    11/29/2011 Key Considerations forResearch Framework and Guide Questions  Considerations for emerging new mobility sector: - Efficiency (time to get from point A to point B) - Cost (cheaper transport fare) - Environmental - Convenience and Safety  What are the enterprises - commercial, social and public - that can be introduced and implemented to address these concerns  Proximate demands and supply for new mobility mechanisms – (characteristics of the demand segment) consumer profile in terms of segmentation that make up for the demand for new transport enterprises/new mobility  Mechanisms, infrastructures, systems (i.e. IT, control hubs, online reservations, applications, information access, etc.) that can support the various needs and requirements of the new mobility consumers  What could be the features of the new mobility system that will be convenient and helpful to the consumers (ie. intermodal, centralized)  What are the incentives and principles that govern/encourages the emergence of new models to facilitate mobility of goods, people and services PRELIMINARY RESEARCH ACTIVITIES & TIMELINE • Finalize Research Design and Content • Finalize Research Survey and Questionnaire Nov ‘11 • Output: Research Design, Methodology and Survey Questionnaire • Dry-run Survey Activities • Output: Field Notes / Preliminary Field Report Dec ‘11 • Conduct Preliminary Market Study and Market Analysis • Interview Key Sectoral/Institutional Representatives Jan ‘12 • Output: Initial Market Study Report 7
  • 134.
    11/29/2011 PRELIMINARY RESEARCH ACTIVITIES& TIMELINE • Validation Study • Crowdsourcing • Research Data Processing Feb ‘12 • Output: Documentation,of FGDs, Report Draft 1 • Final Report Writing • Output: Final Draft Mar ‘12 8
  • 135.
    ANNEX 9 Activities Proposedand Tentative Schedule
  • 136.
    Ateneo School ofGovernment 11/29/2011 Catalyzing New Mobility in Cities: The Case of Metro Manila Inception Meeting Gateway Suites, 4th Floor Gateway Mall, Araneta Center, Cubao, Quezon City October 27, 2011 Dr. Danielle Guillen, Project Manager with generous support from Activities Proposed and Tentative Schedule 1
  • 137.
    Ateneo School ofGovernment 11/29/2011 Activities Proposed and Tentative Schedule ACTIVITIES DATE Partners Convening New Mobility Project January 2012 Launch/Mapping Consultative Research March 2012-April Seminars 2012 Transport & Mobility July 2012 Summit High-level August 2012 consultation meeting New Mobility Project Launch/Mapping, January 2012 1.Launch of partnership with MMDA 2.Mapping Exercise: Connecting Dots (Good news) • MMDA & 17 LGUs in Metro Manila • Public Sectors: Department of Transportation Department of Public Works & Highways Department of Sciences & Technology Department of Environment & Natural Resources Department of Labor & Employment Department of Trade & Industry Department of Energy Department of Tourism 2
  • 138.
    Ateneo School ofGovernment 11/29/2011 New Mobility Project Launching •Media •Print, radio, tv, web and blogs •Private Sector • Shopping Malls (Developer & Management) • Private Developers •Companies eg. BPOs • IT & Telecom • Lobby Groups – eg. Firefly Brigade, Cycling lane Advocates • NGOs New Mobility Project Launching • Academe & Professional Groups eg. PIEP, TSSP, UAP •International Organizations • WB, ADB, JICA 3. Launching of Crowd-sourcing activity: Innovation Award in Best Practice and/or Idea for Social Enterprise in the Transport Sector 3
  • 139.
    Ateneo School ofGovernment 11/29/2011 Crowd sourcing is a distributed problem- solving and production model • ensure participatory process • inputs to research • profile raising Social Enterprises are businesses that trade in the market in order to fulfil social aims. They bring people and communities together for economic development and social gain Innovation Award in Best Practice and/or Idea for Social Enterprise in the Transport Sector Schedule: Planning: Nov – Dec 2011 Launch : January 2012 Call for Nominations: Feb-Mar 2012 Committee deliberation: April 2012 Presentation to Rio Entrepreneurship Summit: May 2012 4
  • 140.
    Ateneo School ofGovernment 11/29/2011 Innovation Award in Best Practice and/or Idea for Social Enterprise in the Transport Sector Characteristics: Enterprise Oriented -involvement Social Aims - explicit social aims such as job creation, training and provision of local services; ethical values including a commitment to local capacity building; accountable to their members and the wider community for their social, environmental and economic impact. Social Ownership - autonomous organisations with a governance and ownership structure based on participation by stakeholder groups (users or clients, local community groups, etc.) or by trustees. Profits are distributed as profit sharing by stakeholders or used to improve the enterprise, or for the benefit of the community. Planning for the crowd sourcing activity: • Committee • Criteria for selection • Definition/Scale/Categories • Media Plan 5
  • 141.
    Ateneo School ofGovernment 11/29/2011 Activities Proposed and Tentative Schedule ACTIVITIES DATE Notes Research Activities Nov.2011-Mar.2012 Mapping of public Nov.2011-Mar.2012 transport service including informal hubs Impact/Cost Study of Nov.2011-Mar.2012 Inefficient Public Transportation System Entrepreneurial & Nov.2011-Mar.2012 Livelihood Opportunity Identification Policy and Market Feb. –July 2012 Barriers Activities Proposed and Tentative Schedule ACTIVITIES DATE Notes Profile Raising Oct2011- Nov.2012 Crowd sourcing activity: Jan.-Mar 2012 With partners Website Jan.2012 Portal Representations to Conference Study Tours for LGUs WRI Presentation at the New May 2012 Mobility Entrepreneur’s Conference in Rio Tri-media plan Oct 2011- Nov2012 6
  • 142.
    Ateneo School ofGovernment 11/29/2011 Thank you 7