This document summarizes a journal article that proposes improving the Improved Switching Constant False Alarm Rate (IS-CFAR) radar detection system using wavelet de-noising. IS-CFAR aims to maintain a constant false alarm rate but struggles with non-homogeneous environments containing clutter or interfering targets. The paper introduces applying wavelet de-noising to the reference cells of IS-CFAR to reduce noise and better estimate the noise level. Simulation results show this Improved IS-CFAR with wavelet de-noising (I2S-CFAR) achieves around a 2.6dB higher signal-to-noise ratio compared to IS-CFAR for the same probability of detection, especially in non
![Journal of Engineering and Development, Vol. 18, No.1, January 2014, ISSN 1813- 7822
165
1. Introduction
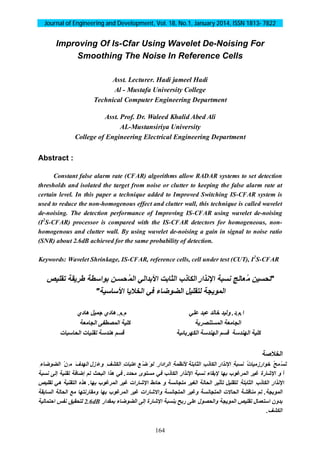
The goal of CFAR constant false alarm rate algorithms is to set thresholds high enough to
limit false alarms to a tolerable rate. When received echo reached to CFAR processor it's
entrance to shift register called CFAR window that contain number of cells [1]
. The middle
cell of CFAR window is contained the target which called "cell under test" (CUT) and other
cells that surrounding (CUT) contain information about target environment and there are
called "reference cells" in either homogenous or non-homogenous environments [2]
. Since the
clutter added to noise power is not refer to any given location, a fix threshold detection
scheme cannot be applied to the echo in individual range cells if the false alarm rate is to be
controlled. This set the threshold based on local information of total noise power [3]
.
The most basic forms of the adaptive detection processors are well-known mean level
detector such as in 1998 a new adaptive coherent CFAR wavelet detector which can be used
as an additional independent detector for effective CFAR detection of point targets [4]
, in 2005
another preprocessing approach based on a non-linear compressing filter to reduce the noise
effect [5]
, in 2007 a CFAR detector based on de-noising via wavelet shrinkage [6]
, in 2008
improved the switching CFAR (S-CFAR) in order to fix the false alarm rate (FAR) not only
in the homogenous environment with thermal noise but also in a non-homogenous
environment. This CFAR is known as Improved Switching CFAR (IS-CFAR) [7]
and in 2013
a new composite of CFAR processor also known as Improved switching CFAR (IS-CFAR)
but it is different from first IS-CFAR in 2008 because it have a new algorithm [8]
.
The word wavelet stands for small wave. Wavelets have been introduced for
representation of functions in a more efficient manner than Fourier series. Wavelets are
generated from one single function, called mother wavelet, by translation and dilation.
Wavelets have found applications in data compression, noise removal, pattern recognition,
fast computation etc. [9]
.
The wavelet transform is really a family of transforms that satisfy specific conditions.
The wavelet transform can be described as a transform that has basis functions that are shifted
and expanded versions of themselves, because of this, the wavelet transform contain both
frequency information and time information.
The major goal of noise reduction is to restore the original signals from noisy
environments. The wavelet transform has been shown to be a powerful tool for noise
reduction due to its capability of sparse representation1. Wavelet based scheme via hard
shrinkage and soft shrinkage [10]
.
2. Improved Switching CFAR (IS-CFAR)
In IS-CFAR method, the reference cells is divided into the leading window (called A for
simplification) and lagging windows (called B for simplification). Each of windows A and B
contained from N/2 reference cells, the block diagram of IS-CFAR is illustrated in Figure
(1) [8]
.](https://image.slidesharecdn.com/improving-210927205204/85/Improving-of-is-cfar-using-wavelet-de-noising-for-smoothing-the-noise-in-reference-cells-2-320.jpg)
![Journal of Engineering and Development, Vol. 18, No.1, January 2014, ISSN 1813- 7822
166
The reference cells in window A and B are partitioned into two sets , ⁄ and , ⁄ ,
respectively by comparing leading window A with the result from multiplication of the Cell
Under Test (CUT) with scale factor ( ) if the leading window A more than the result from
multiplication save X , in S , else neglect it and if the length of S , called n , and same
thing for lagging window B to generate S , and n ,
[8]
.
Where S , ⁄ denotes S , or S , , S , ⁄ denotes S , or S , , X , ⁄ denotes X , or X ,
for simplification. After all of the reference cells in window A and B have been compared
with αX , let n , and n , denote the numbers of cells contained in S , and S , , respectively
[8]
.
In next step threshold will be calculated according to block diagram in Figure (1) then
compare with cell under test (CUT) to make decision.
Fig .(1). Block diagram of (IS-CFAR)
As described earlier, non-homogeneities are the main problem of CFAR detection. In
CFAR detection, two kinds of non-homogeneities, i.e. interfering targets and clutter-edge are
considered. Interfering targets are strong signals related to targets appeared in reference cells
and cause an incorrect estimation of the level of the noise in CFAR processor and so decrease
the probability of detection. Clutter-edge is the situation in which power of the clutter in
reference cells changes from one level to another level, instantaneously. Also, it causes an
incorrect estimation of the level of the noise and changes the probability of false alarm [6]
.
X0
XK, A<αX0 XK,B<αZ0
Square law
detector
Leading Window A Lagging Window B
I Q
Decision
K=1, 2, …………., N/2 K=1, 2, ……, N/2
CUT](https://image.slidesharecdn.com/improving-210927205204/85/Improving-of-is-cfar-using-wavelet-de-noising-for-smoothing-the-noise-in-reference-cells-3-320.jpg)
![Journal of Engineering and Development, Vol. 18, No.1, January 2014, ISSN 1813- 7822
167
In this paper a new tool of CFAR detector to reduce the non-homogenous effect on
probability of detection and to reduce clutter wall effect.
To plot probability of detection in non-homogenous environment the equation (1) will
used, probability of detection in homogenous environment is obtained by set M = 0 & M =
0 & σ = 0. The probability of false alarm is obtained by set M = 0 & M = 0 & σ =
0 & σ = 0 [8]
.
= ∑ ∑ ∑ ∑ ( )
⁄
,
( ⁄ )
,
×
( , , )
,
( , , )
,
,
,
∑ ∑
( )
( )
+ ∑ ∑ ∑ ∑ ( )
⁄
,
( )
⁄
,
×
( , , )
,
( , , )
,
⁄
,
⁄
,
∑ ∑
( )
( )
+ ∑ ∑ ∑ ∑ ( )
⁄
,
( )
⁄
,
×
( , , )
,
( , , )
,
⁄
,
,
∑ ∑ ∑ ∑
( ) , ,
( )
,
,
+ ∑ ∑ ∑ ∑ ( )
⁄
,
( )
⁄
,
×
( , , )
,
( , , )
,
,
⁄
,
∑ ∑ ∑ ∑
( ) , ,
( )
,
,
....….. (1)
Where W1, W2, W3 and W4 is obtained from equations (2), (3), (4) and (5).
=
( ) ( )
− ( ) ( )
………….… (2)
=
( ) ( )
− ( ) ( )
..……………. .(3)
=
⁄
( )
⁄
( )
− ( ) ( )
……………. (4)
=
⁄
( )
⁄
( )
− ( ) ( )
… … . . … … …. (5)
To determine W1, W2, W3 and W4 ρ , ρ , ρ and ρ must calculate from following equations.
= = − − + + + ………….………… (6)](https://image.slidesharecdn.com/improving-210927205204/85/Improving-of-is-cfar-using-wavelet-de-noising-for-smoothing-the-noise-in-reference-cells-4-320.jpg)
![Journal of Engineering and Development, Vol. 18, No.1, January 2014, ISSN 1813- 7822
168
= = + − ( + ) − ( , + , ) + + + +
( ) ( )
……………………………....…….. (7)
= − ( − + + ) ..……………………………………….. (8)
= − ( + ) …………………………………………. (9)
=
⁄
− ( ⁄ − , + + ) ……….. ………………………...…….. (10)
=
⁄
⁄ − , + + …………………………...….………… (11)
, = ( , , − + ) ……..……………………..………….. (12)
, = ( , , − + ) ……………………………………...…. (13)
= + ……………………….……………… (14)
= , + , ...……………………………………… (15)
= + ………………………………….…….. (16)
Where ζ, ε, ψ and φ must be greater than zero and the negative number is neglected,
n , , n , , m, n, d, c, b, f is counters of sum.
σ : Signal to noise ratio
σ : Interference to noise ratio
N : Threshold integer
M : Number of interference target in leading window A
M : Number of interference target in leading window B
n , : Number of reference cells stored in S ,
n , : Number of reference cells stored in S ,
3. Improving IS-CFAR using wavelet de-noising (I2
S-CFAR)
Wavelet shrinkage is discovered by Donoho and Johnstone to remove the noise that
comes from weather.
Wavelet de-noising block put on input Y for estimation of probability of detection for
given Pfa using wavelet de-noising and before square law detector on [I & Q]. First operator
in de-noising block is discrete wavelet decomposition. The wavelet family, which is used in
this algorithm, can be selected from Symlet, Coiflet, Daubechies or other families. The
second operator is to choose the threshold of de-noising which shrinks wavelet coefficients,
there is classified in to two main types hard and soft threshold. We used soft threshold that
classified to this types Universal threshold, Stein's Unbiased Risk Estimation (SURE) and
Block threshold (BT).](https://image.slidesharecdn.com/improving-210927205204/85/Improving-of-is-cfar-using-wavelet-de-noising-for-smoothing-the-noise-in-reference-cells-5-320.jpg)

![Journal of Engineering and Development, Vol. 18, No.1, January 2014, ISSN 1813- 7822
170
Fig .(3) I2
S-CFAR Block diagram
4. Estimation of Probability of Detection Algorithm for given PFA
using Wavelet de-noising
4.1. Step -1-
The value of all CFAR parameters can be calculated from the basic criteria of IS-CFAR.
Probability of false alarm, alpha and substitute vector from Beta values are assumed to
calculate the value of Beta in order to draw curve between Beta and probability of false alarm.
Varying values of in the range [14, 26], and using equation (1) for IS-CFAR, we
obtained the curve which relates the two parameters. The required values of are Extracted
according to the correspondence values of [10 , 10 ] from the probability of false
alarm curve.
4.2. Step -2-
In this step a simulation is made using trial and error program to obtain the values of
which corresponds to the obtained value of from step -1-.](https://image.slidesharecdn.com/improving-210927205204/85/Improving-of-is-cfar-using-wavelet-de-noising-for-smoothing-the-noise-in-reference-cells-7-320.jpg)
![Journal of Engineering and Development, Vol. 18, No.1, January 2014, ISSN 1813- 7822
171
The reference cells will occupied by White Addition Gaussian Noise (AWGN) which
contain real named I channel and imaginary part named Q channel, while the distribution of
signal in cut will be exponential distribution for swerling II or chi-square for swerling III with
noise power. The number of iteration equal to 1⁄ .
Every row in array acts as a reference window and the threshold (Thr) can be determined
for every row by applying the IS-CFAR statistic to get (I2
S-CFAR) and compare it with cell
under test (CUT) (X0) if cell under test (CUT) is more than threshold choose hypothesis H1
and if else choose hypothesis H0.
≶ ……………………………….…………...………………….………..... (17)
The summation hypothesis H1 is found for all iterations and divide the summation on
number of iteration to get the probability of false alarm.
The obtained result contain values of = 0, which were eliminated, and the rest value
of which correspond to required value [10 , 10 ] were found for a range of , which
are equal to calculated from step -1- or less.
4.3. Step -3-
In this step the wavelet block is combined with the IS-CFAR block. The input noise is
taken from step -2- limited for the part of calculated from step -1- or less.
The noise array is entered to de-noising block to subtract its output from the original
signal. Now every row in the result from subtracting acts as a CFAR window.
The threshold (Thr) can be determined for every row by applying the IS-CFAR statistic
to get (I2
S-CFAR) and to be compared with cell under test (CUT) (X0). If cell under test
(CUT) is more than threshold choosing hypothesis H1, and if none choose hypothesis H0.
The summation hypothesis H1 is found for all iterations and the summation is divided on
number of iterations to get the probability of false alarm.
The results of simulation give a new range of with respect to the required value of .
In correspondence with step -2-, the max value of is taken.](https://image.slidesharecdn.com/improving-210927205204/85/Improving-of-is-cfar-using-wavelet-de-noising-for-smoothing-the-noise-in-reference-cells-8-320.jpg)


![Journal of Engineering and Development, Vol. 18, No.1, January 2014, ISSN 1813- 7822
175
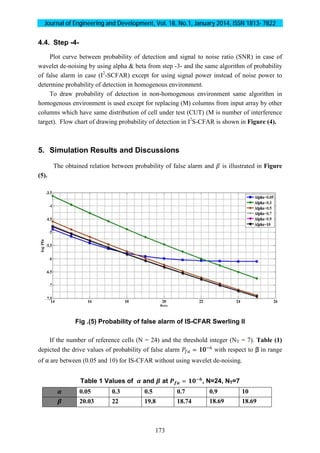
Fig .(7) Comparison of detection characteristics in Homogenous Environment
From Figure (7), the probability of detection is equal to the range [0.5, 0.7] when the
signal to noise ratio (SNR) in the range [14dB, 17dB] at = 10 and optimum alpha for
I2
S-CFAR. The probability of detection is equal to the range [0.5, 0.7] when the signal to
noise ratio (SNR) in the range [14.8dB, 17.75dB] for IS-CFAR.
It shows that IS-CFAR and I2
S-CFAR have nearly same performance in homogeneous
scenario.
Figure (8) show the probability of detection curves are plotted for IS-CFAR and I2
S-
CFAR at = 10 in Non-Homogenous Environment, threshold integer (NT=7), optimum
alpha for I2
S-CFAR ( =0.9), scale factor for IS-CFAR ( =0.05), and (one interference
target in leading window (A) and two interference target in lagging window (B) (M =
1 & M = 2)).
Fig .(8). Comparison of detection characteristics in Non-Homogenous
Environment](https://image.slidesharecdn.com/improving-210927205204/85/Improving-of-is-cfar-using-wavelet-de-noising-for-smoothing-the-noise-in-reference-cells-12-320.jpg)
![Journal of Engineering and Development, Vol. 18, No.1, January 2014, ISSN 1813- 7822
176
From Figure (8), the probability of detection is equal to the range [0.5, 0.7] when the
signal to noise ratio (SNR) in the range [13.8dB, 16.6dB] at = 10 , (no interference
target in leading window (A) and one interference target in lagging window (B) ( =
0 & = 1)) and optimum alpha for I2
S-CFAR. The probability of detection is equal to the
range [0.5, 0.7] when the signal to noise ratio (SNR) in the range [16.41dB, 19.41dB] for IS-
CFAR.
Figure (9) show detection characteristics in clutter wall on this performance alpha (
=0.05) for IS-CFAR, threshold integer (NT=7), optimum alpha for I2
S-CFAR ( =0.9) signal
to noise ratio (SNR = 15dB) and clutter to noise ratio (CNR = 10dB).
Fig .(9) Comparison of detection characteristics in clutter wall
As shown from Figure (9) a less degradation is noticed, the range of probability of
detection fluctuation is kept in certain range about (0.575-0.42) for = 10 from before
clutter wall to after it for I2
S-CFAR as a compared with IS-CFAR that has the range of
probability of detection fluctuation about (0.525-0.01).
The variation of slope curve in Figure (9) when the number of reference cells equal
(N/2), is due to that the clutter to noise ratio enters to the cell under test (CUT)
The degradation in probability of detection can be attributed to a masking effect by the
clutter region before the clutter wall. The decrease in probability of detection after the clutter
wall can be accounted by the clutter to noise ratio (CNR).](https://image.slidesharecdn.com/improving-210927205204/85/Improving-of-is-cfar-using-wavelet-de-noising-for-smoothing-the-noise-in-reference-cells-13-320.jpg)
![Journal of Engineering and Development, Vol. 18, No.1, January 2014, ISSN 1813- 7822
177
6. Conclusions
1. For homogenous case using wavelet de-noising for IS-CFAR with given probability of
false alarm, I2
S-CFAR1, P = 10 and swerling case II to ensure the probability of
detection is equal to the range [0.5, 0.7] when the signal to noise ratio (SNR) in the range
[14dB, 17dB]. With respect to IS-CFAR without using wavelet de-noising the probability
of detection is equal to the range [0.5, 0.7] when the signal to noise ratio (SNR) in the
range [14.8dB, 17.75dB].
2. for non-homogenous case using wavelet de-noising for IS-CFAR with given probability
of false alarm, I2
S-CFAR, P = 10 and swerling case II to ensure the probability of
detection is equal to the range [0.5, 0.7] when the signal to noise ratio (SNR) in the range
[13.8dB, 16.6dB] at (M=3). With respect to IS-CFAR without using wavelet de-noising
the probability of detection is equal to the range [0.5, 0.7] when the signal to noise ratio
(SNR) in the range [16.41.6dB, 19.41dB] at (M=3).
3. For clutter wall case Improving IS-CFAR using wavelet de-noising for I2
S-CFAR SWII,
P = 10 , SNR=15dB, CNR=10dB, the range of probability of detection fluctuation is
kept in certain range about (0.575-0.42) for from before clutter wall to after it but for
Improving IS-CFAR without using wavelet de-noising the range of probability of
detection fluctuation influence a large degradation in certain range about (0.525-0.01) for
from before clutter wall to after it.
4. Implementation of wavelet to improve IS-CFAR has disadvantages related with increase
complexity of circuit and increase time processing.
7. References
1. James J. Jen "A Study of CFAR Implementation Cost and Performance
Tradeoffs in Heterogeneous Environments", A master Thesis Presented to the
Faculty of California State Polytechnic University, Pomona, 2011.
2. M. B. El Mashade " Analysis of CFAR Detection of Fluctuating Targets"
Electrical Engineering Department Faculty of Engineering Al Azhar University
Nasr City, Cairo, Egypt Progress In Electromagnetics Research C, Vol. 2, 65–94,
2008.
3. Gandhi, P.P., Kassam, S.A.: “Analysis of CFAR Processors in Non-Homogenous
Background”, IEEE Transactions on Aerospace and Electronic Systems, Vol.24,
No.4, pp. 427-445, July 1988. .(IVSL)
4. G.A. Lampropoulosa, G. Giglia, A. ajjb and M. Rey "A New Adaptive Coherent
CFAR Wavelet Detector" SPIE 1St. Clair Avenue West, Suite 1103 Toronto,
Ontario, CANADA Vol. 3491 pp.1010-1016 1998.](https://image.slidesharecdn.com/improving-210927205204/85/Improving-of-is-cfar-using-wavelet-de-noising-for-smoothing-the-noise-in-reference-cells-14-320.jpg)