This paper presents a secure image encryption algorithm utilizing a 6D chaotic logistic map based on image density to encrypt gray and color images. The proposed encryption method involves calculating image density, utilizing chaos theory for key generation, and applying an XOR operation for encryption, resulting in high performance metrics such as a peak signal-to-noise ratio (PSNR) of 7.7268 and a pixel change rate (NPCR) of 100%. The method demonstrates significant advancements in secure image transmission, particularly against various cryptanalytic attacks.
![International Journal of Electrical and Computer Engineering (IJECE)
Vol. 13, No. 2, April 2023, pp. 1903~1913
ISSN: 2088-8708, DOI: 10.11591/ijece.v13i2.pp1903-1913 1903
Journal homepage: http://ijece.iaescore.com
Image encryption algorithm based on the density and 6D
logistic map
Abdullah A. Rashid, Khalid Ali Hussein
Department of Computer Science, College of Education, Al-Mustansiriyah University, Baghdad, Iraq
Article Info ABSTRACT
Article history:
Received Jun 3, 2022
Revised Sep 27, 2022
Accepted Oct 24, 2022
One of the most difficult issues in the history of communication technology
is the transmission of secure images. On the internet, photos are used and
shared by millions of individuals for both private and business reasons.
Utilizing encryption methods to change the original image into an
unintelligible or scrambled version is one way to achieve safe image transfer
over the network. Cryptographic approaches based on chaotic logistic theory
provide several new and promising options for developing secure Image
encryption methods. The main aim of this paper is to build a secure system
for encrypting gray and color images. The proposed system consists of two
stages, the first stage is the encryption process, in which the keys are
generated depending on the chaotic logistic with the image density to
encrypt the gray and color images, and the second stage is the decryption,
which is the opposite of the encryption process to obtain the original image.
The proposed method has been tested on two standard gray and color images
publicly available. The test results indicate to the highest value of peak
signal-to-noise ratio (PSNR), unified average changing intensity (UACI),
number of pixel change rate (NPCR) are 7.7268, 50.2011 and 100,
respectively. While the encryption and decryption speed up to 0.6319 and
0.5305 second respectively.
Keywords:
Chaotic
Density
Image encryption
Logistic map
This is an open access article under the CC BY-SA license.
Corresponding Author:
Abdullah A. Rashid
Department of Computer Science, College of Education, Al-Mustansiriyah University
Baghdad/Adhamiya, Iraq
Email: abdullah.adil@ihcoedu.uobaghdad.edu.iq
1. INTRODUCTION
Information such as photographs, data, documents, speech, and videos may now be sent in seconds
thanks to technological advancements. Because this information is transferred via a single frequency band, it
may pose a security risk to the end user’s data [1], [2]. Images are important in a variety of industries,
including information exchange, authorization, Google maps, satellite, medical, and military applications.
The most critical challenge becomes protecting these photographs from unauthorized users. One technique to
protect data from being hacked is to encrypt it [1], [3]. Cryptography is a method of storing and transferring
data in a validated format so that only a single intended client can read and process it [4], [5]. Confidentiality,
authenticity, integrity, and non-repudiation are all provided [3], [5]. Text encryption is not the same as image
encryption [6]. Traditional encryption algorithms such as advanced encryption standard (AES), and others
are not suitable for multimedia files due to their enormous data capacity, significant pixel correlation, and
high redundancy [7], [8]. In 1963, Edward Lorenz became the first person to apply chaos theory to a
computer system [4]. Because of the unauthorized person's noise-like signal, ergodicity, mixing, and
sensitivity to the initial conditions, chaos-based cryptography has gotten a lot of attention in the recent
decade. These properties may be linked to those of excellent ciphers, such as confusion and diffusion [6], [9].](https://image.slidesharecdn.com/v6729106emr27sep223jun22n-230124070834-3288fe3b/85/Image-encryption-algorithm-based-on-the-density-and-6D-logistic-map-1-320.jpg)
![International Journal of Electrical and Computer Engineering (IJECE)
Vol. 13, No. 2, April 2023, pp. 1903~1913
ISSN: 2088-8708, DOI: 10.11591/ijece.v13i2.pp1903-1913 1903
Journal homepage: http://ijece.iaescore.com
Image encryption algorithm based on the density and 6D
logistic map
Abdullah A. Rashid, Khalid Ali Hussein
Department of Computer Science, College of Education, Al-Mustansiriyah University, Baghdad, Iraq
Article Info ABSTRACT
Article history:
Received Jun 3, 2022
Revised Sep 27, 2022
Accepted Oct 24, 2022
One of the most difficult issues in the history of communication technology
is the transmission of secure images. On the internet, photos are used and
shared by millions of individuals for both private and business reasons.
Utilizing encryption methods to change the original image into an
unintelligible or scrambled version is one way to achieve safe image transfer
over the network. Cryptographic approaches based on chaotic logistic theory
provide several new and promising options for developing secure Image
encryption methods. The main aim of this paper is to build a secure system
for encrypting gray and color images. The proposed system consists of two
stages, the first stage is the encryption process, in which the keys are
generated depending on the chaotic logistic with the image density to
encrypt the gray and color images, and the second stage is the decryption,
which is the opposite of the encryption process to obtain the original image.
The proposed method has been tested on two standard gray and color images
publicly available. The test results indicate to the highest value of peak
signal-to-noise ratio (PSNR), unified average changing intensity (UACI),
number of pixel change rate (NPCR) are 7.7268, 50.2011 and 100,
respectively. While the encryption and decryption speed up to 0.6319 and
0.5305 second respectively.
Keywords:
Chaotic
Density
Image encryption
Logistic map
This is an open access article under the CC BY-SA license.
Corresponding Author:
Abdullah A. Rashid
Department of Computer Science, College of Education, Al-Mustansiriyah University
Baghdad/Adhamiya, Iraq
Email: abdullah.adil@ihcoedu.uobaghdad.edu.iq
1. INTRODUCTION
Information such as photographs, data, documents, speech, and videos may now be sent in seconds
thanks to technological advancements. Because this information is transferred via a single frequency band, it
may pose a security risk to the end user’s data [1], [2]. Images are important in a variety of industries,
including information exchange, authorization, Google maps, satellite, medical, and military applications.
The most critical challenge becomes protecting these photographs from unauthorized users. One technique to
protect data from being hacked is to encrypt it [1], [3]. Cryptography is a method of storing and transferring
data in a validated format so that only a single intended client can read and process it [4], [5]. Confidentiality,
authenticity, integrity, and non-repudiation are all provided [3], [5]. Text encryption is not the same as image
encryption [6]. Traditional encryption algorithms such as advanced encryption standard (AES), and others
are not suitable for multimedia files due to their enormous data capacity, significant pixel correlation, and
high redundancy [7], [8]. In 1963, Edward Lorenz became the first person to apply chaos theory to a
computer system [4]. Because of the unauthorized person's noise-like signal, ergodicity, mixing, and
sensitivity to the initial conditions, chaos-based cryptography has gotten a lot of attention in the recent
decade. These properties may be linked to those of excellent ciphers, such as confusion and diffusion [6], [9].](https://image.slidesharecdn.com/v6729106emr27sep223jun22n-230124070834-3288fe3b/75/Image-encryption-algorithm-based-on-the-density-and-6D-logistic-map-1-2048.jpg)
![ ISSN: 2088-8708
Int J Elec & Comp Eng, Vol. 13, No. 2, April 2023: 1903-1913
1904
Many picture encryption techniques based on chaotic systems have been presented in the field of information
security research [3], [10]. Many picture encryption methods have been developed based on chaotic maps,
such as the Logistic map [11]. Cryptanalytic attacks are significantly less effective on higher-dimensional
chaotic functions [4], [12]. The main problem that may face the process of sending data such as images, texts,
and other types of data is that it is exposed to many strong attacks, so we need to protect and preserve data by
encrypting it. This paper presents an efficient and robust method for encrypting gray and color images based
on chaotic logistic 6D with image density to generate key and encrypted images using exclusive OR (XOR)
operation.
The remaining sections of the paper are organized as follows: section 2 focuses on related work.
Section 3 explains the proposed system. Section 4 displays the results and discussion. Section 5 displays the
National Institute of Standards and Technology (NIST) randomness test. Section 6 gives the conclusion.
2. RELATED WORK
The researchers focus on the chaotic systems of image encoding and decoding processes. Shahna
and Mohamed [13] proposed a method to encrypt a grayscale image using the Z-order curve and logistic
map. The key stream formed by this approach is influenced by the chaotic map. The original image is
scrambled using the Z-order curve. The jumbled image is then encrypted using the random matrix provided
by the logistic map. Entropy has the highest value of 7.9972, while unified average changing intensity
(UACI) and number of pixel change rate (NPCR) have the highest values of 33.5124% and 99.6713%,
respectively. It takes 0.52619 seconds to encrypt an image. Li et al. [14] A novel chaotic map is presented,
which is based on a real-time variable logistic map with a randomly chosen decimal. This chaotic mapping is
used to encrypt images. Several simulations indicate that the novel encryption technique may produce a
securely encrypted image with low time complexity. The greatest value of entropy is 7.9979, while the
highest values of UACI and NPCR are 33.47 percent and 99.62%, respectively. While encryption speed is
0.0386 (second). Elmanfaloty and Abou-Bakr [15] suggest a 1D chaotic function with five control parameters
as a solution for addressing the issue of a restricted number of control parameters. The function's chaotic
qualities and capacity to create a cryptographically safe random stream of integers are revealed via analysis.
To demonstrate its resilience, a novel picture encryption technique is developed that uses the function as its
random number generator. Several tests of the proposed system show that it is secure and has strong
confusion-diffusion capabilities. The greatest entropy value was 7.902073, while the highest UACI and
NPCR values were 33.5088% and 99.5994%, respectively. The encryption speed was 1.4598 (second).
Patel et al. [3] for confusion and dispersion of picture pixels, a 3D chaotic logistic map with
deoxyribonucleic acid (DNA) encoding is suggested. In addition, the 3D chaotic logistic map is initialized
with three symmetric keys, making the encryption technique robust. The random pixels are diffused using
DNA encoding, followed by an XOR logical operation between the DNA encoded input image and the key
image. The suggested system provides NPCR 99.6994% and UACI 31.5592%, while the entropy value is
7.9996. Oravec et al. [16] proposed a plaintext-related picture encryption technique that changes the
parameter values of the logistic map in response to pixel intensities in the plain image. Row by row, the
parameter values are changed, allowing the same encryption and decryption technique to be used. The
parameter modification technique takes into consideration prior knowledge of the logistic map, its fixed
points, and any periodic cycles. Because the resultant interval of parameter values contains large positive
Lyapunov exponents, the logistic map's chaotic character should be clear. The test results indicate the highest
values of UACI and NPCR being 33.4857% and 99.6143%, respectively. Kumar and Gupta [17] proposed an
innovative and safe medical picture encryption system using a 1-dimensional logistic map and pseudo-
random integers. The logistic map's initial values and parameters are used to generate key metrics for
shuffling and replacing pixels in the picture (as secret keys). The encryption process's number of rounds can
be raised or lowered. To counter known plain-image assaults, two pseudo-random rows and two pseudo-
random columns were constructed on each side of the original picture during the encryption method. For the
chosen images, the average entropy and NPCR of encrypted pictures were 7.99 and 99.6%, respectively.
3. PROPOSED METHOD
The main objective of this procedure is to secure images using a new encryption technique based on
using density and a 6D chaotic logistics map. The new 6D logistics map is generated based on the image
density value, which overcomes the logistic insecurity weakness, and the image is encrypted using the
resulting map in addition to a master encryption key. Figure 1 shown the stages of the proposed system as
described below:](https://image.slidesharecdn.com/v6729106emr27sep223jun22n-230124070834-3288fe3b/85/Image-encryption-algorithm-based-on-the-density-and-6D-logistic-map-2-320.jpg)
![Int J Elec & Comp Eng ISSN: 2088-8708
Image encryption algorithm based on the density and 6D logistic map (Abdullah A. Rashid)
1905
Figure 1. A block diagram illustrating the steps of the proposed method
3.1. Encryption image stage
The important stage in the proposed system is encryption stage. It is divided into five steps. These
steps are described in the following:
Step 1: Image density calculation
The (1) was used to compute the density of the original image [18]:
𝐷 =
∑ ∑ 𝑖𝑚𝑎𝑔𝑒(𝑥,𝑦)
𝑀
𝑦=0
𝑁
𝑥=0
𝑁∗𝑀
(1)
where D, N and M represent the density, width and height of the image, while image (x, y) represents the
image pixel value for points x and y.
Step 2: 6D logistic chaotic map
The logistic map is the simplest process of chaos generation given by (2).
𝑥𝑖+1 = 𝑟 𝑥𝑖(1 − 𝑥𝑖) (2)
The requirement to make this equation chaotic is 0 < 𝑥𝑖 < 1 and 𝑟 = 4 [19]. Liu et al. [20] suggest
a 2D logistics map using quadratic coupling to enhance security. Hossain et al. [4] suggest a 3D logistics map
using quadratic-cubic coupling for added safety. The extended 6D version is suggested by (2) to (7).
𝑥𝑖+1 = axi(1 − xi) + Bki
2
xi + Yfi
3
+ Qhi
4
xi + Pzi
5
+ Tyi
6
xi (2)
yi+1 = ayi(1 − yi) + Bxi
2
yi + Yki
3
+ Qfi
4
yi + Phi
5
+ Tzi
6
yi (3)
zi+1 = azi(1 − zi) + Byi
2
zi + Yxi
3
+ Qki
4
zi + Pfi
5
+ Thi
6
zi (4)
hi+1 = ahi(1 − hi) + Bzi
2
hi + Yyi
3
+ Qxi
4
hi + Pki
5
+ Tfi
6
hi (5)
fi+1 = afi(1 − fi) + Bhi
2
fi + Yzi
3
+ Qyi
4
fi + Pxi
5
+ Tki
6
fi (6)
ki+1 = aki(1 − ki) + Bfi
2
ki + Yhi
3
+ Qzi
4
ki + Pyi
5
+ Txi
6
ki (7)
The chaotic behavior in the preceding equations may be seen here in 3.57<a<4, 0<B<0. 14*10-11
,
0<Y<0.045*10-11
, 0<Q<0.061*10-11
, 0<P<0.012*10-11
, 0<T<0.0021*10-11
, and the starting value of x, y, z, h,
f, and k between 0 and 1. The presence of hexagonal quadratic coupling and six constant terms complicates
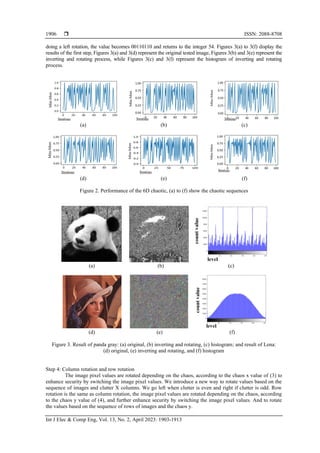
and secures the 6D logistic map. Figure 2 shown the performance of the proposed chaotic sequences, while
Figures 2 (a) to (f) shown the chaotic sequences formed using the (3) to (8) and a starting value of
x(1)=0.01+1/D; y(1)=0.02+5/D; z(1)=0.03+10/D; h(1)=0.04+15/D; f(1)=0.05+20/D; k(1)=0.06+25/D; a=4;
B=1/D+0.135*10-11
; Y=0.1262*10-11
; Q=0.1573*10-11
; P=0.1384*10-11
; T=5/D+0.1695*10-11
, and the
number of iterations is 100.
Step 3: Reverse image bits and rotate left
Firstly, an algorithm used to invert the image bits and rotate it to the left in one-bit increments to
improve the method's security, which make it have a good anti-noise attack. This step is shown as example:
we have the value 216 as it is converted to binary value 11011000, the bits are inverted to get 00011011, after](https://image.slidesharecdn.com/v6729106emr27sep223jun22n-230124070834-3288fe3b/85/Image-encryption-algorithm-based-on-the-density-and-6D-logistic-map-3-320.jpg)
![Int J Elec & Comp Eng ISSN: 2088-8708
Image encryption algorithm based on the density and 6D logistic map (Abdullah A. Rashid)
1907
Step 5: XOR operation
The XOR technique is the final step in the encryption process. The XOR operation changes the
value of a pixel to a new value and cannot be reversed without knowing the chaos key [21]. In the beginning,
four of the chaos values Z, H, F, and K are generated, and the image was divided into three matrices: R, G,
and B. The XOR operation was performed between the chaos value Z and the R matrix with the master key
after performing the XOR operation with the chaos value K. And perform an XOR operation between the
value of the chaos H with the G matrix and make an XOR for the resulting value with the value of the R
matrix. Finally, perform an XOR operation between the chaos value of F with the B matrix, and XOR the
resulting value with the G matrix value. By repeating these operations on all the pixels of the image, we get
encrypted images. Algorithm 1 explains the steps of the proposed system.
Algorithm 1. The proposed image encryption system
Encryption Algorithm Decryption Algorithm
Input: image, Initial (a, B, Y, Q, P, T,
x, y, z, h, f, k), key
Output: image encryption
Step1: Density Calculation
Density = 0; i = 0
For all x, y Do {where 0≤ x≤ M, 0≤ y≤ N}
Density = Density + image [x][y]
End For// N, M
Density = (Density/M*N)
key = Key Density
Step2: Generate Logistics Chaos Keys
Logis6D = Generate
(a,B,Y,Q,P,T,x,y,z,h,f,k,Density)
Step3: Reverse Image Bits and Rotate Left
revImg = Reverse(image)
rotLImg = RotateLeft(revImg)
Step4: Column and Row Rotation
rotCImg = ColumnRotation (rotLImg,
Logis6D.x)
rotRImg = RowRotation (rotCImg,
Logis6D.y)
Step5: XOR Operation
For all x, y Do {where 0≤ x≤ M, 0≤ y≤ N}
key = key Logis6D.k[i]
R = rotRImg [x][y][0] Mod
(Logis6D.z[i] key,256)
G = rotRImg [x][y][1] Mod
(Logis6D.h[i] R, 256)
B = rotRImg [x][y][2] Mod
(Logis6D.f[i] G, 256)
Image_encryptio [x][y] = newRGB
(R, G, B); i = i + 1
End For// N, M
Input: image, Initial (a,B,Y, Q, P, T, x, y,
z, h, f, k), key,
Density
Output: image decryption.
Step1: Key Calculation
key = Key Density
Step2: Generate Logistics Chaos Keys
Logis6D =
Generate(a,B,Y,Q,P,T,x,y,z,h,f,k,Density)
Step3: XOR Operation
i = 0
For all x, y Do {where 0≤ x≤ M, 0≤ y≤ N}
key = key Logis6D.k[i]
OR = image[x][y][0]
R = OR Mod (Logis6D.z[i] key,
256)
OG = image [x][y][1]
G = OG Mod (Logis6D.h[i] OR, 256)
OB = image [x][y][2]
B = OB Mod (Logis6D.f[i] OG, 256)
nImage [x][y]= newRGB (R, G, B); i=i+1
End For// N, M
Step4: Reverse Row and Column Rotation
rotRImg = RowRotation (nImage, Logis6D.y)
rotCImg = ColumnRotation (rotRImg,
Logis6D.x)
Step5: Reverse Image Bits and Rotate Left
rotLImg = RotateLeft(rotCImg)
image_decryption = Reverse(rotLImg)
4. RESULTS AND DISCUSSION
Experiments with the suggested approach were carried out on a machine with a 3.30 GHz CPU and
16 GB of RAM, which was running GO language at Windows 11 Home, 64-bit. Figure 3 displays the tested
images utilized in experiments [22]. All of these images have a 512×512-pixel resolution. Color depths of up
to 24 bits per pixel are used in the Lena image; color depths of up to 8 bits per pixel are used in the panda gray
image. The proposed system is tested for ten images from the dataset (i.e., all dataset images), but this work only
shows the results of two images as described in Figure 4 displays the test images for Lena and gray panda.
Lena panda gray
Figure 4. A set of experimental images](https://image.slidesharecdn.com/v6729106emr27sep223jun22n-230124070834-3288fe3b/85/Image-encryption-algorithm-based-on-the-density-and-6D-logistic-map-5-320.jpg)
![ ISSN: 2088-8708
Int J Elec & Comp Eng, Vol. 13, No. 2, April 2023: 1903-1913
1908
The following criteria are utilized to measure the performance of the presented cryptosystem.
− Histogram
One criteria used in the proposed system is histogram. The image histogram displays the number of
pixels (along the y axis) at each intensity level (along the x-axis) to demonstrate how the pixels are
distributed in the image [12], [23]. A successful image coding system should provide all encoded images
with a uniform image outline, regardless of the original planar image structure [23], [24].
− Mean square error (MSE) and peak signal to noise ratio (PSNR)
The difference between the input and output images in terms of pixel intensity levels is measured
using MSE. The MSE value is higher [15] for an ideal fully encrypted cipher image. The MSE is computed
using (9).
𝑀𝑆𝐸 =
1
𝑀 𝑥 𝑁
∑ ∑ [𝐶1(𝑖, 𝑗) − 𝐶2 (𝑖, 𝑗)]2
𝑀−1
𝑗=0
𝑁−1
𝑖=0 . ((9)
where M, N is the width and height of images and C1 is the original image and C2 is the cipher image. PSNR
analysis The PSNR reflects the encryption quality. The lower value of PSNR is the better encryption quality
[15], [25],[26].
𝑃𝑆𝑁𝑅 = 20 x log10 (
255
𝑆𝑞𝑟𝑡 (𝑀𝑆𝐸)
). (10)
− NPCR and UACI
NPCR value tells the rate of change of a number of pixels in an encrypted image when a pixel of the
original image is changed [11], [16]. The highest value is the better in the encryption [25], [27], NPCR of an
image can be defined as (11).
𝐷(𝑖, 𝑗) = {
1, 𝐶1 (𝑖, 𝑗) ≠ 𝐶2(𝑖, 𝑗)
0, 𝐶1 (𝑖, 𝑗) = 𝐶2(𝑖, 𝑗)
𝑁𝑃𝐶𝑅 =
∑ 𝐷(𝑖,𝑗)
𝑖,𝑗
𝑀∗𝑁
∗ 100%. (11)
UACI value calculates the average intensity of differences between the original image and the
encrypted image [11], [25]. The highest value is the better in the encryption [25], UACI of an image can be
defined as (12).
𝑈𝐴𝐶𝐼 =
1
𝑀∗𝑁
[∑
|𝐶1(𝑖,𝑗)− 𝐶2(𝑖,𝑗)|
15
𝑖,𝑗 ] ∗ 100 %. (12)
− Entropy analysis
The entropy (H) of a symbol source (S) can be calculated by (13) [4].
𝐻(𝑠) = − ∑ 𝑃(𝑠𝑖) log2
1
𝑃(𝑠𝑖)
𝑀−1
𝑖=0 . (13)
where (Si) is the chance that a pixel will appear in an image, and N is the length of a pixel's binary number
(typically N=8 for a gray image). The cryptosystem's ability to withstand entropy assaults is one of its most
essential features; the optimal entropy value of encrypted pictures is 8 bits/pixel [2].
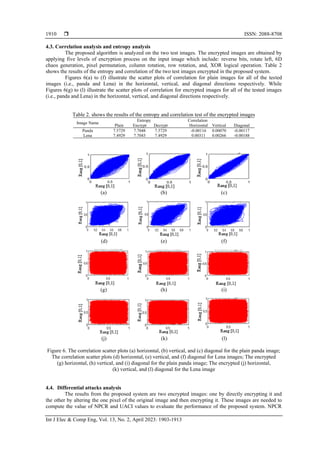
− Correlation coefficient analysis
The correlation coefficient of a visible image with correct brightness is one, but it is much lower for
a ciphered image (almost equal to zero). An encryption technique produces ciphered images with randomly
dispersed pixels of various brightness and a low correlation coefficient between neighboring pixels [3], [15],
[28]. The correlation coefficient of any two-pixel color values at the same place in the original and cipher
pictures is calculated using (14) [2].
𝐶𝑜𝑟𝑟(𝑥, 𝑦) =
𝐸[(𝑥−𝜇𝑥)(𝑦− 𝜇𝑦)]
𝜎𝑥 𝜎𝑦
. (14)
where 𝜇𝑥 and 𝜇𝑦 represent mean values of x and y, 𝜎𝑥 and 𝜎𝑦 are the standard deviations of x and y, and 𝐸
[⋅] is the expectation function [2].
4.1. Results of image encryption and decryption using 6D logistic map
A picture encryption solution should be resistant to all known forms of attacks and should not be
dependent on the plaintext or encryption key. If the encryption key is to be utilized consistently, a suitable](https://image.slidesharecdn.com/v6729106emr27sep223jun22n-230124070834-3288fe3b/85/Image-encryption-algorithm-based-on-the-density-and-6D-logistic-map-6-320.jpg)
![Int J Elec & Comp Eng ISSN: 2088-8708
Image encryption algorithm based on the density and 6D logistic map (Abdullah A. Rashid)
1909
picture encryption algorithm should be able to encrypt any plain text image into a randomly generated
ciphertext [12]. The suggested picture encryption approach is put to the test in this part utilizing a six-
dimensional logistics map and security analysis. Figures 5(a) to (f) show the results of encryption after
applying the inverting and rotating of the bits, encryption and decryption for the tested images (i.e., panda
and Lena), respectively, while Figures 5(g) to (l) show histogram analysis of applying the inverting and
rotating of the bits, encryption and decryption for the tested images (i.e., panda and Lena), respectively.
(a) (b) (c)
(d) (e) (f)
(g) (h) (i)
(j) (k) (l)
Figure 5. Results of encryption stage of panda gray: (a) inverting, (b) encryption, and (c) decryption; Results
of encryption stage of Lena: (d) inverting, (e) encryption, and (f) decryption; Histogram of the tested images
(panda gray): (g) inverting, (h) encryption, and (i) decryption; Histogram of the tested images (Lena):
(j) inverting, (k) encryption, and (l) decryption
4.2. MSE and PSNR analysis
Table 1 shows the MSE and PSNR values of the original and encoded images of panda and Lena.
The highest value of MSE indicates a better result of encryption, while the lower value of the PSNR indicates
better encryption quality. While the value of MSE and PSNR of the decrypted stage equal to 0 and ∞
respectively.
Table 1. MSE and PSNR values for plain and cipher images of panda, Lena
Image Name
Encrypt Decrypt
MSE PSNR MSE PSNR
Panda 10731.8118 7.8241 0 ∞
Lena 10974.8954 7.7268 0 ∞](https://image.slidesharecdn.com/v6729106emr27sep223jun22n-230124070834-3288fe3b/85/Image-encryption-algorithm-based-on-the-density-and-6D-logistic-map-7-320.jpg)
![Int J Elec & Comp Eng ISSN: 2088-8708
Image encryption algorithm based on the density and 6D logistic map (Abdullah A. Rashid)
1911
and UACI values are listed in Table 3 for all tested images. All of the NPCR values are 100 percent, which
means that changing one pixel of the original image changes 100 percent of the encrypted image. All UACI
values are greater than 50.2011 percent, indicating that each pixel has been altered by a factor of more than
50.2011 percent. Because the experimental values match the theoretical values, the suggested method is
resistant to differential assaults. The reason the values of NPCR and UACI are equal to 100% and 50.2011%,
respectively is due to the change in the initial values of the logistic map variables that depend on the image
density value. Thus, we get completely different encryption keys when changing only one pixel in the image.
Table 3. NPCR and UACI values of panda, Lena
Image
Name
NPCR UACI
Panda 100 50.1374
Lena 100 50.2011
4.5. Analysis of speed
The encryption time for a cryptosystem should be as short as feasible. The time taken to implement
the suggested method for all test images is shown in Table 4. Given the proposed scheme's high level of
security, these running speeds are acceptable.
Table 4. Encryption and decryption speed test
Image Name Encryption Speed (second) Decryption Speed (second)
Panda 0.7341407 0.6250961
Lena 0.6319286 0.5305631
4.6. Comparison
Table 5 shows the performance evaluation metrics attained by our proposed method with those
given in previous studies. Also, shows the proposed method given better results than methods in the previous
studies. Thus, improved the efficiency of the proposed system.
Table 5. Comparison of the proposed method for encryption images with the previous studies
Measurements Proposed [3] [14] [15] [16] [17]
MSE 10974.8954 - - 10.984 × 10³
- -
PSNR 7.7268 - - 7.7230 - -
NPCR 100 99.6994 99.620 99.5994 99.6143 99.6166
UACI 50.2011 31.5592 33.470 33.5088 33.4857 33.4971
Entropy 7.7048 7.9996 7.9979 7.9020 7.9992 7.9994
Horizontal Correlation -0.0011 − 0.0083 0.0010 − 0.0611 −0.0019 0.0051
Vertical Correlation 0.0007 0.0003 0.0042 − 0.0083 0.0020 −0.0212
Diagonal Correlation -0.0011 − 0.0002 0.0063 0.0573 −0.0012 −0.0006
Encryption speed (second) 0.6319 - - 1.4598 - -
Decryption speed (second) 0.5305 - - - - -
5. NIST RANDOMNESS TEST
In the randomness tests, the NIST test is the most popular of all sequence randomness testing [15].
We run NIST tests in the random sequence of logistic map keys used for encryption to get the results. Table 6
shows the results of the NIST test and shows that all the generated encryption keys are random for the 16 items.
Table 6. NIST Testing for bit sequences that have a length 1000000 bits
Type of Test P-Value Status Type of Test P-Value Status
Frequency test (Monobit) 0.1109360349 Random Maurer's Universal Statistical 0.9474038661 Random
Frequency test within a Block 0.6844520627 Random Linear Complexity 0.0835948312 Random
Runs test 0.8882324080 Random Serial 0.0562166344 Random
Longest Run of Ones in a Block 0.2286732551 Random Approximate Entropy 0.1026101879 Random
Binary Matrix Rank 0.9257659124 Random Cumulative Sums (Forward) 0.1954422847 Random
Discrete Fourier Transform (Spectral) 0.7067371399 Random Cumulative Sums (Reverse) 0.1369098792 Random
Non-Overlapping Template Matching 0.6902486144 Random Random Excursions (+1) 0.1208959044 Random
Overlapping Template Matching 0.1856326458 Random Random Excursions Variant (+1) 0.1686775974 Random](https://image.slidesharecdn.com/v6729106emr27sep223jun22n-230124070834-3288fe3b/85/Image-encryption-algorithm-based-on-the-density-and-6D-logistic-map-9-320.jpg)
![ ISSN: 2088-8708
Int J Elec & Comp Eng, Vol. 13, No. 2, April 2023: 1903-1913
1912
6. CONCLUSION
In previous studies, on chaotic logistic 3D, this topic has been widely researched and handled. But
this paper presents an efficient and robust method for encrypted images based on chaotic logistic 6D with
image density to generate key and encrypted images using XOR operation. The proposed system has been
tested on all types of images and of different sizes. The experimental results show that the highest value is
obtained when PSNR is 7.7268, UACI and NPCR are 50.2011 and 100 respectively. according to the testing
data. We can infer that our algorithm has a good level of security and can effectively withstand a variety of
assaults based on the results of the testing. All of these data show that our method is competitive with
previously developed chaos-based image encryption techniques.
REFERENCES
[1] A. Srivastava, “A survey report on different techniques of image encryption,” International Journal of Emerging Technology and
Advanced Engineering, vol. 2, no. 6, pp. 163–167, 2012.
[2] W. A. Al-Musawi, W. A. Wali, and M. A. Ali Al-Ibadi, “Field-programmable gate array design of image encryption and
decryption using Chua’s chaotic masking,” International Journal of Electrical and Computer Engineering (IJECE), vol. 12, no. 3,
pp. 2414–2424, Jun. 2022, doi: 10.11591/ijece.v12i3.pp2414-2424.
[3] S. Patel, Bharath K. P., and Rajesh Kumar M., “Symmetric keys image encryption and decryption using 3D chaotic maps with
DNA encoding technique,” Multimedia Tools and Applications, vol. 79, no. 43–44, pp. 31739–31757, Nov. 2020, doi:
10.1007/s11042-020-09551-9.
[4] M. B. Hossain, M. T. Rahman, A. B. M. S. Rahman, and S. Islam, “A new approach of image encryption using 3D chaotic map to
enhance security of multimedia component,” in 2014 International Conference on Informatics, Electronics and Vision (ICIEV),
May 2014, pp. 1–6, doi: 10.1109/ICIEV.2014.6850856.
[5] Z. K. Obaid and N. F. H. Al Saffar, “Image encryption based on elliptic curve cryptosystem,” International Journal of Electrical
and Computer Engineering (IJECE), vol. 11, no. 2, pp. 1293–1302, Apr. 2021, doi: 10.11591/ijece.v11i2.pp1293-1302.
[6] S. Anwar and S. Meghana, “A pixel permutation based image encryption technique using chaotic map,” Multimedia Tools and
Applications, vol. 78, no. 19, pp. 27569–27590, Oct. 2019, doi: 10.1007/s11042-019-07852-2.
[7] M. Francois and D. Defour, “A pseudo-random bit generator using three chaotic logistic maps,” hal.archives-ouvertes, 2013.
[8] S. Lian, “A block cipher based on chaotic neural networks,” Neurocomputing, vol. 72, no. 4–6, pp. 1296–1301, Jan. 2009, doi:
10.1016/j.neucom.2008.11.005.
[9] A. Kanso and N. Smaoui, “Logistic chaotic maps for binary numbers generations,” Chaos, Solitons and Fractals, vol. 40, no. 5,
pp. 2557–2568, Jun. 2009, doi: 10.1016/j.chaos.2007.10.049.
[10] Magfirawaty, A. A. Lestari, M. . Suryadi., and K. Ramli, “Modified logistic maps for discrete time chaos based random number
generator,” in 2018 International Conference on Electrical Engineering and Computer Science (ICECOS), Oct. 2018,
pp. 391–396, doi: 10.1109/ICECOS.2018.8605239.
[11] Y. Dong, X. Huang, Q. Mei, and Y. Gan, “Self-adaptive image encryption algorithm based on quantum logistic map,” Security
and Communication Networks, pp. 1–12, Jan. 2021, doi: 10.1155/2021/6674948.
[12] Y. Wu, “Image encryption using the two-dimensional logistic chaotic map,” Journal of Electronic Imaging, vol. 21, no. 1, Mar.
2012, doi: 10.1117/1.JEI.21.1.013014.
[13] K. Shahna and A. Mohamed, “An image encryption technique using logistic map and z-order curve,” in 2018 International
Conference on Emerging Trends and Innovations In Engineering And Technological Research (ICETIETR), Jul. 2018, pp. 1–6,
doi: 10.1109/ICETIETR.2018.8529138.
[14] R. Li, Q. Liu, and L. Liu, “Novel image encryption algorithm based on improved logistic map,” IET Image Processing, vol. 13,
no. 1, pp. 125–134, Jan. 2019, doi: 10.1049/iet-ipr.2018.5900.
[15] R. A. Elmanfaloty and E. Abou-Bakr, “An image encryption scheme using a 1D chaotic double section skew tent map,”
Complexity, pp. 1–18, Oct. 2020, doi: 10.1155/2020/7647421.
[16] J. Oravec, L. Ovsenik, and J. Papaj, “An image encryption algorithm using logistic map with plaintext-related parameter values,”
Entropy, vol. 23, no. 11, Oct. 2021, doi: 10.3390/e23111373.
[17] M. Kumar and P. Gupta, “A new medical image encryption algorithm based on the 1D logistic map associated with pseudo-
random numbers,” Multimedia Tools and Applications, vol. 80, no. 12, pp. 18941–18967, May 2021, doi: 10.1007/s11042-020-
10325-6.
[18] M. A. Rajab and L. E. George, “An efficient method for stamps recognition using histogram moment with haar wavelet sub-
bands,” Iraqi Journal of Science, vol. 62, no. 9, pp. 3182–3195, Sep. 2021, doi: 10.24996/ijs.2021.62.9.32.
[19] H. Xiang and L. Liu, “An improved digital logistic map and its application in image encryption,” Multimedia Tools and
Applications, vol. 79, no. 41–42, pp. 30329–30355, Nov. 2020, doi: 10.1007/s11042-020-09595-x.
[20] H. Liu, Z. Zhu, H. Jiang, and B. Wang, “A novel image encryption algorithm based on improved 3D chaotic cat map,” in 2008
The 9th International Conference for Young Computer Scientists, Nov. 2008, pp. 3016–3021, doi: 10.1109/ICYCS.2008.449.
[21] R. M. Rad, A. Attar, and R. E. Atani, “A new fast and simple image encryption algorithm using scan patterns and XOR,”
International Journal of Signal Processing, Image Processing and Pattern Recognition, vol. 6, no. 5, pp. 275–290, Oct. 2013, doi:
10.14257/ijsip.2013.6.5.25.
[22] R. Wayal, “The USC-SIPI image database,” Kaggle. https://www.kaggle.com/datasets/luffyluffyluffy/the-uscsipi-image-
database.
[23] M. Mandal, D. Nandi, G. Banik, and D. Chattopadhyay, “An image encryption process based on chaotic logistic map,” IETE
Technical Review, vol. 29, no. 5, 2012, doi: 10.4103/0256-4602.103173.
[24] G. Ye, K. Jiao, C. Pan, and X. Huang, “An effective framework for chaotic image encryption based on 3D logistic map,” Security
and Communication Networks, pp. 1–11, Oct. 2018, doi: 10.1155/2018/8402578.
[25] K. Shankar, “An optimal RSA encryption algorithm for secret images,” International Journal of Pure and Applied Mathematics,
vol. 118, no. 20, pp. 2491–2500, 2018.
[26] M. R. Salman, K. A. Hussein, and A. K. Farhan, “Color image encryption depend on DNA operation and chaotic system,” in 2019
First International Conference of Computer and Applied Sciences (CAS), Dec. 2019, pp. 267–272, doi:
10.1109/CAS47993.2019.9075458.](https://image.slidesharecdn.com/v6729106emr27sep223jun22n-230124070834-3288fe3b/85/Image-encryption-algorithm-based-on-the-density-and-6D-logistic-map-10-320.jpg)
![Int J Elec & Comp Eng ISSN: 2088-8708
Image encryption algorithm based on the density and 6D logistic map (Abdullah A. Rashid)
1913
[27] E. A. Kuffi, S. A. Mehdi, and E. A. Mansour, “Color image encryption based on new integral transform SEE,” Journal of
Physics: Conference Series, vol. 2322, no. 1, Aug. 2022, doi: 10.1088/1742-6596/2322/1/012016.
[28] M. A. Rajab and K. M. Hashim, “Dorsal hand veins features extraction and recognition by correlation coefficient,”
Telecommunication Computing Electronics and Control (TELKOMNIKA), vol. 20, no. 4, Aug. 2022, doi:
10.12928/telkomnika.v20i4.22068.
BIOGRAPHIES OF AUTHORS
Abdullah A. Rashid BSc in Computer Science from Iraq at the University of
Baghdad, and a MSc in computer science from Iraq at Al-Mustansiriya University. His
research interests include Information security, parallel algorithms, parallel processing, image
processing, artificial intelligence, and cryptography. He can be contacted by email:
abdullah.adil@ihcoedu.uobaghdad.edu.iq.
Khalid Ali Hussein BSc in mathematics from Iraq at Al-Mustansiriya University,
a MSc in applied mathematics from Jordan in Al-al Byte university, and a Ph.D. from Iraq at
Al-Mustansiriya University and specializes in Parallel Algorithms. he worked as a Computer
Science Instructor, at Al-Mustansiryah University/Educational College/Computer Department.
His research interests include parallel processing, image processing, cryptography,
mathematics computing, nonlinear equations, and Information security. He can be contacted
by email: dr.khalid.ali68@gmail.com.](https://image.slidesharecdn.com/v6729106emr27sep223jun22n-230124070834-3288fe3b/85/Image-encryption-algorithm-based-on-the-density-and-6D-logistic-map-11-320.jpg)


![[IJET-V2I4P10] Authors: Prof. Swetha.T.N, Dr. S.Bhargavi, Dr. Sreerama Reddy ...](https://cdn.slidesharecdn.com/ss_thumbnails/ijet-v2i4p10-161103085059-thumbnail.jpg?width=640&height=640&fit=bounds)
![[IJET-V2I4P10] Authors: Prof. Swetha.T.N, Dr. S.Bhargavi, Dr. Sreerama Reddy ...](https://cdn.slidesharecdn.com/ss_thumbnails/ijet-v2i4p10-161103101839-thumbnail.jpg?width=640&height=640&fit=bounds)