A Review of Comparison between Frame Structure & Diagrid under Seismic & Wind...
IJETR022025
1. International Journal of Engineering and Technical Research (IJETR)
ISSN: 2321-0869, Volume-2, Issue-6, June 2014
150 www.erpublication.org
Abstract— The evolution of tall building structural systems
based on new structural concepts with newly adopted high
strength materials and construction methods have been
towards “stiffness” and “lightness”. Recently diagrid
structural system is adopted in tall buildings due to its
structural efficiency and flexibility in architectural planning.
The use of diagrid structural systems for tall building design
has continued to increase. The design methodology is applied to
a set of diagrid structures which consist of 24, 36, 48 and 60
stories. The diagrid structure of each storey height is designed
with diagonals placed at various uniform angles as well as
gradually changing angles along the building height in order to
determine the optimal uniform angle for each structure with a
different height and to investigate the structural potential of
diagrids with changing angles. Based on these design studies,
design guidelines are provided for the optimum configuration
of the diagrid structure grid geometry within a certain height
range. In this paper, the comparison study of 24-storey,
36-storey, 48-storey and 60-storey of diagrid structural system
with a diagrid angle 50.2°, 67.4°, 74.5° and 82.1° is presented
here. The comparison of analysis of results in terms of top
storey displacement, storey drift, time period, angle of diagrid
and steel and concrete consumption is presented here.
Index Terms—Angle of diagrid, Diagrid structural system,
Displacement, Storey Drift, Time period
I. INTRODUCTION
The rapid growth of urban population and limitation
of available land, the taller structures are preferable now a
day. So when the height of structure increases then the
consideration of lateral load is very much important. For that
the lateral load resisting system becomes more important
than the structural system that resists the gravitational loads.
The lateral load resisting systems that are widely used are
rigid frame, shear wall, wall frame, braced tube system,
outrigger system and tubular system. Recently the diagrid –
diagonal grid structural system is widely used for tall
buildings due to its structural efficiency and aesthetic
potential provided by the unique geometric configuration of
the system. Hence the diagrid, for structural effectiveness and
aesthetics has generated renewed interest from architectural
and structural designers of tall buildings.
Manuscript received June 20, 2014.
Nishith B. Panchal, PG student, Applied Mechanics & Structural
Engineering Department, Faculty of Technology & Engineering, The M. S.
University of Baroda, (M): +91-9925001837.
Dr. V. R. Patel, Assistant Professor, Applied Mechanics & Structural
Engineering Department, Faculty of Technology & Engineering, The M. S.
University of Baroda, (M):+91-9825027338.
Dr. I. I. Pandya, Associate Professor, Head of the Applied Mechanics &
Structural engineering Department, Faculty of Technology & Engineering, The
M. S. University of Baroda
So, when the diagrid structural system is provided in
tall building, there is a very much important of angle of
diagrid. , the questions are arises in our mind that, (1) what
should be the optimum angle of diagrid? , (2) what is the
economic angle of diagrid? , (3) what should be economy
when the no. of storey is increased? So, to evaluate these
problems, the present work is carried out.
In the present work, four different models are
considered which consist of 24 storey, 36 storey, 48 storey
and 60 storey with the provision of different angle of diagrid
that is 50.2° (2-storey module), 67.4° (4-storey module),
74.5° (6-storey module) and 82.1° (12-storey module) for
each models. So, total 16 (sixteen) models are analysed and
design to overcome the problems.
II. BUILDING CONFIGURATION
A. Types of Models
Here, mathematical models are modelled which consist of
different storey that is 24 storey, 36 storey, 48 storey and 60
storey with the provision of different angle of diagrid that is
50.2° (2-storey module), 67.4° (4-storey module), 74.5°
(6-storey module) and 82.1° (12-storey module). The
notations of models are as: (1) A-1, (2) A-2, (3) A-3, (4) A-4;
(5) B-1, (6) B-2, (7) B-3, (8) B-4; (9) C-1, (10) C-2, (11) C-3,
(12) C-4; (13) D-1, (14) D-2, (15) D-3, (16) D-4;
Where, A = 24-storey (height = 86.4m), 1 = 50.2°; B =
36-storey(height = 129.6m), 2 = 67.4°; C = 48-storey (height
= 172.8m), 3 = 74.5°; D = 60-storey (height = 216m), 4 =
82.1°.
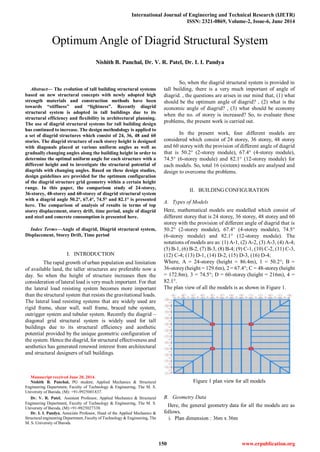
The plan view of all the models is as shown in Figure 1.
Figure 1 plan view for all models
B. Geometry Data
Here, the general geometry data for all the models are as
follows.
i. Plan dimension : 36m x 36m
Optimum Angle of Diagrid Structural System
Nishith B. Panchal, Dr. V. R. Patel, Dr. I. I. Pandya
2. Optimum Angle of Diagrid Structural System
151 www.erpublication.org
ii. Storey height : 3.6m
iii. Slab thickness : 0.120m
iv. Characteristic strength of concrete : 40 N/mm2
v. Characteristic strength of steel : 415 N/mm2
The angle of diagrid is decided on the basis of the storey
module. Here, four different storeymodule is considered, that
is 2-storey module, 4-storey module, 6-storey module and
12-storey module as shown in Figure 2.
(a) θ = 50.2° 2-storey module (b) θ = 67.4° 4-storey module
(c) θ = 74.5° 6-storey module (d) θ = 82.1° 12-storey module
Figure 2 Different storey module
The angle is obtained from the height of the storey module
to the base width of diagrid, that is,
For example: 2-storey module then,
Angle (θ) = tan-1 (height of module / base width)
Angle (θ) = tan-1 (7/6)
Angle (θ) = 50.2°
The design dead load and live load on terrace level are
5kN/m2 and 1.5kN/m2 respectively and for typical floor slab
is 4kN/m2 and 2kN/m2. The design earthquake load is
computed based on the zone factor 0.16, soil type II,
Importance factor 1, Response Reduction 5 as per
IS-1893-2002. The design wind load is computed based on
location Vadodara, Wind speed 44 m/s, Terrain category 2,
Structure class B, Risk Coefficient 1, Topography factor 1.
Modelling, analysis and design of diagrid structure are
carried out using ETABS 9.7.4 software. The end condition
for diagrid is assumed as hinged. The support conditions are
assumed as fixed. The design of member is carried out on the
basis of IS-456-2000.
C. Structural Plan
Here, Figure 3 is showing the structural plan view of all
the models in which the beam notations B1, B2, B3 and
column notations C1 are shown.
Figure 3 structural plan
The member sizes for all the models are preliminary
decided same but after analysis results and designing results,
the sizes are modified to prevent the failure and excessive top
storey displacement. TABLE 1, TABLE 2, TABLE 3 and
TABLE 4 is showing the member sizes for model-A,
model-B, model-C and model-D.
TABLE 1 Member sizes for model-A
Member No
Model-A
A-1 A-2 A-3 A-4
Beam
B1 300x600 300x600 300x600 300x600
B2 300x1050 300x1050 300x1050 300x1050
B3 300x600 300x600 300x600 300x600
Column C1
1400x140
0
1400x140
0
1400x140
0
1400x140
0
Diagrid D 500x500 450x450 450x450 500x500
TABLE 2 Member sizes for model-B
Member No
Model-B
B-1 B-2 B-3 B-4
Beam
B1 300x600 300x600 300x600 300x600
B2 300x1050 300x1050 300x1050 300x1050
B3 300x600 300x600 300x600 300x600
Column C1 1700x1700 1700x1700 1700x1700 1700x1700
Diagrid D 650x650 590x590 600x600 640x640
3. International Journal of Engineering and Technical Research (IJETR)
ISSN: 2321-0869, Volume-2, Issue-6, June 2014
152 www.erpublication.org
0
5000
10000
15000
20000
A-1A-2A-3A-4B-1 B-2 B-3 B-4 C-1 C-2 C-3 C-4D-1D-2D-3D-4
Reaction(KN)
Models
Reactions of all Models
Gravity Load (DL + LL) (x10^2) EQ load in X-dir
EQ load in Y-dir WIND load in X-dir
0
2
4
6
8
10
12
14
16
18
20
22
24
0 0.05 0.1
Storey
Displacement (m)
Storey vs Displacement
A-1
A-2
A-3
A-4
0
4
8
12
16
20
24
28
32
36
0 0.1 0.2
Storey
Displacement (m)
Storey vs Displacement
B-1
B-2
B-3
B-4
0
6
12
18
24
30
36
42
48
0 0.1 0.2
Storey
Displacement (m)
Storey vs Displacement
C-1
C-2
C-3
C-4
0
6
12
18
24
30
36
42
48
54
60
0 0.2 0.4
Storey
Displacement (m)
Storey vs Displacement
D-1
D-2
D-3
D-4
TABLE 3 Member sizes for model-C
Member No
Model-C
C-1 C-2 C-3 C-4
Beam
B1 300x600 300x600 300x600 300x600
B2 300x1050 300x1050 300x1050 300x1050
B3 300x600 300x600 300x600 300x600
Column C1 2020x2020 2020x2020 2020x2020 2020x2020
Diagrid D 830x830 740x740 740x740 800x800
TABLE 4 Member sizes for model-D
Member No
Model-D
D-1 D-2 D-3 D-4
Beam
B1 300x600 300x600 300x600 300x600
B2 300x1050 300x1050 300x1050 300x1050
B3 300x600 300x600 300x600 300x600
Column C1 2330x2330 2330x2330 2330x2330 2330x2330
Diagrid D 1020x1020 890x890 890x890 940x940
III. ANALYSIS RESULTS
Here, the dynamic analysis results for all the models are
presented here in terms of reaction, Top storey displacement,
storey drift storey shear and time period.
A. Reaction Results
The summary of reaction of gravity load (DL + LL), lateral
loads due to earthquake load and wind load for Model-A,
Model-B, Model-C and Model-D is as shown in Figure 4.
Figure 4 Summary of Reaction
B. Displacement Results
Here, the displacement results for Model-A, Model-B,
Model-C and Model-D is as shown in Figure 5, Figure 6,
Figure 7, and Figure 8. For all the models, wind load is
govern the design. So the results are displaced for the wind
load cases only.
Figure 5 Displacement results for model-A
Figure 6 Displacement results for model-B
Figure 7 Displacement results for model-C
Figure 8 Displacement results for model-D
4. Optimum Angle of Diagrid Structural System
153 www.erpublication.org
0
0.05
0.1
0.15
0.2
0.25
0.3
A-1 A-2 A-3 A-4 B-1 B-2 B-3 B-4 C-1 C-2 C-3 C-4 D-1 D-2 D-3 D-4
TopStoreyDisplacement(m)
Models
Displacement
DISPLACEMENT (m)
0
2
4
6
8
10
12
14
16
18
20
22
24
0 0.0005 0.001
Storey
Storey Drift (m)
Storey vs Storey Drift
A-1
A-2
A-3
A-4
0
4
8
12
16
20
24
28
32
36
0 0.0005 0.001
Storey
Storey Drift (m)
Storey vs Storey Drift
B-1
B-2
B-3
B-4
0
4
8
12
16
20
24
28
32
36
40
44
48
0 0.0002 0.0004 0.0006 0.0008
Storey
Storey Drift (m)
Storey vs Storey Drift
C-1
C-2
C-3
C-4
0
6
12
18
24
30
36
42
48
54
60
0 0.0002 0.0004 0.0006 0.0008
Storey
Storey Drift (m)
Storey vs Storey Drift
D-1
D-2
D-3
D-4
As per code IS: 456-2000, clause: 20.5, page no. 33, the
maximum top storey displacement due to wind load should
not exceed H/500, where H = total height of the building. The
displacement results for all the models are within the
permissible limit. It can been seen that when the height of the
building is increasing, the top storey displacement is also
increased but for the case of Model-A, displacement value is
smaller for model A-2 and A-3. This effect is similar for the
case of Model-B, Model-C and Model-D as shown in Figure
9.
Figure 9 Top Storey displacement for all models
C. Storey Drift Results
Here, the storey drift results for Model-A, Model-B,
Model-C and Model-D is as shown in Figure 10, Figure 11,
Figure 12 and Figure 13. Results are shown for the
earthquake load in both the direction here.
Figure 10 Storey drift results for model-A
Figure 11 Storey drift results for model-B
Figure 12 Storey drift results for Model-C
Figure 13 Storey drift results for model-D
For earthquake load, as per code IS: 1893-2002,
clause: 7.11.1, page no: 27, the storey drift in any storey due
to minimum specified lateral force with partial load factor of
1.0 should not exceed 0.004 times storeyheight that is H/250,
where H = storey height in meter. The storey drift value is
within the permissible limit. It can be seen that the excessive
drift for the model A-4, B-4, C-4 and D-4. Model A-2, B-2,
C-2 and D-2 is giving the better results as compared to other
models as shown in Figure 10, Figure 11, Figure 12 and
Figure 13.
D. Storey Shear Results
Here, the storey shear results are presented in Figure 14,
Figure 15, Figure 16 and Figure 17 for all the models
respectively for the lateral load earthquake EQX/EQY and
wind load WLX/WLY.
5. International Journal of Engineering and Technical Research (IJETR)
ISSN: 2321-0869, Volume-2, Issue-6, June 2014
154 www.erpublication.org
0
2
4
6
8
10
12
14
16
18
20
22
24
0 5000 10000
STOREY
STOREY SHEAR (KN)
Storey vs Storey Shear
A-1
EQ
A-1
WL
A-2
EQ
A-2
WL
A-3
EQ
A-3
WL
0
4
8
12
16
20
24
28
32
36
0 5000 10000
STOREY
STOREY SHEAR (KN)
Storey vs Storey Shear
B-1 EQ
B-1 WL
B-2 EQ
B-2 WL
B-3 EQ
B-3 WL
B-4 EQ
B-4 WL
0
4
8
12
16
20
24
28
32
36
40
44
48
0.0 10000.0 20000.0
STOREY
STOREY SHEAR (KN)
Storey vs Storey Shear
C-1 EQ
C-1 WL
C-2 EQ
C-2 WL
C-3 EQ
C-3 WL
C-4 EQ
C-4 WL
0
6
12
18
24
30
36
42
48
54
60
0.0 10000.0 20000.0
STOREY
STOREY SHEAR (KN)
Storey vs Storey Shear
D-1 EQ
D-1 WL
D-2 EQ
D-2 WL
D-3 EQ
D-3 WL
D-4 EQ
D-4 WL
0.00
0.50
1.00
1.50
2.00
2.50
3.00
3.50
4.00
1 3 5 7 9 11
Timeperiod(sec)
Modes
Time period vs Modes
A-1
A-2
A-3
A-4
0.00
1.00
2.00
3.00
4.00
5.00
1 3 5 7 9 11
Timeperiod(sec)
Modes
Time period vs Modes
B-1
B-2
B-3
B-4
Figure 14 Storey shear results for Model-A
Figure 15 Storey shear results for Model-B
Figure 16 Storey shear results for Model-C
Figure 17 Storey shear results for Model-D
Form the analysis results, it can been seen that the storey
shear for model A-4, B-4, C-4 and D-4 is more as compared
to the others. From the Figure 14, Figure 15, Figure 16 and
Figure 17, the gradual variation is noticed for the model A-2,
B-2, C-2 and D-2.
E. Time Period Results
By performing the dynamic analysis, time period is found
out byconsidering 12 mode shape for all models, is presented
here. Figure 18, Figure 19, Figure 20 and Figure 21 shows
the results of modal analysis for Model-A, Model-B,
Model-C and Model-D respectively.
Figure 18 Time period for Model-A
Figure 19 Time period for Model-B
6. Optimum Angle of Diagrid Structural System
155 www.erpublication.org
0.00
1.00
2.00
3.00
4.00
5.00
6.00
1 3 5 7 9 11
Timeperiod(sec)
Modes
Time period vs Modes
C-1
C-2
C-3
C-4
0.00
1.00
2.00
3.00
4.00
5.00
6.00
7.00
1 3 5 7 9 11
Timeperiod(sec)
Modes
Time period vs Modes
D-1
D-2
D-3
D-4
0
5000
10000
15000
20000
A-1 A-2 A-3 A-4 B-1 B-2 B-3 B-4 C-1 C-2 C-3 C-4 D-1 D-2 D-3 D-4
QUANTITY
MODELS
concrete (m3)
steel x10^2( Kg)
0.0
200.0
400.0
600.0
800.0
1000.0
1200.0
A-1 A-2 A-3 A-4 B-1 B-2 B-3 B-4 C-1 C-2 C-3 C-4 D-1 D-2 D-3 D-4
Cost(Rs.inLakhs)
Models
Total Quantity's Cost (Rs. in Lakhs)
Concrete (m3)
Steel x 10^2 (Kg)
Figure 20 Time period for Model-C
Figure 21 Time period for Model-D
The building’s natural time period is obtained from
the equation,
Where, m = mass of the structure and k = stiffness of
the building,
From the above equation, it can been observed that,
time period depends upon the mass and stiffness of the
structure. If the time period is more, the modal mass is more
but the stiffness of the building is less vice-versa. It can been
noticed that the time period is minimum for the model A-2,
B-2, C-2 and D-2, so the stiffness of that models is more as
compare to others. The time period for the models A-4, B-4,
C-4 and D-4 is very much more as shown in Figure 18,
Figure 19, Figure 20 and Figure 21.
IV. DESIGN RESULTS
The design of all the model is carried out using ETABS
v9.7.4 software. All the load combinations of gravity load,
earthquake load and wind load are assigned to both the
models. From the analysis results, design of beam, column
and diagonal members are carried out as per IS: 456-2000.
The characteristic strength of concrete is 40 N/mm2 and
characteristic strength of steel is 415 N/mm2 is considered.
The final optimum sizes of members for all the models are as
shown in TABLE 1, TABLE 2, TABLE 3 and TABLE 4
respectively.
A. Material Consumption and Structural Cost
Here, the consumption of material that is concrete and
steel is calculated for all the models is presented here. The
consumption of material for the beam, column and diagonal
members (diagrid) are as shown Figure 21.
Figure 22 Material quantity for all models
For evaluating the cost of the material consumption,
the approximate cost of concrete is taken as 4500 Rs/m3 and
cost of steel is taken as 55 Rs/m3. Figure 22 shows the graph
of total quantity’s cost.
Figure 23 Total quantity’s cost
It can been noticed that the material consumption is
minimum for the models A-2, A-3, B-2, B-3, C-2, C-3, D-2
and D-3 which is directly affected the structural cost of the
building. It can also noticed that there is not so much
difference in the steel material for the beam because the sizes
of the beam for all the models is similar.
V. DISCUSSION OF RESULTS
For the diagrid structural system, angle of diagrid is
the most considerable point because it is directly affected to
the stiffness, displacement, storey drift, storey shear, time
period and material consumption of the structure. These
factors are directly affected the structural cost if the proper
angle is not provided. So, by considering above factors,
economical and optimum angle is evaluated.
A. Top Storey Displacement
As we have consider four angle of diagrid and also for
the four types of no. of storey, we can get the results as shown
in Figure 24.
7. International Journal of Engineering and Technical Research (IJETR)
ISSN: 2321-0869, Volume-2, Issue-6, June 2014
156 www.erpublication.org
0
0.05
0.1
0.15
0.2
0.25
0.3
θ = 50.2° θ = 67.4° θ = 74.5° θ = 82.1°
Displacement(m)
Angle of Diagrid
Angle vs Displacement
Model-A
Model-B
Model-C
Model-D
0.00
1.00
2.00
3.00
4.00
5.00
6.00
7.00
θ = 50.2° θ = 67.4° θ = 74.5° θ = 82.1°
Timeperiod
Angle of diagrid
Time period vsAngle of diagrid
Model-A
Model-B
Model-C
Model-D
0
500
1000
1500
2000
2500
3000
3500
4000
4500
θ = 50.2° θ = 67.4° θ = 74.5° θ = 82.1°
Concreteconsumption(m3)
Angle of diagrid
Material consumption vs. Angle of diagrid
Model-A Model-B Model-C Model-D
Figure 24 Graph of angle of diagrid vs. displacement
From above graph, it is clearly seen that the
displacement is less for the diagrid angle 50.2° for model-A
24 storey building. But from the results of model-B, model-C
and Model-D, the displacement results is less for the angle
67.4° and 74.5° as compared to others. So the angle of
diagrid is optimum in the region of angle 65° to 75° and also
for the more no of storey.
B. Storey Drift
From the results of storey drift, it is clearly noticed that the
model A-2, B-2, C-2 and D-2 gives better results, which is
clearly indicating that the angle region 65° to 75° is
optimum.
C. Storey Shear
From the results of storeyshear, it is clearly noticed that the
model A-2, B-2, C-2 and D-2 gives better results, which is
clearly indicating that the angle region 65° to 75° is
optimum.
D. Time Period
Byconsidering the onlyfirst mode time period, as shown in
Figure 25,
Figure 25 Graph of time period vs. angle of diagrid
It can been observed that the first mode time period is
minimum for angle region 65° to 75° and also when the no of
storey is increased, the time period is decreased. So the
optimum angle is in the region of 65° to 75°.
E. Material Consumption
From the results, it is observed that there is not so much
difference in the steel quantity but more difference is
observed when the angle of diagrid changed and increased
the no of storey of the structure in concrete quantity as shown
in Figure 26.
Figure 26 Material consumption vs. angle of diagrid
From above graph, it can been seen that the consumption is
in the region 65° to 75° angle of diagrid but when the no of
storey increased, there is minimum consumption in concrete
is observed. This observation is also directly affected to the
structural cost of the building. So the optimum angle is in the
region of 65° to 75°.
VI. CONCLUSION
The current studyis carried out by considering the different
angles of diagrid and also different storeys of the building.
The plan of 36m x 36m is considered with four different types
of angles of diagrid that is 50.2°, 67.4°, 74.5° and 82.1° and
also by considering 24-storey, 36-storey, 48-storey and
60-storey building, a comparative study is carried out.
We conclude from the study that,
Diagrid angle in the region of 65° to 75° provides more
stiffness to the diagrid structural system which reflects the
less top storey displacement.
The storey drift and storey shear results are very much
lesser in the region of diagrid angle 65° to 75°.
As time period is less, lesser is mass of structure and
more is the stiffness, the time period is observed less in the
region of diagrid angle 65° to 75° which reflects more
stiffness of the structure and lesser mass of structure.
It should be noticed that the results for the angle of
diagrid 82.1° is quite random for the storey drift, storey shear
and time period.
Diagrid angle in the region 65° to 75° provides more
economy in terms of consumption of steel and concrete as
compared to different angles of diagrid.
When number of storey increases means height of
building increases, diagrid angle in the region 65° to 75°
gives better results in terms of top storey displacement, storey
drift, storey shear, time period and material consumptions.
8. Optimum Angle of Diagrid Structural System
157 www.erpublication.org
Diagrid structural system provides more economy and
more benefits when no of storey is more than 40 with the
diagrid angle in the region of 65° to 75°.
Optimum angle of diagrid is observed in the region of
65° to 75°.
Diagrid structural system provides more flexibility in
planning interior space and façade of the building.
ACKNOWLEDGMENT
I am very much thankful to my guide Dr. Vinubhai R. Patel
and Dr. I. I. Pandya for their guidance and also very much
thankful to Applied Mechanics Department & Structural
Engineering Department, Faculty of Technology &
Engineering, The M. S. UniversityOf Baroda for giving such
a good facilities and platform to complete the dissertation
work and also my dear friends who have supported me to
complete this work.
REFERENCES
[1] Nishith B. Panchal, Vinubhai R. Patel, “Diagrid Structural System:
Strategies to Reduce Lateral Forces on High-Rise Buildings”,
International Journal of Research in Engineering and Technology,
Volume: 03, Issue: 03, April-2014. pp. 374-378
[2] Kyoung S. Moon, Jerome J. Connor and John E. Fernandez, “Diagrid
Structural Systems for Tall Building: Characteristics and Methodology
for Preliminary Design”, Willey Interscience Publication.
[3] Khushbu Jani and Paresh V. Patel, “Analysis and Design of Diagrid
Structural System for High Rise Steel Buildings”, Published by Elesevier
Ltd.
[4] Mir M. Ali and Kyoung S. Moon, “Structural Developments in Tall
Buildings: Current Trends and Future Prospects”, Architectural Science
Review Vol 50.3, pp 205-223.
[5] Kyoung S. Moon, “Diagrid Structures for Complex-Shaped Tall
Building”, Published by Elesevier Ltd.
[6] Charnish B. and McDonnell T. “The Bow: Unique Diagrid Structural
System for a Sustainable Tall Building”, CTBUH 8th World Congress,
Dubai.
[7] Khushbu Jani and Paresh V. Patel, “Diagrid Structural System For High
Rise Buildings”, 26th Indian Engineering Congress (IEC 2011),
Bangalore, 15-18 December 2011.
[8] Khushbu Jani and Paresh V. Patel, “Design of Diagrid Structural System
for High Rise Buildings as Per Indian Standards”, Structures Congress
2013, ASCE 2013.
[9] Chonghou Zhang, Zhao and Yansheng Liu, “Diagrid Tube Structures
Composed Of Straight Diagonals With Gradually Varying Angles” The
Structural Design of Tall and Special Buildings 21, 283–295 (2012).
[10] IS: 456-2000. Plain and Reinforced Concrete- Code of Practice (Fourth
Revision), Bureau of Indian Standard, New Delhi.
[11] IS: 1893(Part-I)-2002, Criteria for Earthquake Resistant Design of
Structures, Bureau of Indian Standard, New Delhi.
[12] IS: 875(Part-I, II, III)-1987, Code of Practice for Design Loads (other
than Earthquake) for Buildings and Structures, Bureau of Indian
Standard, New Delhi.
I am Nishith B. Panchal. I am pursuing my Master Of
Engineering study in Structural engineering branch from The M. S. University
of Baroda. I am doing my dissertation work under the guidance of Dr. V. R.
Patel sir. I have completed my Bachelor of Engineering (civil engineering)
study also from The M. S. University of Baroda.
He is Dr. Vinubhai R. Patel, Assistant Professor, Applied
Mechanics and Structure Engineering Department, Faculty Of Technology &
Engineering, The M. S. University of Baroda. He is also a structure designed
consultant and approved valuer. He has more than 15 years of experience in the
field of structural and civil engineering. He had designed more than 2500
projects which includes industrial, factory buildings and high-rise buildings.
He is Dr. I. I. Pandya, Associate Professor, Head of Applied Mechanics and
Structure Engineering Department, Faculty of Technology & Engineering, The
M. S. University of Baroda. He has a very wide experience of teaching and in
research in the field of Structural engineering. He is also a structure designed
consultant.