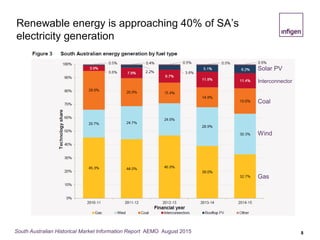
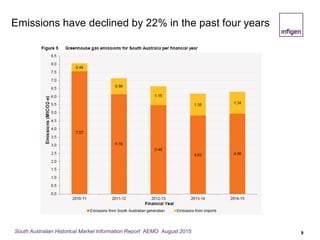
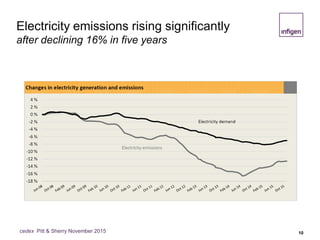
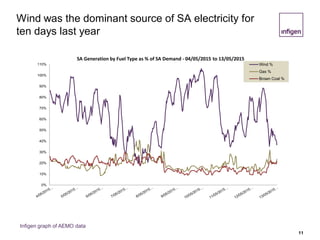
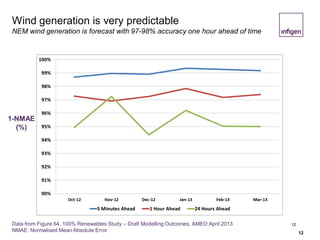
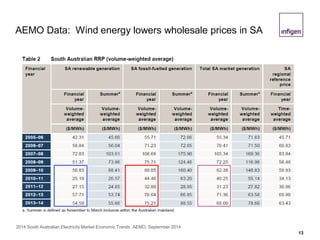
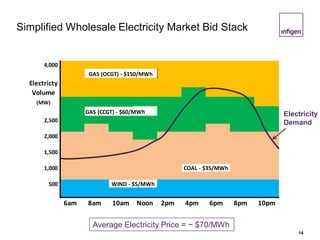
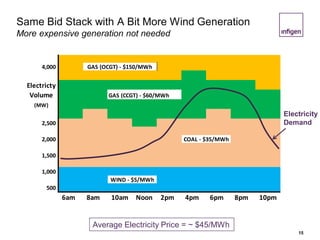
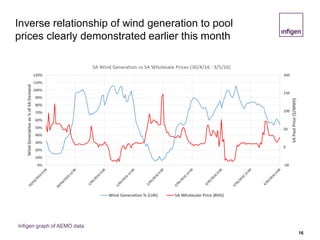
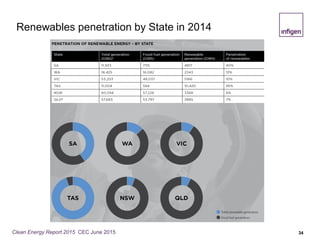
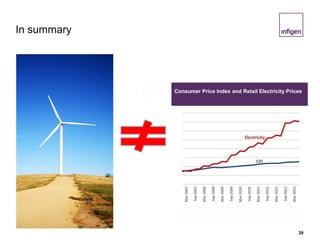
SlideShare a Scribd company logo
Renewable Energy in the NEM
Presentation to the Australian Institute of Energy
May 16, 2016
Agenda Arial Bold 28pt
2
• Global Renewable Energy Market
• Renewables in Australia
• South Australia
• NSW
• Progress towards meeting the LRET
• Future Energy/Climate policy options
• Conclusion
Presenter:
Jonathan Upson Senior Development & Government Affairs Manager
Agenda
3
Location: New South Wales
Status: Operational January 2010
Installed Capacity: 140.7MW
Turbine: 67 Suzlon 2.1MW S88
Location: Western Australia
Status: Operational January 2006
Installed Capacity: 89.1MW
Turbine: 54 NEG Micon NM82
Location: South Australia
Status: Operational March 2005
Installed Capacity: 80.5MW
Turbine: 46 Vestas V66
Location: South Australia
Status: Operational September 2008
Installed Capacity: 159.0MW
Turbine: 53 Vestas V90
Location: South Australia
Status: Operational June 2010
Installed Capacity: 39.0MW
Turbine: 13 Vestas V90
Location: New South Wales
Status: Operational October 2011
Installed Capacity: 48.3MW
Turbine: Suzlon 2.1MW S88
Infigen - Australia’s leading wind energy business
ALINTA
LAKE BONNEY 2
LAKE BONNEY 1
LAKE BONNEY 3
WOODLAWN
CAPITAL
4
Infigen Energy’s NSW Investment
• Operational
– $374 Million Capital Wind Farm near Bungendore, NSW
– $115 Million Woodlawn Wind Farm, near the Capital Wind Farm
– Capital East Solar PV Demo/Energy Storage Facility
• Planning Approved
– 70-100 MW Capital II Wind Farm
– 100 MW Bodangora Wind Farm
– 120 MW Flyers Creek Wind Farm
– 37 MW Capital Solar PV Project
– 40 MW Manildra Solar PV Project
Wind Energy was #1 for new build worldwide in 2015
5
More wind energy
capacity was
installed in 2015
than any other
electricity generation
technology
Renewable technologies made up over 60% of
electricity capacity additions worldwide in 2015
6
Renewable Energy Investments: Major Milestones Reached New World Record Set
United Nations Environment Programme, Bloomberg New Energy Finance March 14, 2016
Is there another industry in the world with
such a high and sustained rate of growth?
7
Global Wind Energy Outlook 2015 Global Wind Energy Council April 2016
Renewable energy is approaching 40% of SA’s
electricity generation
8South Australian Historical Market Information Report AEMO August 2015
Wind
Solar PV
Coal
Gas
Interconnector
Emissions have declined by 22% in the past four years
9South Australian Historical Market Information Report AEMO August 2015
Electricity emissions rising significantly
after declining 16% in five years
10cedex Pitt & Sherry November 2015
Wind was the dominant source of SA electricity for
ten days last year
11
0%
10%
20%
30%
40%
50%
60%
70%
80%
90%
100%
110%
SA Generation by Fuel Type as % of SA Demand - 04/05/2015 to 13/05/2015
Wind %
Gas %
Brown Coal %
Infigen graph of AEMO data
12
Wind generation is very predictable
NEM wind generation is forecast with 97-98% accuracy one hour ahead of time
12
1-NMAE
(%)
Data from Figure 64, 100% Renewables Study – Draft Modelling Outcomes, AMEO April 2013
NMAE: Normalised Mean Absolute Error
AEMO Data: Wind energy lowers wholesale prices in SA
13
2014 South Australian Electricity Market Economic Trends AEMO, September 2014
Simplified Wholesale Electricity Market Bid Stack
14
Electricity
Demand
4,000
Electricty
Volume
(MW)
GAS (CCGT) - $60/MWh
2,500
2,000
1,500
1,000
500
6am 8am 10am Noon 2pm 4pm 6pm 8pm 10pm
GAS (OCGT) - $150/MWh
WIND - $5/MWh
COAL - $35/MWh
Average Electricity Price = ~ $70/MWh
Same Bid Stack with A Bit More Wind Generation
More expensive generation not needed
15
Electricity
Demand
4,000
Electricty
Volume GAS (CCGT) - $60/MWh
(MW)
2,500
2,000
1,500
1,000
500
6am 8am 10am Noon 2pm 4pm 6pm 8pm 10pm
GAS (OCGT) - $150/MWh
WIND - $5/MWh
COAL - $35/MWh
Average Electricity Price = ~ $45/MWh
Inverse relationship of wind generation to pool
prices clearly demonstrated earlier this month
16
Infigen graph of AEMO data
Six independent electricity market modelling studies
have shown the LRET does not raise electricity prices
• ACIL Allen’s modelling for the Warburton Review confirmed the earlier results from
SKM (Jacobs), Schneider Electric, ROAM, IES, and Bloomberg
• All six studies generated similar results; reducing the LRET causes:
– Retail prices to decrease by a small amount in the short term
– Followed by retail prices increasing by a larger amount in the medium - long term
• The AiGroup, representing over 60,000 businesses, recognised this in their RET
Review submission, and in a more recent media release
– “Across the board, analysis of the RET has concluded that large reductions
in the target would leave energy users worse off.”
17
Causes of South Australia’s high wholesale
electricity prices
• Lack of effective competition in generation
• Over 95% of dispatchable generation relies on increasingly expensive gas
– Rising, volatile gas prices resulting from LNG exports
• SA is interconnected to only one State
– NSW and Victoria are connected to multiple States which is beneficial
• SA has the highest peak to average load ratio of any State
– Resulting in ‘additional’ peaking plants and power lines that are rarely used
18
19
There is significant competition in the Australian
Wind Energy Market
Australian Wind Farm Owners (operating MW)1
Ecogeneration and company websites (2015).
Infigen Energy
14% China State Power
Investment
10%
Trustpower
9%
Shenhua/ Hydro Tas
8%
Acciona
6%
Malakoff
5%
Morrison
5%
UBS IIF/REST
5%
Meridian
5%
Goldwind/Jingeng
4%
InfrastructureCapital
Group
4%
Energy Infrastructure
Investments
3%
AGL
3%
Wind Prospects
3%
Mitsui
3%
20 Others
13%
South Australian thermal generation market
is not very competitive
20
Generation capacity and retail offtake data from State of the Energy Market 2015 AER December, 2015
EUAA recognises a lack of competition in SA
21
Queensland – another less than competitive
electricity market
• Queensland had the highest wholesale electricity prices in the NEM for FY15
– $52.18 (vs $39.38 for SA)
• Similar situation to SA---two dominant generators (Stanwell and CS Energy)
– These state owned generators own almost 2/3 of the State’s generation capacity
• AER states “generators including Stanwell, CS Energy and Callide periodically rebid
large volumes of capacity from low to very high prices late in a trading interval.”
– Ernst & Young estimated late re-bidding added $7-8/MWh to Queensland price cap
contracts in the six months up to March 2015 (AER)
• Queensland had the highest prices in FY15, but they have negligible wind
generation
– Wind farms did not cause Queensland to have the highest wholesale prices last FY
22
Source for AER statements: State of the Energy Market 2015 AER December, 2015
Expensive peaking plant generation in SA has
declined as wind energy penetration increased
23
Peaking Capacity, CO2-e Emissions and Pricing in the South Australian Electricity Grid with High Wind Penetration 2005-2013
Dr David Osmond, Luke Osborne Windlab Systems May 2014
SA was much more reliant on interconnectors
before wind farms
24
Plotted from AEMO data
-500
0
500
1000
1500
2000
2500
3000
FY03 FY04 FY05 FY06 FY07 FY08 FY09 FY10 FY11 FY12 FY13 FY14 FY15
Wind Capacity (MW) Net Interconnector Imports (GWh)
SA Electricity System Reliability
• “…about 95 per cent of reliability issues in the NEM originate in the distribution
network sector.”1
– Only 5% of outages are caused by issues in the high voltage transmission network or
electricity generation plants
• While AEMO continues to evaluate potential future SA electricity market issues,
– “AEMO has not identified any system security challenges that cannot be
managed through existing processes and procedures” in conjunction with
the closure of the Norther Power Station2
25
1 State of the Energy Market 2015 AER December 2015
2 Update to Renewable Energy Integration in South Australia AEMO and Electranet February 2016
Frequency Control & Ancillary Services (FCAS)
• The FCAS market procures services to maintain electricity network frequency at 50Hz
– Normal FCAS charges for all of SA are typically less than $35/hour
• FCAS can be ‘imported’ via interconnectors; therefore, provision of FCAS is a non-issue when
the Heywood interconnector is operational
• Likewise, system inertia (which reduces the rate of frequency change) can be supplied over an
interconnector
– Historically, the Heywood interconnector has tripped about once every two years
• For several weeks in Q4 of last year, SA FCAS charges exceeded $25 Million during scheduled
outages of one circuit of the Heywood interconnector
– These charges were shared roughly 50/50 between electricity customers and SA generators
• The Australian Energy Regulator in their report1 made it clear the two primary causes for the
excessive FCAS prices were:
– AEMO implemented changes to established FCAS protocols with little warning to market
participants and customers
– Late rebidding of capacity from low to very high prices by two market participants
26
1 Report into Market ancillary service prices above $5000 South Australia, 11, 12 and 25 October 2015 AER December 2015
Power outage in SA on November 1st
• Line two of the Heywood interconnector was off-line for scheduled work as part of
the interconnector upgrade
• Line one of the interconnector “tripped when an automated test signal was
unexpectedly interpreted by the new relay as a trip signal.”
• AEMO makes it clear in their report that there was no relationship between
the power outage and wind farms in SA
• There were delays reconnecting SA to the NEM caused by difficulties stabilising the
SA electricity network frequency at 50Hz
– However, AEMO also makes it clear in their report that these difficulties were caused
by issues with thermal generators---not wind farms
27
Source: Load Shedding in South Australia on Sunday 1 November 2015 AEMO February 2016
28
Installed Wind Energy Capacity by State
Clean Energy Report 2014.,CEC June 2015
NSW currently ranks
4th for wind farm
investment and jobs
NSW
NSWNSW
NSW forecast to achieve the largest share of
renewable investment over the next decade
29
RET Review Modelling ACIL Allen August 2014
Renewables in NSW
• NSW has 660 MW of wind energy installed today
– Two large wind farms committed to be built in the New England region of NSW
– Goldwind’s 175 MW White Rock and CWP’s 260MW Sapphire wind farm
• NSW is leading the country with 175MW of installed large-scale solar projects
– Together, wind and large scale solar make up about 5% of NSW’s generation
• In 2014, about 11% of NSW’s electricity came from renewable sources
– NSW REAP calls for 20% of electricity to come from renewables by 2020
• In order to meet the bi-partisan 33TWh LRET target, the CEC estimates that about 6000MW
of new generation capacity worth $10 Billion and creating 6500 jobs are required by 2020
– NSW should capture about half of these new jobs and investment
30
Retailers have only 4 options to meet their legislated
LRET obligations
1. Build large-scale renewable developments they own (as AGL has
largely done)
2. Purchase, and then build, developments from other companies
3. Negotiate Power Purchase Agreements (PPAs) with developers
enabling them to finance and build projects
4. Purchase LGCs from the spot market
– The Clean Energy Regulator, and energy analysts, have made it clear
that this is not a viable option for the three large retailers
The first three options have a 18-24 month lead time
Clean Energy Regulator’s RET Annual Statement
32
Clean Energy Regulator’s view
33
Renewables penetration by State in 2014
34Clean Energy Report 2015 CEC June 2015
Can the rest of the NEM accommodate SA’s market
share of renewables?
• South Australia accommodates 40% variable RE market share today
without significant issues
• Current LRET target of 33TWh (~23% RE) can also be achieved without
significant technical issues or economic impact for customers
• Other States will not approach SA’s variable RE market share for at least
10 years without very significant changes to current policies
• In less than 10 years, higher levels of renewables will be facilitated by
– Solar Thermal which will be more cost competitive
– ‘Baseload’ renewables automatically providing FCAS and inertia
– Large-scale battery storage which will almost certainly be cost competitive
– Other technologies will also contribute
35
Facilitating the energy transformation/modernisation
• There are significant disincentives for older, more polluting generators
exiting the market
– First mover disadvantage
– Significant redundancy/remediation costs
– Lose ability to realise higher prices/payouts which they hope might occur
• Several proposals on the table to ‘encourage’ high emitting power stations
past their use-by-date to close
– Brown Coal generator paid to close from levy on remaining coal generators
(Frank Jotzo, ANU)
– Change Safeguard mechanism to reduce electricity emissions (Grattan)
– Emissions Intensity Scheme (AEMC)
– Regulatory Closure (based on age?, emissions?)
• It is more important that effective bi-partisan action is taken that will survive the
next election(s) than which mechanism is selected
36
Preliminary CCA modelling of electricity
abatement options
37
Report urging carbon tax on power withheld Peter Hannam www.smh.com.au May 6, 2016
LRET found to be the most efficient wind energy
support scheme in the world
38
International support for onshore wind Frontier Economics (UK) June 2013. PPP: purchasing power parity
In summary
39
Consumer Price Index and Retail Electricity Prices
Conclusion
• It’s clear there is serious momentum to decarbonise electricity generation
around the world
• South Australia is not an experiment that has gone wrong
– Renewables apply downward pressure on wholesale electricity prices
– There is no threat to the security of supply today (AEMO)
– Electricity emissions have declined dramatically
• There are no technical issues, or significant economic impacts of,
achieving the LRET target of 33TWh in 2020
• Higher levels of renewables penetration will be facilitated by new
technologies (solar thermal, batteries, etc.)
– Modernisation of Australia’s electricity generation fleet will occur
40
41
QuestionsQuestions

More Related Content

What's hot

ISO New England - 2016 Regional Electricity Outlook
ISO New England - 2016 Regional Electricity OutlookISO New England - 2016 Regional Electricity Outlook
ISO New England - 2016 Regional Electricity Outlook
Marcellus Drilling News
 
FERC & DOE Incentives for Renewables
FERC & DOE Incentives for RenewablesFERC & DOE Incentives for Renewables
FERC & DOE Incentives for Renewableselwalsh
 
Solar 101 - Franklin 8/20/14
Solar 101 - Franklin 8/20/14Solar 101 - Franklin 8/20/14
Solar 101 - Franklin 8/20/14
Franklin Matters
 
Fuel requirement under various scenario
Fuel requirement under various scenarioFuel requirement under various scenario
Fuel requirement under various scenario
Probodh Mallick
 
Power sector in argentina
Power sector in argentinaPower sector in argentina
Power sector in argentina
Machiraju Presentations Pvt. Ltd.
 
State electricity profile new jersey (1)
State electricity profile   new jersey (1)State electricity profile   new jersey (1)
State electricity profile new jersey (1)Lyle Birkey
 
ABB Case Study - Helping Severn Trent Water Eliminate Power Factor Charges - ...
ABB Case Study - Helping Severn Trent Water Eliminate Power Factor Charges - ...ABB Case Study - Helping Severn Trent Water Eliminate Power Factor Charges - ...
ABB Case Study - Helping Severn Trent Water Eliminate Power Factor Charges - ...
Thorne & Derrick International
 
The Economics of Electric Energy: IPPs, the PPA, and the Electric Power Indus...
The Economics of Electric Energy: IPPs, the PPA, and the Electric Power Indus...The Economics of Electric Energy: IPPs, the PPA, and the Electric Power Indus...
The Economics of Electric Energy: IPPs, the PPA, and the Electric Power Indus...
Louie Mark Quizon
 
Bhiwandi electricity distribution
Bhiwandi electricity distributionBhiwandi electricity distribution
Bhiwandi electricity distribution
Thapar Institute of Engineering and Technology.
 
A Survey of the Generation Landscape
A Survey of the Generation LandscapeA Survey of the Generation Landscape
A Survey of the Generation Landscape
ScottMadden, Inc.
 
State and Local Taxation of the Electric Industry in Texas
State and Local Taxation of the Electric Industry in Texas State and Local Taxation of the Electric Industry in Texas
State and Local Taxation of the Electric Industry in Texas
aectnet
 
Energy in Australia: Past, present and future
Energy in Australia: Past, present and futureEnergy in Australia: Past, present and future
Energy in Australia: Past, present and future
IEA-ETSAP
 
Green Lecture Series: Rethinking Local Energy Choices and Costs
Green Lecture Series: Rethinking Local Energy Choices and CostsGreen Lecture Series: Rethinking Local Energy Choices and Costs
Green Lecture Series: Rethinking Local Energy Choices and Costs
CUSP | Univ of Guelph
 
ScottMadden's 51st State Roadmap
ScottMadden's 51st State RoadmapScottMadden's 51st State Roadmap
ScottMadden's 51st State Roadmap
ScottMadden, Inc.
 
Identifying SmartGrid Opportunities to Aid a Low-Carbon Future in the UK
Identifying SmartGrid Opportunities to Aid a Low-Carbon Future in the UKIdentifying SmartGrid Opportunities to Aid a Low-Carbon Future in the UK
Identifying SmartGrid Opportunities to Aid a Low-Carbon Future in the UK
EOI Escuela de Organización Industrial
 
Promotion of Clean Energy, Energy Efficiency and DSM by Maharasthra Electrici...
Promotion of Clean Energy, Energy Efficiency and DSM by Maharasthra Electrici...Promotion of Clean Energy, Energy Efficiency and DSM by Maharasthra Electrici...
Promotion of Clean Energy, Energy Efficiency and DSM by Maharasthra Electrici...
electricitygovernance
 
Albania toward large and sustainable energy developments by lorenc gordani
Albania toward large and sustainable energy developments by lorenc gordaniAlbania toward large and sustainable energy developments by lorenc gordani
Albania toward large and sustainable energy developments by lorenc gordani
Lorenc Gordani
 
Fixing Our Power Crisis - EAZ v2 28.10.16
Fixing Our Power Crisis - EAZ v2 28.10.16Fixing Our Power Crisis - EAZ v2 28.10.16
Fixing Our Power Crisis - EAZ v2 28.10.16Kachinga-Wankunda Phiri
 

What's hot (20)

ISO New England - 2016 Regional Electricity Outlook
ISO New England - 2016 Regional Electricity OutlookISO New England - 2016 Regional Electricity Outlook
ISO New England - 2016 Regional Electricity Outlook
 
FERC & DOE Incentives for Renewables
FERC & DOE Incentives for RenewablesFERC & DOE Incentives for Renewables
FERC & DOE Incentives for Renewables
 
Solar 101 - Franklin 8/20/14
Solar 101 - Franklin 8/20/14Solar 101 - Franklin 8/20/14
Solar 101 - Franklin 8/20/14
 
Fuel requirement under various scenario
Fuel requirement under various scenarioFuel requirement under various scenario
Fuel requirement under various scenario
 
Power sector in argentina
Power sector in argentinaPower sector in argentina
Power sector in argentina
 
State electricity profile new jersey (1)
State electricity profile   new jersey (1)State electricity profile   new jersey (1)
State electricity profile new jersey (1)
 
ABB Case Study - Helping Severn Trent Water Eliminate Power Factor Charges - ...
ABB Case Study - Helping Severn Trent Water Eliminate Power Factor Charges - ...ABB Case Study - Helping Severn Trent Water Eliminate Power Factor Charges - ...
ABB Case Study - Helping Severn Trent Water Eliminate Power Factor Charges - ...
 
The Economics of Electric Energy: IPPs, the PPA, and the Electric Power Indus...
The Economics of Electric Energy: IPPs, the PPA, and the Electric Power Indus...The Economics of Electric Energy: IPPs, the PPA, and the Electric Power Indus...
The Economics of Electric Energy: IPPs, the PPA, and the Electric Power Indus...
 
Bhiwandi electricity distribution
Bhiwandi electricity distributionBhiwandi electricity distribution
Bhiwandi electricity distribution
 
A Survey of the Generation Landscape
A Survey of the Generation LandscapeA Survey of the Generation Landscape
A Survey of the Generation Landscape
 
State and Local Taxation of the Electric Industry in Texas
State and Local Taxation of the Electric Industry in Texas State and Local Taxation of the Electric Industry in Texas
State and Local Taxation of the Electric Industry in Texas
 
Energy in Australia: Past, present and future
Energy in Australia: Past, present and futureEnergy in Australia: Past, present and future
Energy in Australia: Past, present and future
 
Green Lecture Series: Rethinking Local Energy Choices and Costs
Green Lecture Series: Rethinking Local Energy Choices and CostsGreen Lecture Series: Rethinking Local Energy Choices and Costs
Green Lecture Series: Rethinking Local Energy Choices and Costs
 
ScottMadden's 51st State Roadmap
ScottMadden's 51st State RoadmapScottMadden's 51st State Roadmap
ScottMadden's 51st State Roadmap
 
Identifying SmartGrid Opportunities to Aid a Low-Carbon Future in the UK
Identifying SmartGrid Opportunities to Aid a Low-Carbon Future in the UKIdentifying SmartGrid Opportunities to Aid a Low-Carbon Future in the UK
Identifying SmartGrid Opportunities to Aid a Low-Carbon Future in the UK
 
Promotion of Clean Energy, Energy Efficiency and DSM by Maharasthra Electrici...
Promotion of Clean Energy, Energy Efficiency and DSM by Maharasthra Electrici...Promotion of Clean Energy, Energy Efficiency and DSM by Maharasthra Electrici...
Promotion of Clean Energy, Energy Efficiency and DSM by Maharasthra Electrici...
 
the economics of electricity in the Philippines
the economics of electricity in the Philippinesthe economics of electricity in the Philippines
the economics of electricity in the Philippines
 
Albania toward large and sustainable energy developments by lorenc gordani
Albania toward large and sustainable energy developments by lorenc gordaniAlbania toward large and sustainable energy developments by lorenc gordani
Albania toward large and sustainable energy developments by lorenc gordani
 
Pcci energy committe twg on power
Pcci energy committe   twg on powerPcci energy committe   twg on power
Pcci energy committe twg on power
 
Fixing Our Power Crisis - EAZ v2 28.10.16
Fixing Our Power Crisis - EAZ v2 28.10.16Fixing Our Power Crisis - EAZ v2 28.10.16
Fixing Our Power Crisis - EAZ v2 28.10.16
 

Viewers also liked

Glenn Dambrauskas - Knee surgery
Glenn Dambrauskas - Knee surgeryGlenn Dambrauskas - Knee surgery
Glenn Dambrauskas - Knee surgery
Glenn-Dambrauskas
 
Pausa Mínima
Pausa MínimaPausa Mínima
Pausa Mínima
roseandreia
 
Dapanes amea om st
Dapanes amea om stDapanes amea om st
Dapanes amea om steuteipir
 
Volkswagen Mag Dec 2009
Volkswagen Mag Dec 2009Volkswagen Mag Dec 2009
Volkswagen Mag Dec 2009
Marleen1982
 
presentacion power point
presentacion power pointpresentacion power point
presentacion power pointjessicam18
 
Motivational Factors leading to immigration to Canada
Motivational Factors leading to immigration to CanadaMotivational Factors leading to immigration to Canada
Motivational Factors leading to immigration to Canada
Amir Ismail & Associates (AIA) - Global Immigration Advisers
 
Article on Rage Magazine - Issue No 14. Doc 16
Article on Rage Magazine - Issue No 14. Doc 16Article on Rage Magazine - Issue No 14. Doc 16
Article on Rage Magazine - Issue No 14. Doc 16Emile Tenoa (ET)
 
Asdfasf
AsdfasfAsdfasf
Quién es María del Pilar Hurtado y por qué puede ser extraditada a Colombia
Quién es María del Pilar Hurtado y por qué puede ser extraditada a ColombiaQuién es María del Pilar Hurtado y por qué puede ser extraditada a Colombia
Quién es María del Pilar Hurtado y por qué puede ser extraditada a Colombia
Miguel Ramírez
 
Conexión sharing kit
Conexión sharing kitConexión sharing kit
Conexión sharing kitpintor63
 
Christ Olive Garden El Greco
Christ Olive Garden El GrecoChrist Olive Garden El Greco
Christ Olive Garden El GrecoOlijfbedrijf
 
Mauricio reina uribe
Mauricio reina uribeMauricio reina uribe
Mauricio reina uribemreinauribe
 

Viewers also liked (20)

Glenn Dambrauskas - Knee surgery
Glenn Dambrauskas - Knee surgeryGlenn Dambrauskas - Knee surgery
Glenn Dambrauskas - Knee surgery
 
Pausa Mínima
Pausa MínimaPausa Mínima
Pausa Mínima
 
Dapanes amea om st
Dapanes amea om stDapanes amea om st
Dapanes amea om st
 
Volkswagen Mag Dec 2009
Volkswagen Mag Dec 2009Volkswagen Mag Dec 2009
Volkswagen Mag Dec 2009
 
Trasfondo azul-4
Trasfondo azul-4Trasfondo azul-4
Trasfondo azul-4
 
Volume iii web
Volume iii webVolume iii web
Volume iii web
 
presentacion power point
presentacion power pointpresentacion power point
presentacion power point
 
Hi
HiHi
Hi
 
Motivational Factors leading to immigration to Canada
Motivational Factors leading to immigration to CanadaMotivational Factors leading to immigration to Canada
Motivational Factors leading to immigration to Canada
 
Article on Rage Magazine - Issue No 14. Doc 16
Article on Rage Magazine - Issue No 14. Doc 16Article on Rage Magazine - Issue No 14. Doc 16
Article on Rage Magazine - Issue No 14. Doc 16
 
La lectura
La lecturaLa lectura
La lectura
 
Asdfasf
AsdfasfAsdfasf
Asdfasf
 
Aritmetaca
AritmetacaAritmetaca
Aritmetaca
 
Practica
PracticaPractica
Practica
 
Quién es María del Pilar Hurtado y por qué puede ser extraditada a Colombia
Quién es María del Pilar Hurtado y por qué puede ser extraditada a ColombiaQuién es María del Pilar Hurtado y por qué puede ser extraditada a Colombia
Quién es María del Pilar Hurtado y por qué puede ser extraditada a Colombia
 
Conexión sharing kit
Conexión sharing kitConexión sharing kit
Conexión sharing kit
 
Christ Olive Garden El Greco
Christ Olive Garden El GrecoChrist Olive Garden El Greco
Christ Olive Garden El Greco
 
Mauricio reina uribe
Mauricio reina uribeMauricio reina uribe
Mauricio reina uribe
 
Winick Reference Letter
Winick Reference LetterWinick Reference Letter
Winick Reference Letter
 
certificate-6
certificate-6certificate-6
certificate-6
 

Similar to IFN AiE Presentation May16 web

Electricity Overview
Electricity OverviewElectricity Overview
Electricity OverviewParthosb
 
ISO New England Slides Used During Jan 16, 2016 Webinar
ISO New England Slides Used During Jan 16, 2016 WebinarISO New England Slides Used During Jan 16, 2016 Webinar
ISO New England Slides Used During Jan 16, 2016 Webinar
Marcellus Drilling News
 
Independent Review of the Australian National Electricity Market
Independent Review of the Australian National Electricity MarketIndependent Review of the Australian National Electricity Market
Independent Review of the Australian National Electricity Market
Turlough Guerin GAICD FGIA
 
Firebox Wind-Gas Paper
Firebox Wind-Gas PaperFirebox Wind-Gas Paper
Firebox Wind-Gas PaperMike Schiller
 
Power blackouts with special reference to july 2013 copy
Power blackouts with special reference to july 2013   copyPower blackouts with special reference to july 2013   copy
Power blackouts with special reference to july 2013 copy
NIT MEGHALAYA
 
AECT Electricity 101
AECT Electricity 101AECT Electricity 101
AECT Electricity 101
aectnet
 
Opportunities for wind energy in NSW
Opportunities for wind energy in NSWOpportunities for wind energy in NSW
Opportunities for wind energy in NSW
NSW Environment and Planning
 
Investment in solar and wind generation in australia lessons learned
Investment in solar and wind generation in australia   lessons learnedInvestment in solar and wind generation in australia   lessons learned
Investment in solar and wind generation in australia lessons learned
achanana
 
Presentation (group)
Presentation (group)Presentation (group)
Presentation (group)Ankit Grover
 
Professor Isam Shahrour Summer Course « Smart and Sustainable City » Chapter...
Professor Isam Shahrour Summer Course « Smart and Sustainable City »  Chapter...Professor Isam Shahrour Summer Course « Smart and Sustainable City »  Chapter...
Professor Isam Shahrour Summer Course « Smart and Sustainable City » Chapter...
Isam Shahrour
 
Is the PH power supply ready for the AEC?
Is the PH power supply ready for the AEC?Is the PH power supply ready for the AEC?
Is the PH power supply ready for the AEC?
Bienvenido "Nonoy" Oplas, Jr.
 
Download Australia solar power sector future outlook 2020
Download Australia solar power sector future outlook 2020Download Australia solar power sector future outlook 2020
Download Australia solar power sector future outlook 2020
KuicK Research
 
Australia solar power sector future outlook 2020
Australia solar power sector future outlook 2020Australia solar power sector future outlook 2020
Australia solar power sector future outlook 2020
Rajesh Sarma
 
Sunpowerd - Distributed Solar in Ghana
Sunpowerd - Distributed Solar in GhanaSunpowerd - Distributed Solar in Ghana
Sunpowerd - Distributed Solar in GhanaAlex Pischalnikov
 
The Evolution Of The Australian Electricity Market
The Evolution Of The Australian Electricity MarketThe Evolution Of The Australian Electricity Market
The Evolution Of The Australian Electricity Market
Ian McLeod
 
Singapore Energy Scenerio
Singapore Energy ScenerioSingapore Energy Scenerio
Singapore Energy Scenerio
Jasbir Arora
 
Vietnam, a hidden gem in power development & investing
Vietnam, a hidden gem in power development & investingVietnam, a hidden gem in power development & investing
Vietnam, a hidden gem in power development & investing
Phat Nguyen
 
RELIABILITY AND IMPROVEMENT OF ELECTRIC POWER GENERATION AND DISTRIBUTION ( I...
RELIABILITY AND IMPROVEMENT OF ELECTRIC POWER GENERATION AND DISTRIBUTION ( I...RELIABILITY AND IMPROVEMENT OF ELECTRIC POWER GENERATION AND DISTRIBUTION ( I...
RELIABILITY AND IMPROVEMENT OF ELECTRIC POWER GENERATION AND DISTRIBUTION ( I...
Austin Ola Oshin Zechariah
 
Renewable Energy Technology Overview and Market Trends
Renewable Energy Technology Overview and Market Trends Renewable Energy Technology Overview and Market Trends
Renewable Energy Technology Overview and Market Trends
Mirzo Ibragimov
 
Smart Regulation for a 21st Century Energy System_Australian Clean Energy Sum...
Smart Regulation for a 21st Century Energy System_Australian Clean Energy Sum...Smart Regulation for a 21st Century Energy System_Australian Clean Energy Sum...
Smart Regulation for a 21st Century Energy System_Australian Clean Energy Sum...
TransGrid AU
 

Similar to IFN AiE Presentation May16 web (20)

Electricity Overview
Electricity OverviewElectricity Overview
Electricity Overview
 
ISO New England Slides Used During Jan 16, 2016 Webinar
ISO New England Slides Used During Jan 16, 2016 WebinarISO New England Slides Used During Jan 16, 2016 Webinar
ISO New England Slides Used During Jan 16, 2016 Webinar
 
Independent Review of the Australian National Electricity Market
Independent Review of the Australian National Electricity MarketIndependent Review of the Australian National Electricity Market
Independent Review of the Australian National Electricity Market
 
Firebox Wind-Gas Paper
Firebox Wind-Gas PaperFirebox Wind-Gas Paper
Firebox Wind-Gas Paper
 
Power blackouts with special reference to july 2013 copy
Power blackouts with special reference to july 2013   copyPower blackouts with special reference to july 2013   copy
Power blackouts with special reference to july 2013 copy
 
AECT Electricity 101
AECT Electricity 101AECT Electricity 101
AECT Electricity 101
 
Opportunities for wind energy in NSW
Opportunities for wind energy in NSWOpportunities for wind energy in NSW
Opportunities for wind energy in NSW
 
Investment in solar and wind generation in australia lessons learned
Investment in solar and wind generation in australia   lessons learnedInvestment in solar and wind generation in australia   lessons learned
Investment in solar and wind generation in australia lessons learned
 
Presentation (group)
Presentation (group)Presentation (group)
Presentation (group)
 
Professor Isam Shahrour Summer Course « Smart and Sustainable City » Chapter...
Professor Isam Shahrour Summer Course « Smart and Sustainable City »  Chapter...Professor Isam Shahrour Summer Course « Smart and Sustainable City »  Chapter...
Professor Isam Shahrour Summer Course « Smart and Sustainable City » Chapter...
 
Is the PH power supply ready for the AEC?
Is the PH power supply ready for the AEC?Is the PH power supply ready for the AEC?
Is the PH power supply ready for the AEC?
 
Download Australia solar power sector future outlook 2020
Download Australia solar power sector future outlook 2020Download Australia solar power sector future outlook 2020
Download Australia solar power sector future outlook 2020
 
Australia solar power sector future outlook 2020
Australia solar power sector future outlook 2020Australia solar power sector future outlook 2020
Australia solar power sector future outlook 2020
 
Sunpowerd - Distributed Solar in Ghana
Sunpowerd - Distributed Solar in GhanaSunpowerd - Distributed Solar in Ghana
Sunpowerd - Distributed Solar in Ghana
 
The Evolution Of The Australian Electricity Market
The Evolution Of The Australian Electricity MarketThe Evolution Of The Australian Electricity Market
The Evolution Of The Australian Electricity Market
 
Singapore Energy Scenerio
Singapore Energy ScenerioSingapore Energy Scenerio
Singapore Energy Scenerio
 
Vietnam, a hidden gem in power development & investing
Vietnam, a hidden gem in power development & investingVietnam, a hidden gem in power development & investing
Vietnam, a hidden gem in power development & investing
 
RELIABILITY AND IMPROVEMENT OF ELECTRIC POWER GENERATION AND DISTRIBUTION ( I...
RELIABILITY AND IMPROVEMENT OF ELECTRIC POWER GENERATION AND DISTRIBUTION ( I...RELIABILITY AND IMPROVEMENT OF ELECTRIC POWER GENERATION AND DISTRIBUTION ( I...
RELIABILITY AND IMPROVEMENT OF ELECTRIC POWER GENERATION AND DISTRIBUTION ( I...
 
Renewable Energy Technology Overview and Market Trends
Renewable Energy Technology Overview and Market Trends Renewable Energy Technology Overview and Market Trends
Renewable Energy Technology Overview and Market Trends
 
Smart Regulation for a 21st Century Energy System_Australian Clean Energy Sum...
Smart Regulation for a 21st Century Energy System_Australian Clean Energy Sum...Smart Regulation for a 21st Century Energy System_Australian Clean Energy Sum...
Smart Regulation for a 21st Century Energy System_Australian Clean Energy Sum...
 

IFN AiE Presentation May16 web

  • 1. Renewable Energy in the NEM Presentation to the Australian Institute of Energy May 16, 2016
  • 2. Agenda Arial Bold 28pt 2 • Global Renewable Energy Market • Renewables in Australia • South Australia • NSW • Progress towards meeting the LRET • Future Energy/Climate policy options • Conclusion Presenter: Jonathan Upson Senior Development & Government Affairs Manager Agenda
  • 3. 3 Location: New South Wales Status: Operational January 2010 Installed Capacity: 140.7MW Turbine: 67 Suzlon 2.1MW S88 Location: Western Australia Status: Operational January 2006 Installed Capacity: 89.1MW Turbine: 54 NEG Micon NM82 Location: South Australia Status: Operational March 2005 Installed Capacity: 80.5MW Turbine: 46 Vestas V66 Location: South Australia Status: Operational September 2008 Installed Capacity: 159.0MW Turbine: 53 Vestas V90 Location: South Australia Status: Operational June 2010 Installed Capacity: 39.0MW Turbine: 13 Vestas V90 Location: New South Wales Status: Operational October 2011 Installed Capacity: 48.3MW Turbine: Suzlon 2.1MW S88 Infigen - Australia’s leading wind energy business ALINTA LAKE BONNEY 2 LAKE BONNEY 1 LAKE BONNEY 3 WOODLAWN CAPITAL
  • 4. 4 Infigen Energy’s NSW Investment • Operational – $374 Million Capital Wind Farm near Bungendore, NSW – $115 Million Woodlawn Wind Farm, near the Capital Wind Farm – Capital East Solar PV Demo/Energy Storage Facility • Planning Approved – 70-100 MW Capital II Wind Farm – 100 MW Bodangora Wind Farm – 120 MW Flyers Creek Wind Farm – 37 MW Capital Solar PV Project – 40 MW Manildra Solar PV Project
  • 5. Wind Energy was #1 for new build worldwide in 2015 5 More wind energy capacity was installed in 2015 than any other electricity generation technology
  • 6. Renewable technologies made up over 60% of electricity capacity additions worldwide in 2015 6 Renewable Energy Investments: Major Milestones Reached New World Record Set United Nations Environment Programme, Bloomberg New Energy Finance March 14, 2016
  • 7. Is there another industry in the world with such a high and sustained rate of growth? 7 Global Wind Energy Outlook 2015 Global Wind Energy Council April 2016
  • 8. Renewable energy is approaching 40% of SA’s electricity generation 8South Australian Historical Market Information Report AEMO August 2015 Wind Solar PV Coal Gas Interconnector
  • 9. Emissions have declined by 22% in the past four years 9South Australian Historical Market Information Report AEMO August 2015
  • 10. Electricity emissions rising significantly after declining 16% in five years 10cedex Pitt & Sherry November 2015
  • 11. Wind was the dominant source of SA electricity for ten days last year 11 0% 10% 20% 30% 40% 50% 60% 70% 80% 90% 100% 110% SA Generation by Fuel Type as % of SA Demand - 04/05/2015 to 13/05/2015 Wind % Gas % Brown Coal % Infigen graph of AEMO data
  • 12. 12 Wind generation is very predictable NEM wind generation is forecast with 97-98% accuracy one hour ahead of time 12 1-NMAE (%) Data from Figure 64, 100% Renewables Study – Draft Modelling Outcomes, AMEO April 2013 NMAE: Normalised Mean Absolute Error
  • 13. AEMO Data: Wind energy lowers wholesale prices in SA 13 2014 South Australian Electricity Market Economic Trends AEMO, September 2014
  • 14. Simplified Wholesale Electricity Market Bid Stack 14 Electricity Demand 4,000 Electricty Volume (MW) GAS (CCGT) - $60/MWh 2,500 2,000 1,500 1,000 500 6am 8am 10am Noon 2pm 4pm 6pm 8pm 10pm GAS (OCGT) - $150/MWh WIND - $5/MWh COAL - $35/MWh Average Electricity Price = ~ $70/MWh
  • 15. Same Bid Stack with A Bit More Wind Generation More expensive generation not needed 15 Electricity Demand 4,000 Electricty Volume GAS (CCGT) - $60/MWh (MW) 2,500 2,000 1,500 1,000 500 6am 8am 10am Noon 2pm 4pm 6pm 8pm 10pm GAS (OCGT) - $150/MWh WIND - $5/MWh COAL - $35/MWh Average Electricity Price = ~ $45/MWh
  • 16. Inverse relationship of wind generation to pool prices clearly demonstrated earlier this month 16 Infigen graph of AEMO data
  • 17. Six independent electricity market modelling studies have shown the LRET does not raise electricity prices • ACIL Allen’s modelling for the Warburton Review confirmed the earlier results from SKM (Jacobs), Schneider Electric, ROAM, IES, and Bloomberg • All six studies generated similar results; reducing the LRET causes: – Retail prices to decrease by a small amount in the short term – Followed by retail prices increasing by a larger amount in the medium - long term • The AiGroup, representing over 60,000 businesses, recognised this in their RET Review submission, and in a more recent media release – “Across the board, analysis of the RET has concluded that large reductions in the target would leave energy users worse off.” 17
  • 18. Causes of South Australia’s high wholesale electricity prices • Lack of effective competition in generation • Over 95% of dispatchable generation relies on increasingly expensive gas – Rising, volatile gas prices resulting from LNG exports • SA is interconnected to only one State – NSW and Victoria are connected to multiple States which is beneficial • SA has the highest peak to average load ratio of any State – Resulting in ‘additional’ peaking plants and power lines that are rarely used 18
  • 19. 19 There is significant competition in the Australian Wind Energy Market Australian Wind Farm Owners (operating MW)1 Ecogeneration and company websites (2015). Infigen Energy 14% China State Power Investment 10% Trustpower 9% Shenhua/ Hydro Tas 8% Acciona 6% Malakoff 5% Morrison 5% UBS IIF/REST 5% Meridian 5% Goldwind/Jingeng 4% InfrastructureCapital Group 4% Energy Infrastructure Investments 3% AGL 3% Wind Prospects 3% Mitsui 3% 20 Others 13%
  • 20. South Australian thermal generation market is not very competitive 20 Generation capacity and retail offtake data from State of the Energy Market 2015 AER December, 2015
  • 21. EUAA recognises a lack of competition in SA 21
  • 22. Queensland – another less than competitive electricity market • Queensland had the highest wholesale electricity prices in the NEM for FY15 – $52.18 (vs $39.38 for SA) • Similar situation to SA---two dominant generators (Stanwell and CS Energy) – These state owned generators own almost 2/3 of the State’s generation capacity • AER states “generators including Stanwell, CS Energy and Callide periodically rebid large volumes of capacity from low to very high prices late in a trading interval.” – Ernst & Young estimated late re-bidding added $7-8/MWh to Queensland price cap contracts in the six months up to March 2015 (AER) • Queensland had the highest prices in FY15, but they have negligible wind generation – Wind farms did not cause Queensland to have the highest wholesale prices last FY 22 Source for AER statements: State of the Energy Market 2015 AER December, 2015
  • 23. Expensive peaking plant generation in SA has declined as wind energy penetration increased 23 Peaking Capacity, CO2-e Emissions and Pricing in the South Australian Electricity Grid with High Wind Penetration 2005-2013 Dr David Osmond, Luke Osborne Windlab Systems May 2014
  • 24. SA was much more reliant on interconnectors before wind farms 24 Plotted from AEMO data -500 0 500 1000 1500 2000 2500 3000 FY03 FY04 FY05 FY06 FY07 FY08 FY09 FY10 FY11 FY12 FY13 FY14 FY15 Wind Capacity (MW) Net Interconnector Imports (GWh)
  • 25. SA Electricity System Reliability • “…about 95 per cent of reliability issues in the NEM originate in the distribution network sector.”1 – Only 5% of outages are caused by issues in the high voltage transmission network or electricity generation plants • While AEMO continues to evaluate potential future SA electricity market issues, – “AEMO has not identified any system security challenges that cannot be managed through existing processes and procedures” in conjunction with the closure of the Norther Power Station2 25 1 State of the Energy Market 2015 AER December 2015 2 Update to Renewable Energy Integration in South Australia AEMO and Electranet February 2016
  • 26. Frequency Control & Ancillary Services (FCAS) • The FCAS market procures services to maintain electricity network frequency at 50Hz – Normal FCAS charges for all of SA are typically less than $35/hour • FCAS can be ‘imported’ via interconnectors; therefore, provision of FCAS is a non-issue when the Heywood interconnector is operational • Likewise, system inertia (which reduces the rate of frequency change) can be supplied over an interconnector – Historically, the Heywood interconnector has tripped about once every two years • For several weeks in Q4 of last year, SA FCAS charges exceeded $25 Million during scheduled outages of one circuit of the Heywood interconnector – These charges were shared roughly 50/50 between electricity customers and SA generators • The Australian Energy Regulator in their report1 made it clear the two primary causes for the excessive FCAS prices were: – AEMO implemented changes to established FCAS protocols with little warning to market participants and customers – Late rebidding of capacity from low to very high prices by two market participants 26 1 Report into Market ancillary service prices above $5000 South Australia, 11, 12 and 25 October 2015 AER December 2015
  • 27. Power outage in SA on November 1st • Line two of the Heywood interconnector was off-line for scheduled work as part of the interconnector upgrade • Line one of the interconnector “tripped when an automated test signal was unexpectedly interpreted by the new relay as a trip signal.” • AEMO makes it clear in their report that there was no relationship between the power outage and wind farms in SA • There were delays reconnecting SA to the NEM caused by difficulties stabilising the SA electricity network frequency at 50Hz – However, AEMO also makes it clear in their report that these difficulties were caused by issues with thermal generators---not wind farms 27 Source: Load Shedding in South Australia on Sunday 1 November 2015 AEMO February 2016
  • 28. 28 Installed Wind Energy Capacity by State Clean Energy Report 2014.,CEC June 2015 NSW currently ranks 4th for wind farm investment and jobs NSW NSWNSW
  • 29. NSW forecast to achieve the largest share of renewable investment over the next decade 29 RET Review Modelling ACIL Allen August 2014
  • 30. Renewables in NSW • NSW has 660 MW of wind energy installed today – Two large wind farms committed to be built in the New England region of NSW – Goldwind’s 175 MW White Rock and CWP’s 260MW Sapphire wind farm • NSW is leading the country with 175MW of installed large-scale solar projects – Together, wind and large scale solar make up about 5% of NSW’s generation • In 2014, about 11% of NSW’s electricity came from renewable sources – NSW REAP calls for 20% of electricity to come from renewables by 2020 • In order to meet the bi-partisan 33TWh LRET target, the CEC estimates that about 6000MW of new generation capacity worth $10 Billion and creating 6500 jobs are required by 2020 – NSW should capture about half of these new jobs and investment 30
  • 31. Retailers have only 4 options to meet their legislated LRET obligations 1. Build large-scale renewable developments they own (as AGL has largely done) 2. Purchase, and then build, developments from other companies 3. Negotiate Power Purchase Agreements (PPAs) with developers enabling them to finance and build projects 4. Purchase LGCs from the spot market – The Clean Energy Regulator, and energy analysts, have made it clear that this is not a viable option for the three large retailers The first three options have a 18-24 month lead time
  • 32. Clean Energy Regulator’s RET Annual Statement 32
  • 34. Renewables penetration by State in 2014 34Clean Energy Report 2015 CEC June 2015
  • 35. Can the rest of the NEM accommodate SA’s market share of renewables? • South Australia accommodates 40% variable RE market share today without significant issues • Current LRET target of 33TWh (~23% RE) can also be achieved without significant technical issues or economic impact for customers • Other States will not approach SA’s variable RE market share for at least 10 years without very significant changes to current policies • In less than 10 years, higher levels of renewables will be facilitated by – Solar Thermal which will be more cost competitive – ‘Baseload’ renewables automatically providing FCAS and inertia – Large-scale battery storage which will almost certainly be cost competitive – Other technologies will also contribute 35
  • 36. Facilitating the energy transformation/modernisation • There are significant disincentives for older, more polluting generators exiting the market – First mover disadvantage – Significant redundancy/remediation costs – Lose ability to realise higher prices/payouts which they hope might occur • Several proposals on the table to ‘encourage’ high emitting power stations past their use-by-date to close – Brown Coal generator paid to close from levy on remaining coal generators (Frank Jotzo, ANU) – Change Safeguard mechanism to reduce electricity emissions (Grattan) – Emissions Intensity Scheme (AEMC) – Regulatory Closure (based on age?, emissions?) • It is more important that effective bi-partisan action is taken that will survive the next election(s) than which mechanism is selected 36
  • 37. Preliminary CCA modelling of electricity abatement options 37 Report urging carbon tax on power withheld Peter Hannam www.smh.com.au May 6, 2016
  • 38. LRET found to be the most efficient wind energy support scheme in the world 38 International support for onshore wind Frontier Economics (UK) June 2013. PPP: purchasing power parity
  • 39. In summary 39 Consumer Price Index and Retail Electricity Prices
  • 40. Conclusion • It’s clear there is serious momentum to decarbonise electricity generation around the world • South Australia is not an experiment that has gone wrong – Renewables apply downward pressure on wholesale electricity prices – There is no threat to the security of supply today (AEMO) – Electricity emissions have declined dramatically • There are no technical issues, or significant economic impacts of, achieving the LRET target of 33TWh in 2020 • Higher levels of renewables penetration will be facilitated by new technologies (solar thermal, batteries, etc.) – Modernisation of Australia’s electricity generation fleet will occur 40