Download to read offline

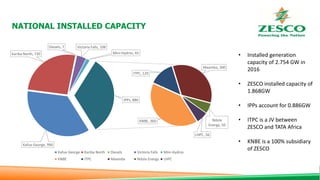
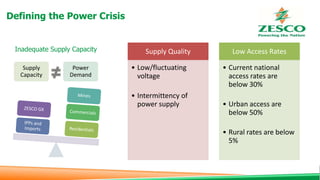
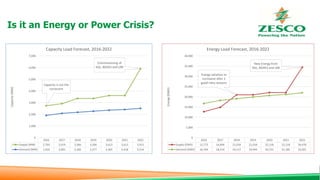
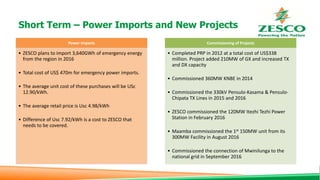
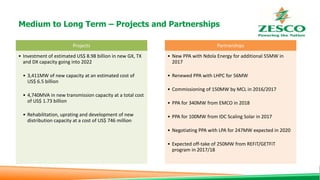
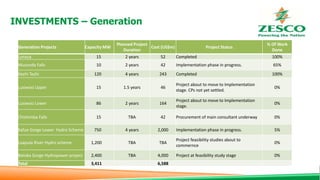
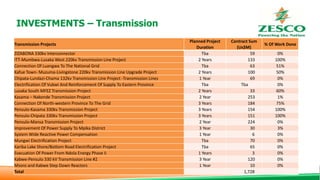
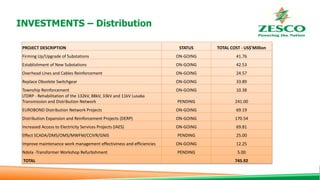
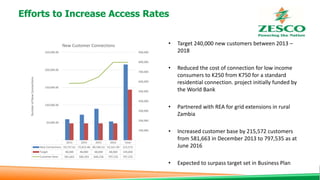

The document summarizes Zambia's power crisis and ZESCO's responses. It defines the crisis as inadequate supply capacity, fluctuating power quality, and low access rates. ZESCO is addressing this through short-term power imports, commissioning new generation and transmission projects, and medium-to-long term projects and partnerships totaling billions. ZESCO is also working to increase access rates from below 30% currently to over 240,000 new connections by 2018, having already connected over 215,000 customers since 2013.


