Download as PDF, PPTX


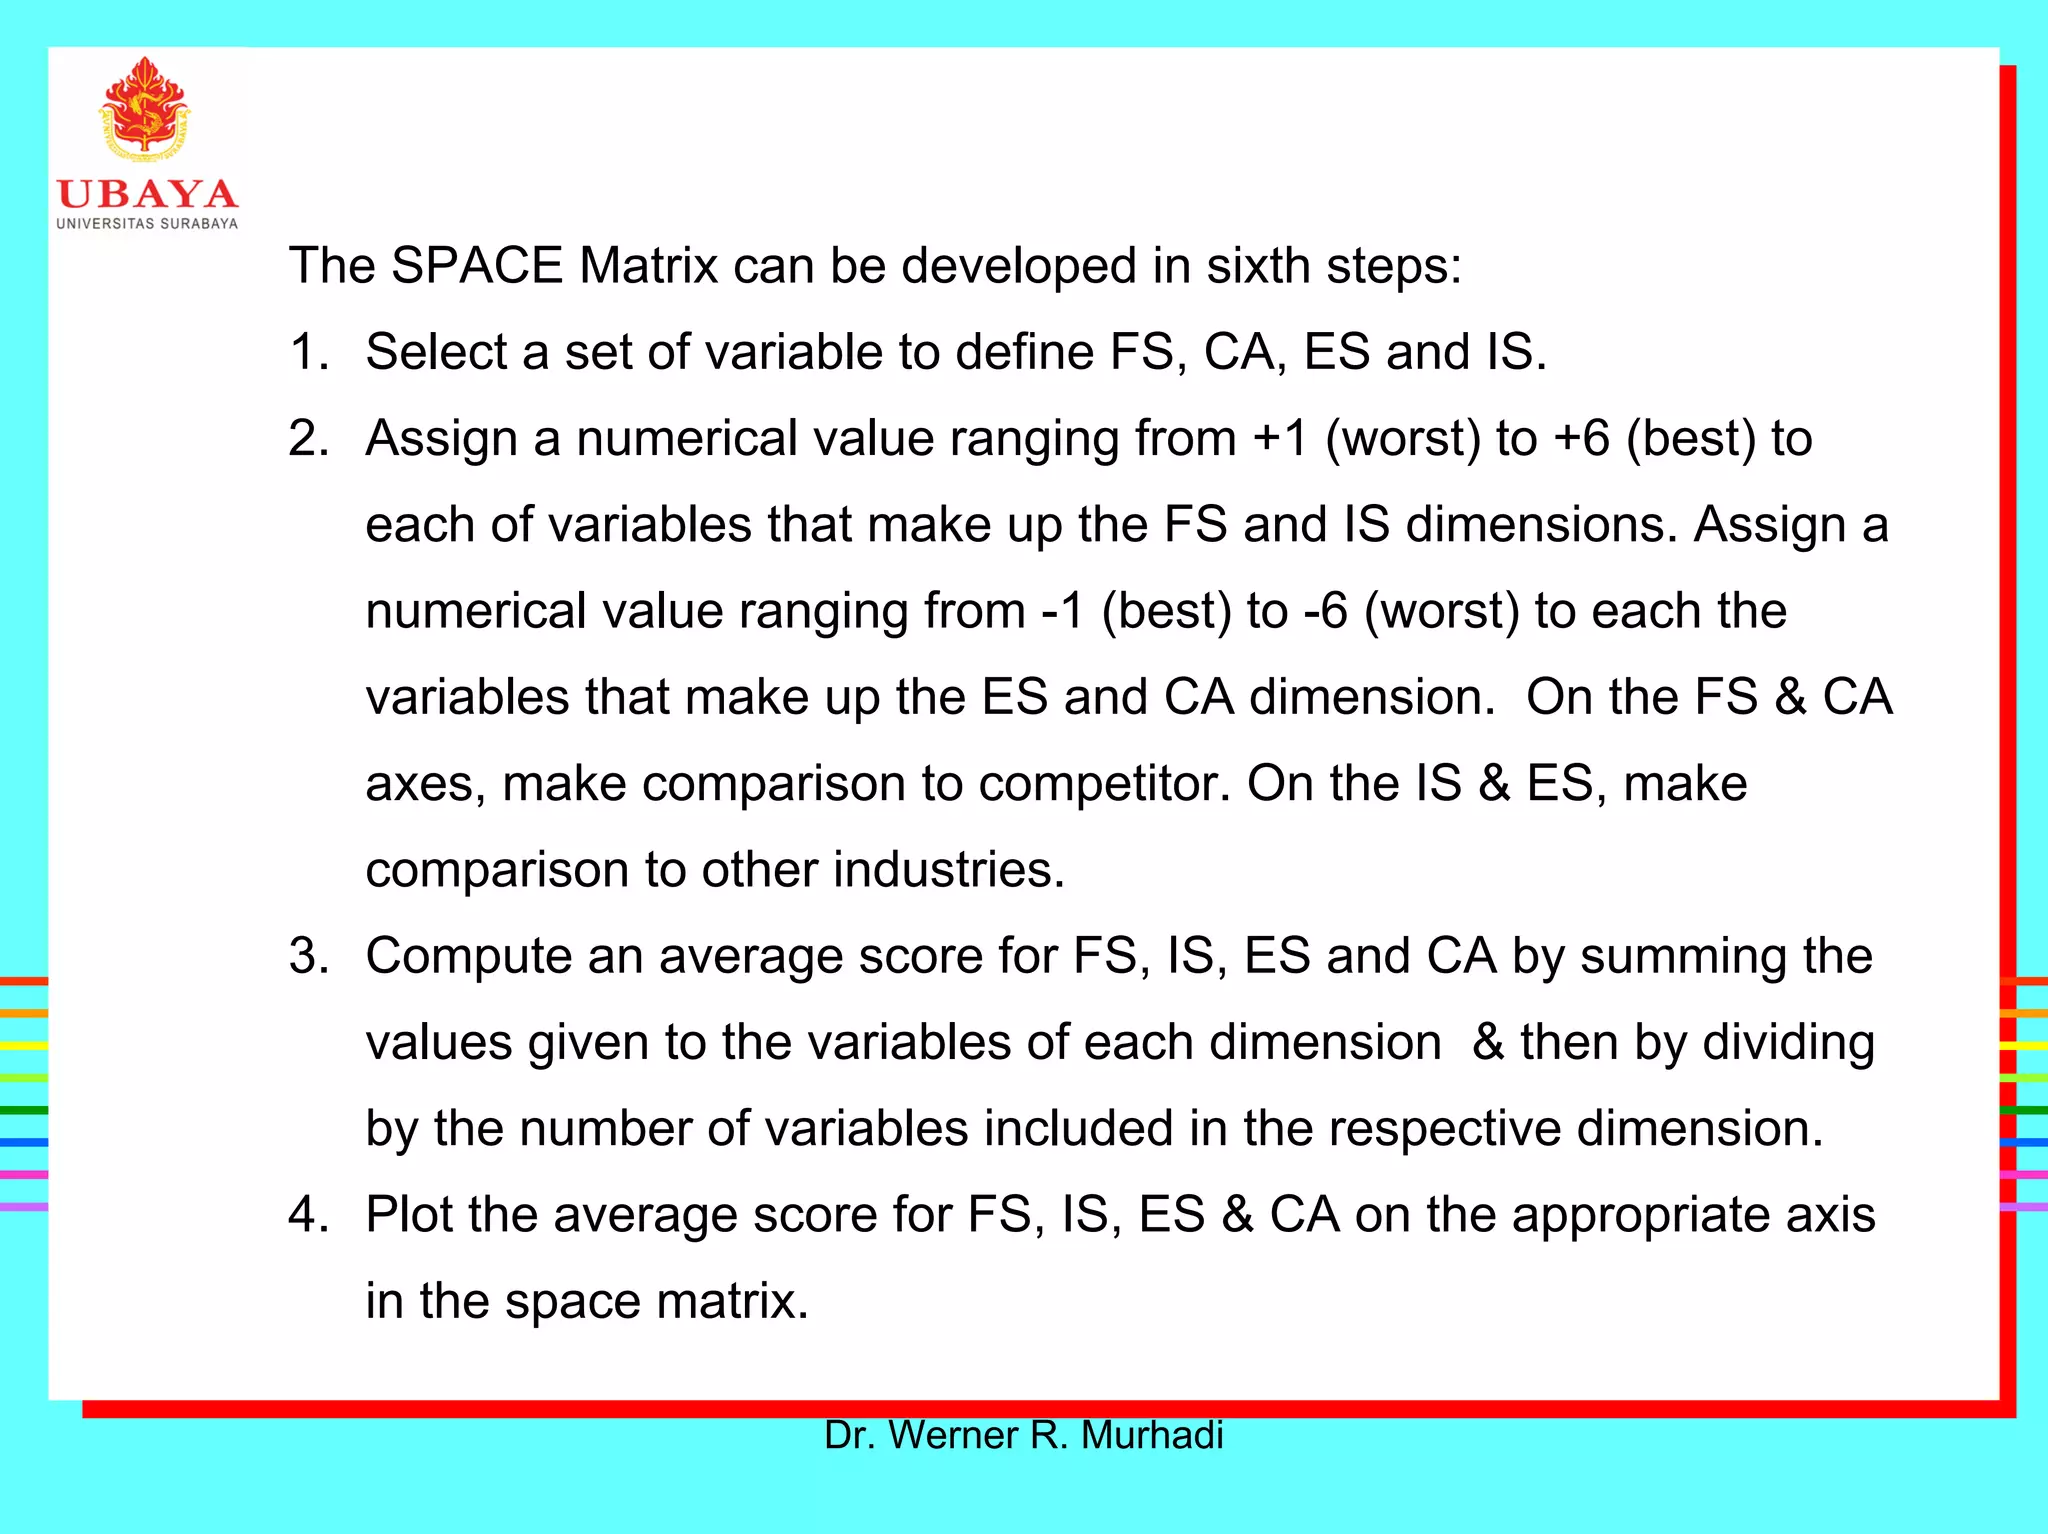


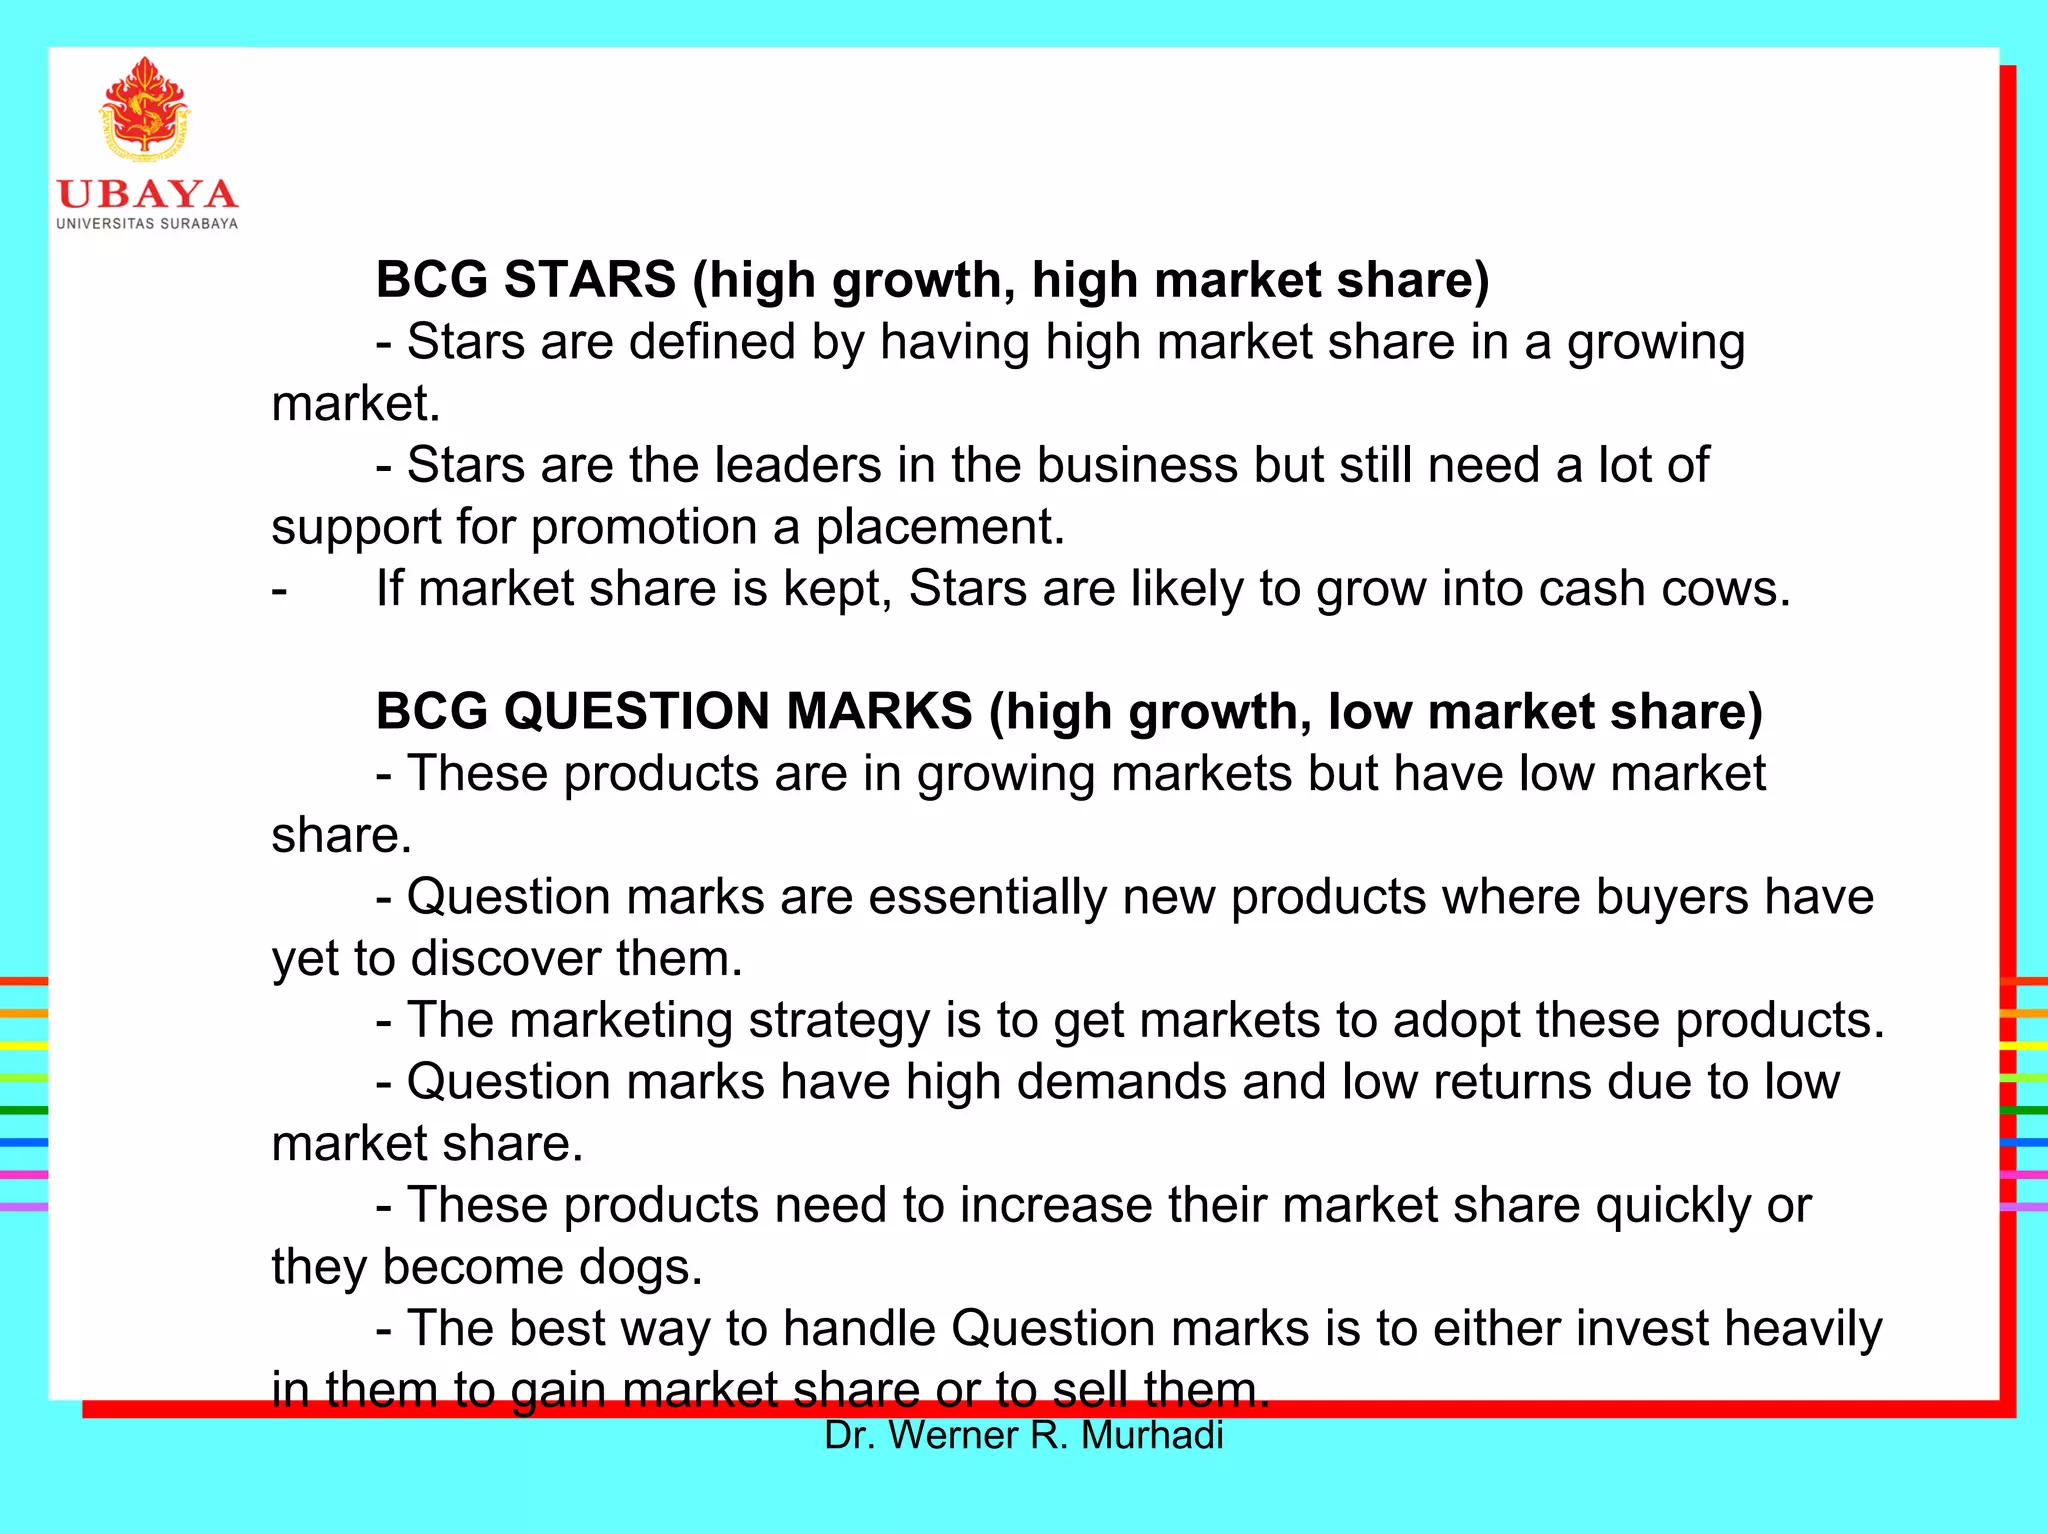


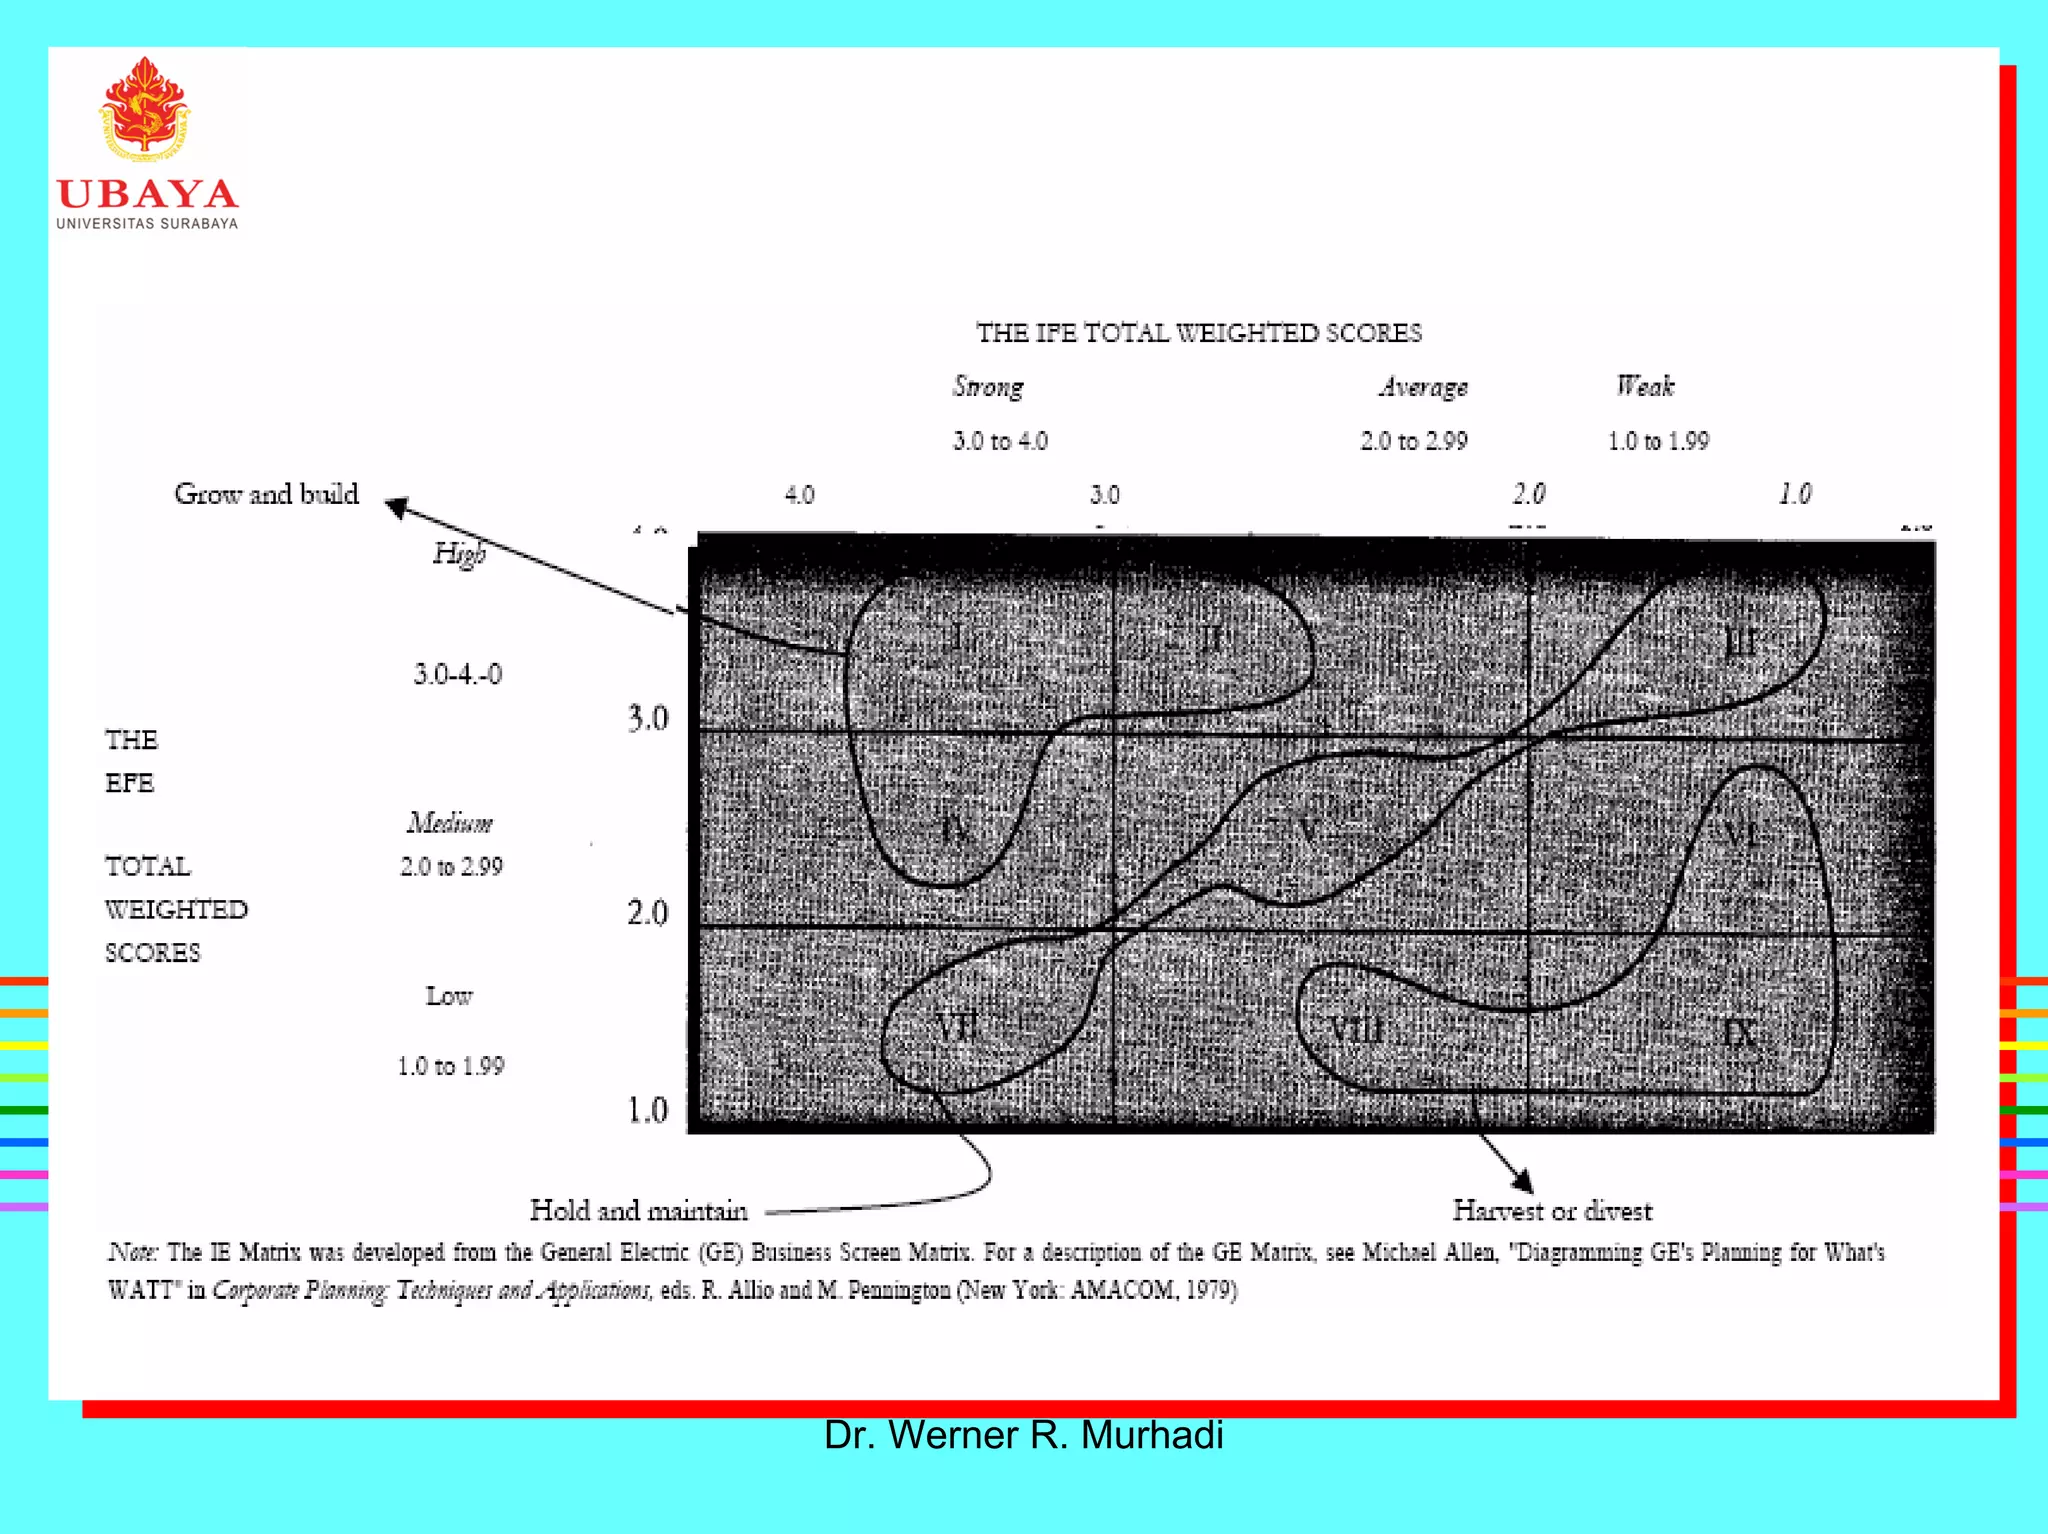


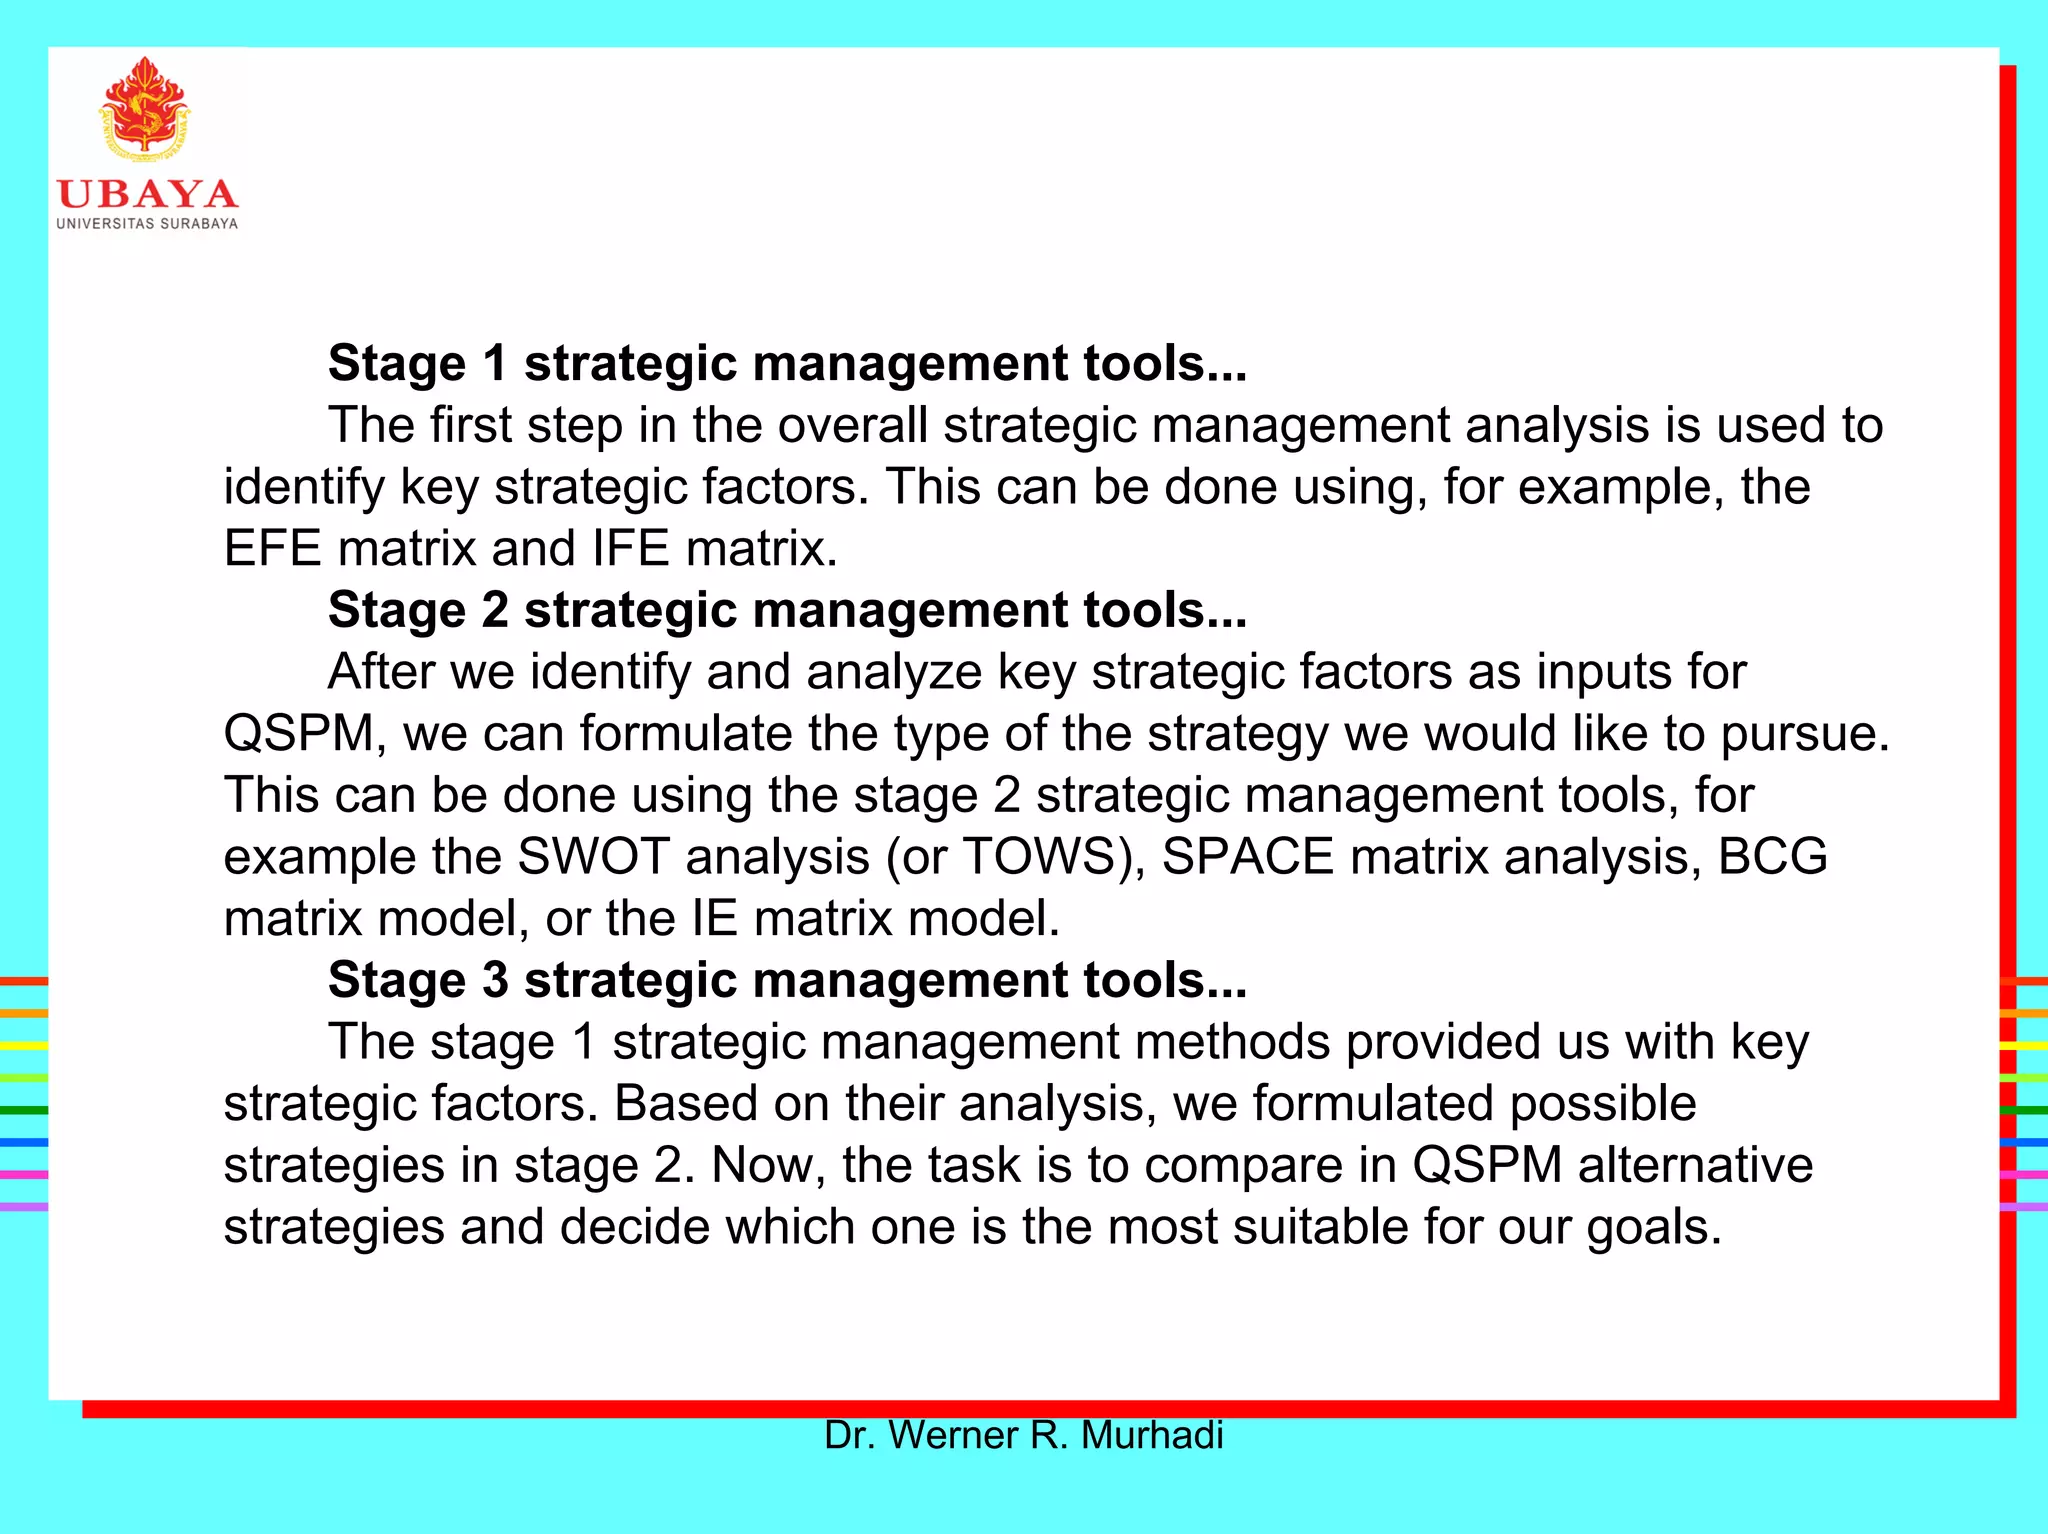


This document outlines Dr. Werner R. Murhadi's comprehensive strategic management model. It includes sections on strategic formulation, including developing a strategic vision and business mission, external and internal audits, setting objectives, and evaluating and selecting strategies. For strategic formulation, the document discusses what a vision and mission statement are, provides examples, and outlines the external audit which includes a PEST analysis and Porter's five forces model. It also describes conducting internal audits based on a resource-based view and using matrices like the EFE, IFE, and competitive profile matrix. Additional strategy tools discussed include the TOWS matrix, SPACE matrix, BCG matrix, and IE matrix.


