Download to read offline


![The Global VC/PE Country Attractiveness Index
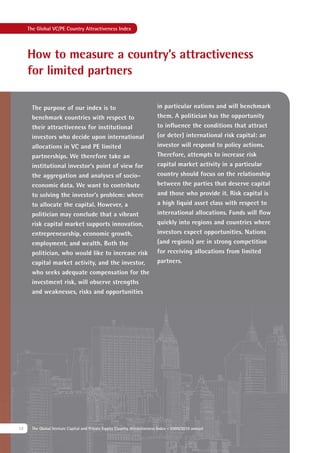
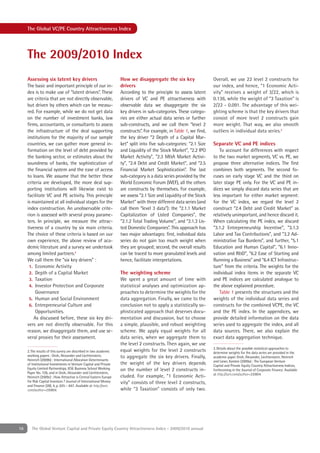
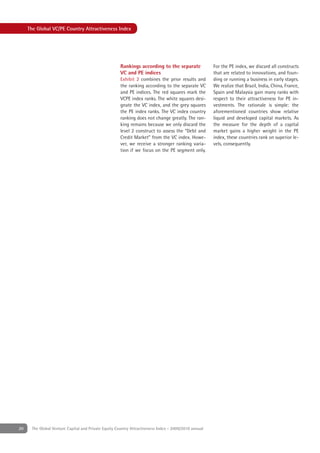
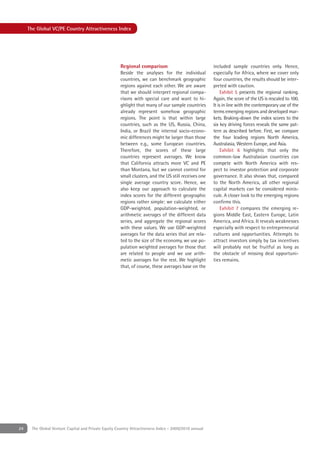
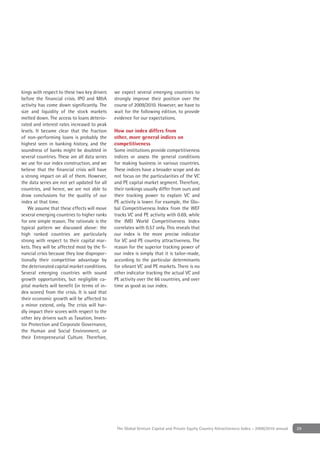
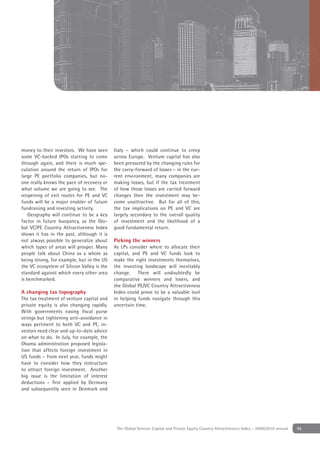
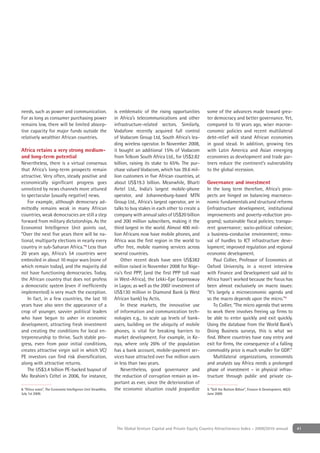
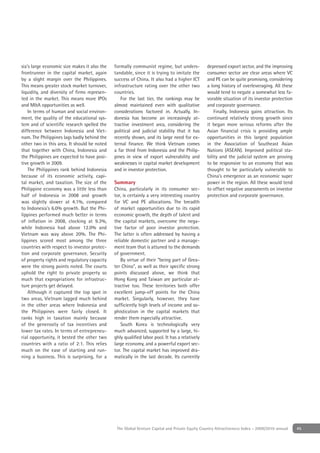
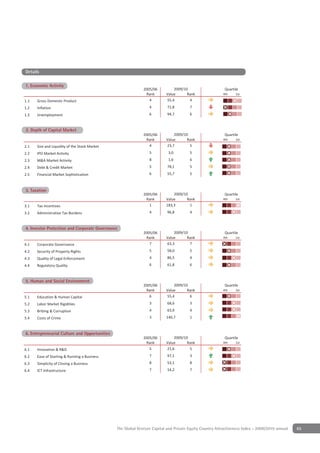
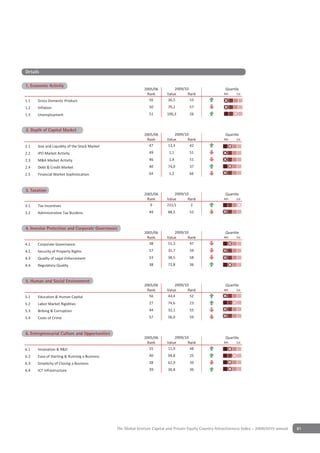
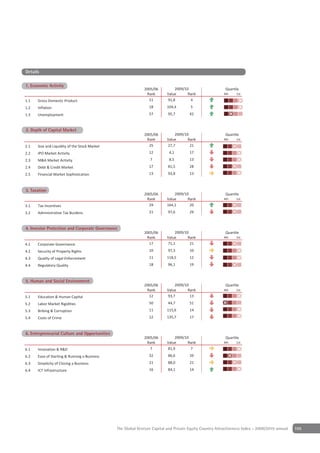
Historic comparison – improvements Exhibit 8 underscores what we are used
of VCPE investment conditions to learning from daily news about China,
We can calculate back the index to the and India. Additionally, Poland impro-
past, as far as 2005/2006. Thereby, we ved its attractiveness for limited partners
should note that some of the data series quite substantially during the last four
used (e.g., the General Innovation Index years. For details, we refer to the indivi-
[GII]) do not date back to 2005. However, dual country analyses in the appendix of
we assume that indicators like this one this index. On the left axis of Exhibit 8, we
did not change to a large extent over the find the countries’ current ranks and the
period of interest, and hence, keep them bars document the rank changes between
constant. The calculation of the 2005/2006 the 2005/2006 and the 2009/2010 index
index allows interesting insights, and re- versions. Kuwait, Latvia, and Oman are
veals the development and rank changes the countries that decreased remarkably
of particular countries. in their rankings. Kuwait lost many ranks
because of a tax reform with increasing
corporate tax rates and deteriorating
conditions regarding the protection of in-
vestors and corporate governance. Latvia
and Oman were both exposed to worse-
ning economic conditions with high in-
flation during the observed period. Howe-
ver, it should be stressed that the index
scores are always calculated relative to
the other countries. That means that all
the countries that lost ranking positions
did not necessarily deteriorate their in-
vestment conditions in absolute terms.
They might just have been outperformed
by others in the international competition
for capital resources.
26 The Global Venture Capital and Private Equity Country Attractiveness Index - 2009/2010 annual](https://image.slidesharecdn.com/iesevcpeindexannual2009-110326195513-phpapp02/85/Iese-vcpe-index_annual_2009-25-320.jpg)


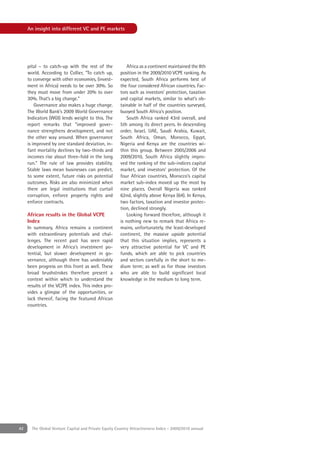


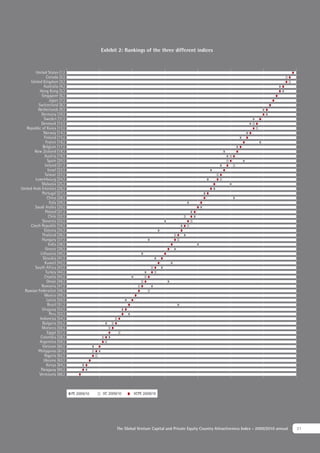
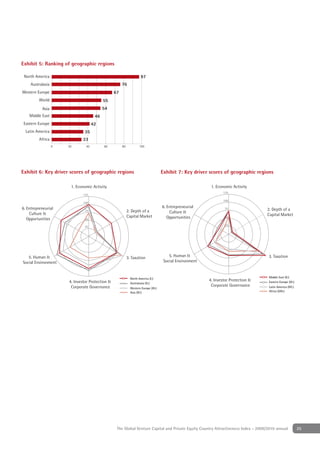
![Regional and country profiles
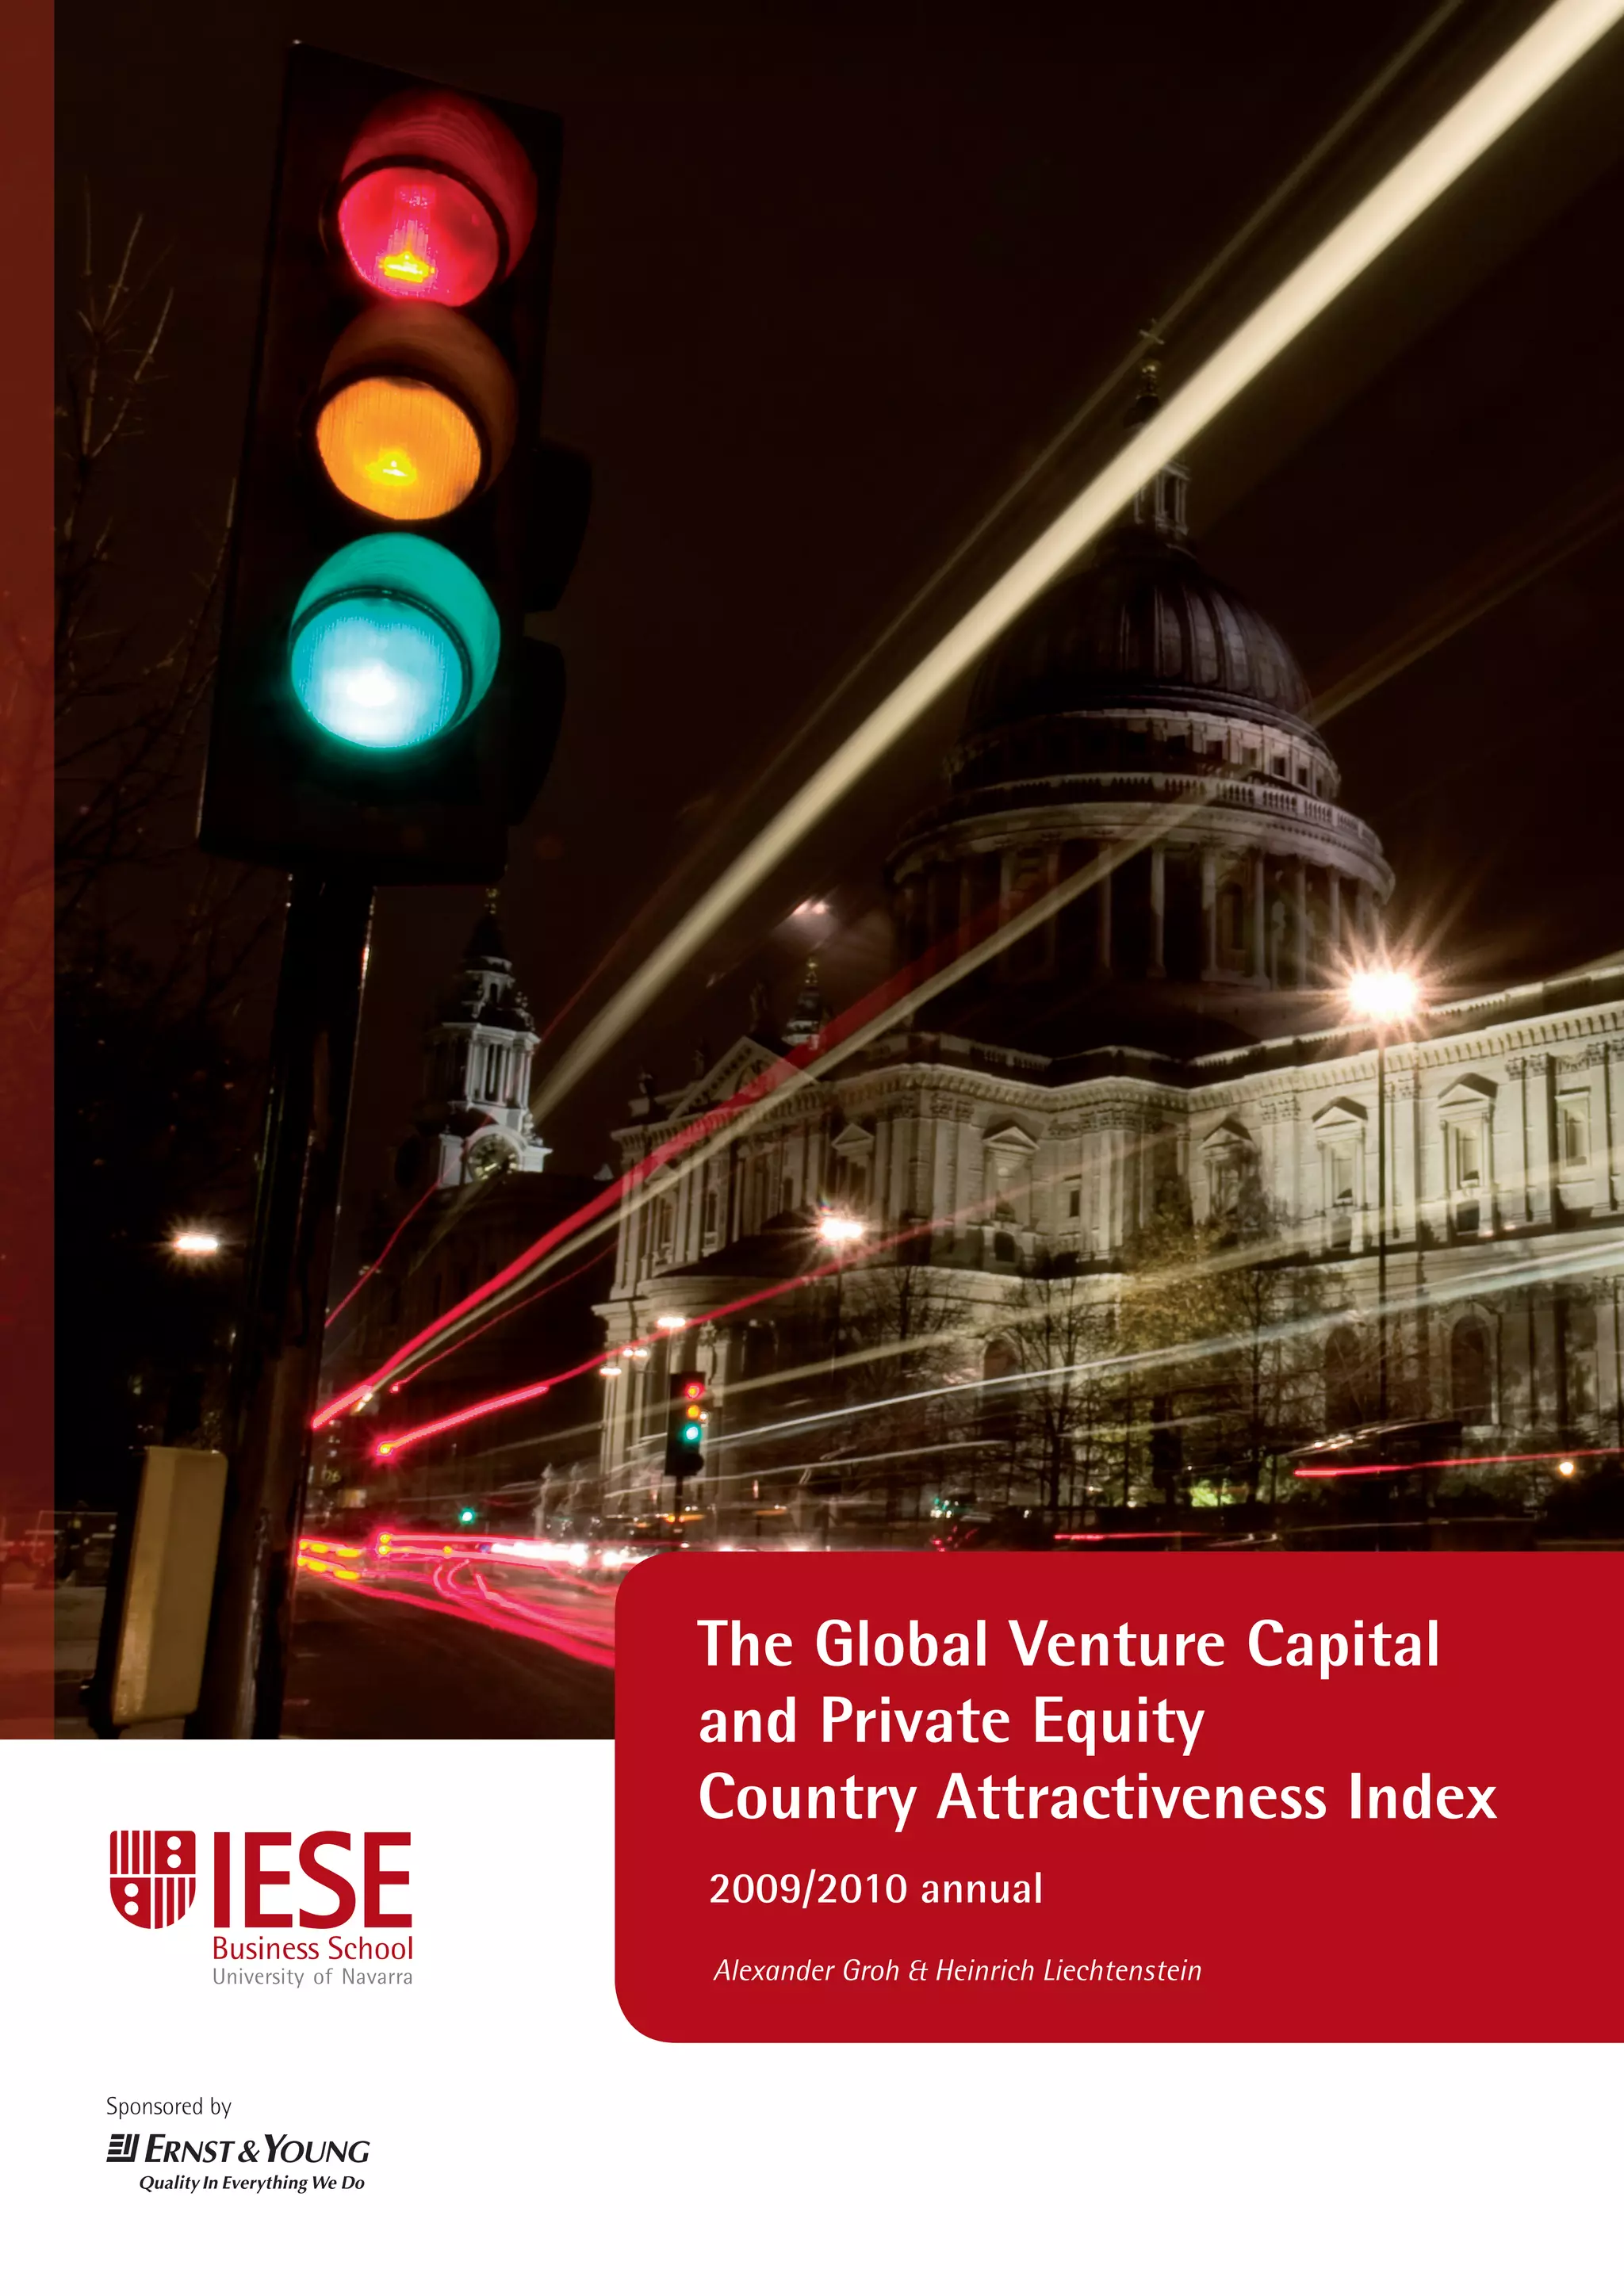
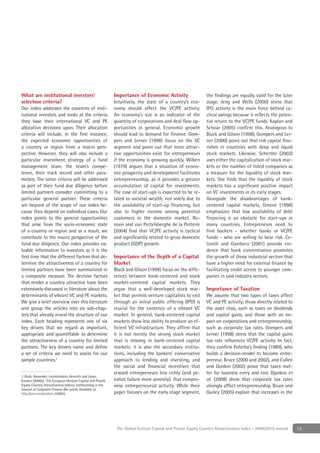
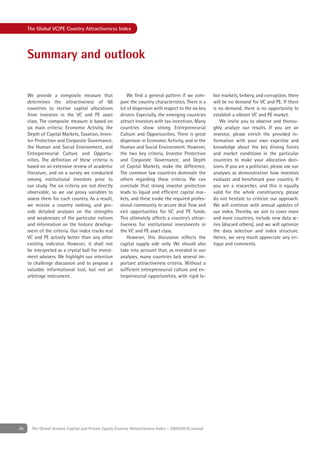
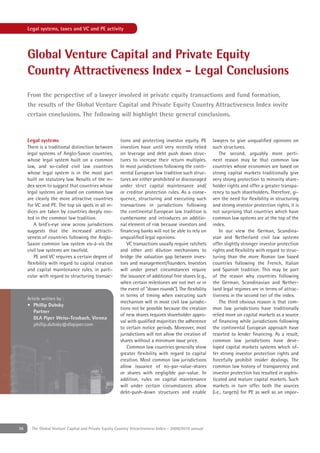
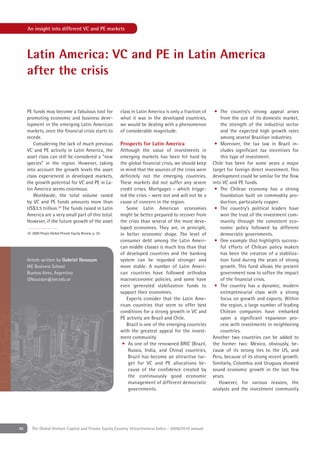
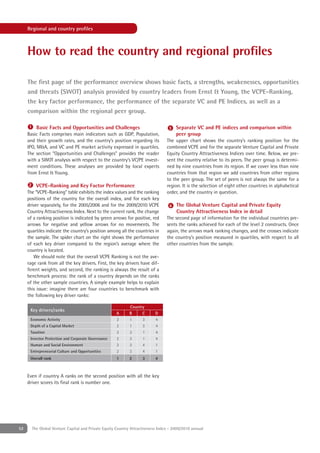
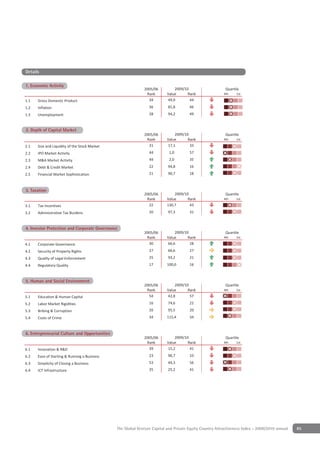
Africa
Basic Facts VCPE-Ranking Details
2005/06 2009/10 Quar le
1 VCPE Ranking
Rank Value Rank
8 33,2 8
4th 1st
2 4 y
1. Economic Activity
2005/06
Rank
2009/10
Value Rank
Quartile
4th 1st
Econom c Ac 8 53,9 8 8 31,5 8
1.1 Gross Domestic Product
Depth of Cap. Market 6 10,9 6 8 65,7 8
1.2 Inflation
Taxa on 7 103,6 7 8 75,7 8
1.3 Unemployment
In . Prot. & Corp. Go . 7 53,6 7
Hum. & Soc. En . 8 48,5 7
2 Depth of Capital Market
2. Depth of Capital Market
Quar le
4th 1st Entrepr. Culture & Opp. 8 22,2 8 2005/06 2009/10 Quartile
GDP 613 [bn USD] IPO Volume Rank Value Rank 4th 1st
Popul on 271 [mn] M&A Volume
GDP Growth VC 2.1 Size and Liquidity of the Stock Market 6 19,1 6
'02 '08
Pop. Growth '02 '08 PE Key Factors Performance 8 1,4 8
2.2 IPO Market Activity
Econom c 2.3 M&A Market Activity 7 1,6 8
Ac t
125 2.4 Debt & Credit Market 7 67,2 7
SWOT Analysis 100
2.5 Financial Market Sophistication 5 54,4 6
Entrepr. Culture 75 Depth of Cap.
Strengths & Opp. 50
Market
• Continued economic growth across the continent 25
Depth of Capital Market
3 Taxation
3. Taxation
• Increased stability and favorable policies shifted perceptions of 0 2005/06 2009/10 Quartile
Rank Value Rank 4th 1st
the region
3.1 Tax Incentives 7 122,7 6
• Before the financial crisis, investor confidence in Africa was Hum. & Soc.
Taxa on
increasing, as was Africa's understanding of the VC/PE offering En ronment 3.2 Administrative Tax Burdens 6 87,4 7
Weaknesses Afr ca
In . Prot. & 4 Investor Protection and Corporate Governance
• Large geographical region characterized by significant differences Corp. Go .
Worl 4. Investor Protection & Corporate Governance
United States = 100 Points 2005/06 2009/10 Quartile
in culture, language, legal and regulatory systems across the
Rank Value Rank 4th 1st
continent
Separate VC and PE Indices 4.1 Corporate Governance 4 71,5 5
• Small number of pan-African funds competing with larger
number of regional specialists 4.2 Security of Property Rights 7 46,4 7
0
• Transaction activity is driven by a few countries, mainly South
Africa and Nigeria
• VC/PE is dependent on foreign investors who often prefer other
1
2
3 4.3
4.4
Quality of Legal Enforcement
Regulatory Quality
7
8
52,4
47,5
7
8
3
emerging markets
Index Rank
• Preference of debt and public equity markets over VC/PE funding 4 5 Human & Social Environment
5. Human and Social Environment
5 2005/06 2009/10 Quartile
Opportunities 6
Rank Value Rank 4th 1st
• Historical underinvestment in infrastructure and resources, and 5.1 Education & Human Capital 7 48,9 7
7
growing adoption of PPPs by African governments 5.2 Labor Market Rigidities 5 64,5 5
8
• Under-banked population with rising incomes, improved access to 8 31,3 8
9 5.3 Bribing & Corruption
credit and increasing spending tendencies
2005/06 2006/07 2007/08 2008/09 2009/10 5.4 Costs of Crime 8 56,2 8
Threats VC PE VCPE
• A protracted global recovery could limit growth across the
continent and restrict financing and fund raising initiatives Comparison within Peer Group 6 Entrepreneurial Culture and Opportunities
6. Entrepreneurial Culture & Opportunities
2005/06 2009/10 Quartile
• Political risk, lack of transparency and immature regulatory and Rank Value Rank 4th 1st
legal systems are likely to continue to act as barriers to VC/PE 2005/06 2009/10 Quar le
6.1 Innovation & R&D 7 10,5 7
activity Rank Value Rank 4th 1st
North Amer ca 1 96,9 1 6.2 Ease of Starting & Running a Business 6 73,4 7
Outlook 6.3 Simplicity of Closing a Business 5 58,2 7
Austr a 2 76,4 2
• Recovery from recession in Africa may lag global recovery 8 5,4 8
Western Europe 3 67,5 3 6.4 ICT Infrastructure
• PE investment activity expected to increase again in 2010
As a 4 53,5 4
Graham Stokoe, Associate Director, Ernst & Young South Africa M e East 5 45,9 5
Eastern Europe 6 41,9 6
n Amer ca 7 34,9 7
Afr ca 8 33,2 8
54 The Global Venture Capital and Private Equity Country Attractiveness Index - 2009/2010 annual The Global Venture Capital and Private Equity Country Attractiveness Index - 2009/2010 annual 55
The Global Venture Capital and Private Equity Country Attractiveness Index - 2009/2010 annual 53](https://image.slidesharecdn.com/iesevcpeindexannual2009-110326195513-phpapp02/85/Iese-vcpe-index_annual_2009-52-320.jpg)
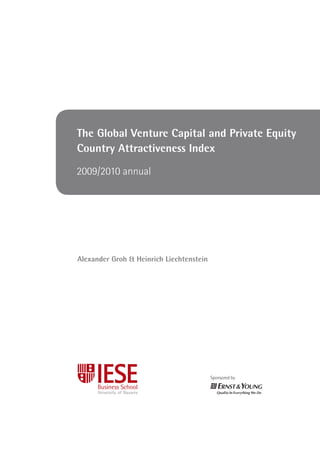
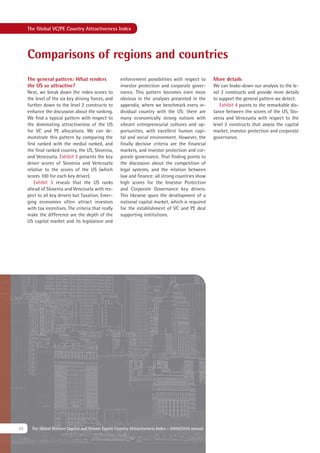
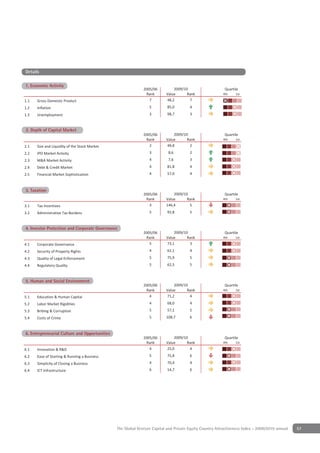
![Regional and country profiles
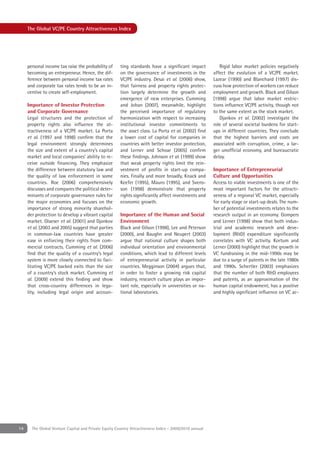
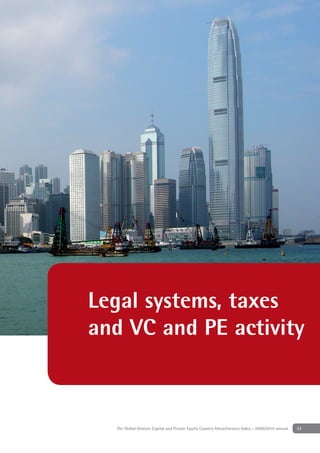
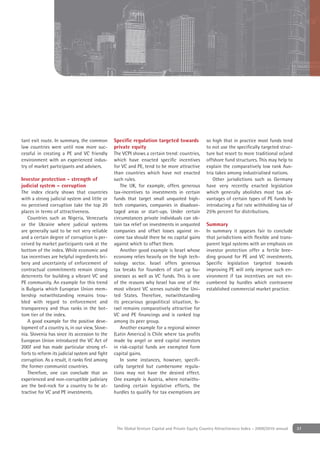
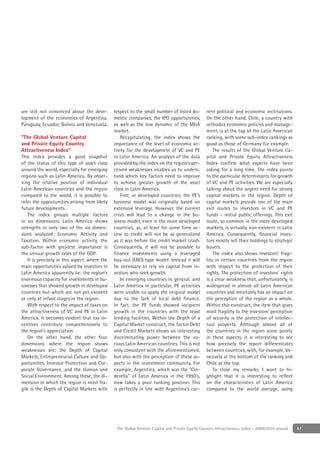
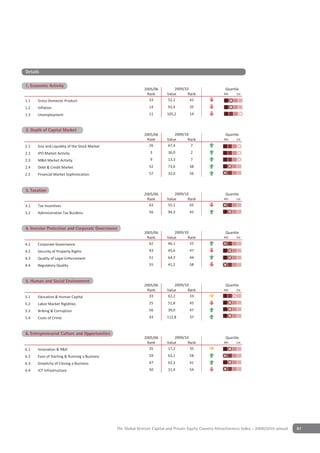
Africa
Basic Facts VCPE-Ranking
2005/06 2009/10 Quar le
Rank Value Rank 4th 1st
VCPE Ranking 8 33,2 8
Econom c Ac 8 53,9 8
Depth of Cap. Market 6 10,9 6
Taxa on 7 103,6 7
In . Prot. & Corp. Go . 7 53,6 7
Hum. & Soc. En . 8 48,5 7
Quar le
4th 1st Entrepr. Culture & Opp. 8 22,2 8
GDP 613 [bn USD] IPO Volume
Popul on 271 [mn] M&A Volume
GDP Growth '02 '08 VC
Pop. Growth '02 '08 PE Key Factors Performance
Econom c
Ac t
125
SWOT Analysis 100
Entrepr. Culture 75 Depth of Cap.
Strengths & Opp. 50
Market
• Continued economic growth across the continent 25
• Increased stability and favorable policies shifted perceptions of 0
the region
• Before the financial crisis, investor confidence in Africa was Hum. & Soc.
Taxa on
increasing, as was Africa's understanding of the VC/PE offering En ronment
Weaknesses Afr ca
• Large geographical region characterized by significant differences In . Prot. & Worl
Corp. Go . United States = 100 Points
in culture, language, legal and regulatory systems across the
continent
• Small number of pan-African funds competing with larger Separate VC and PE Indices
number of regional specialists 0
• Transaction activity is driven by a few countries, mainly South
1
Africa and Nigeria
2
• VC/PE is dependent on foreign investors who often prefer other
3
emerging markets
Index Rank
4
• Preference of debt and public equity markets over VC/PE funding
5
Opportunities 6
• Historical underinvestment in infrastructure and resources, and
7
growing adoption of PPPs by African governments
8
• Under-banked population with rising incomes, improved access to
9
credit and increasing spending tendencies
2005/06 2006/07 2007/08 2008/09 2009/10
Threats VC PE VCPE
• A protracted global recovery could limit growth across the
continent and restrict financing and fund raising initiatives Comparison within Peer Group
• Political risk, lack of transparency and immature regulatory and
legal systems are likely to continue to act as barriers to VC/PE 2005/06 2009/10 Quar le
activity Rank Value Rank 4th 1st
North Amer ca 1 96,9 1
Outlook
Austr a 2 76,4 2
• Recovery from recession in Africa may lag global recovery
• PE investment activity expected to increase again in 2010 Western Europe 3 67,5 3
As a 4 53,5 4
Graham Stokoe, Associate Director, Ernst & Young South Africa M e East 5 45,9 5
Eastern Europe 6 41,9 6
n Amer ca 7 34,9 7
Afr ca 8 33,2 8
54 The Global Venture Capital and Private Equity Country Attractiveness Index - 2009/2010 annual](https://image.slidesharecdn.com/iesevcpeindexannual2009-110326195513-phpapp02/85/Iese-vcpe-index_annual_2009-53-320.jpg)

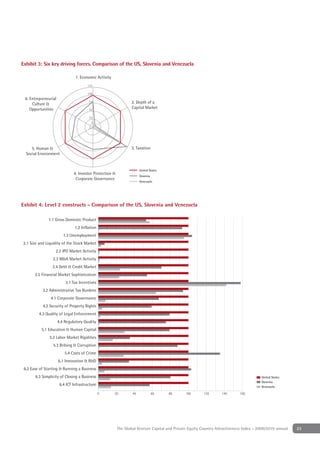
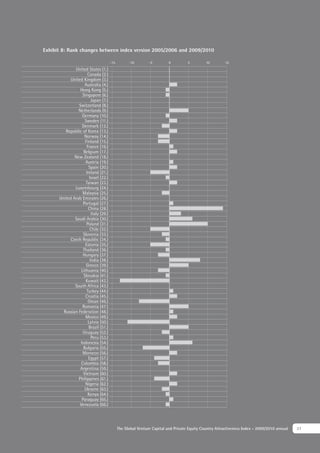
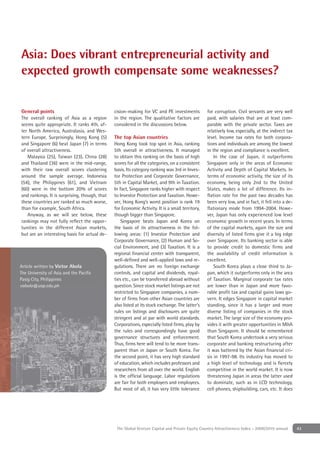
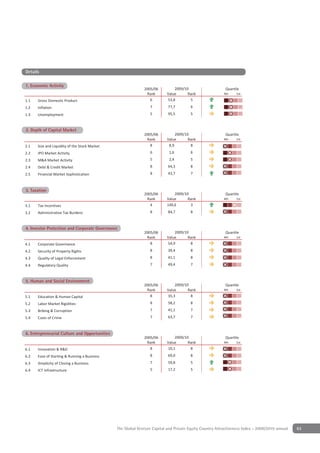
![Regional and country profiles
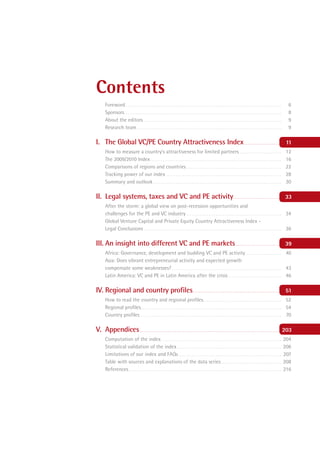
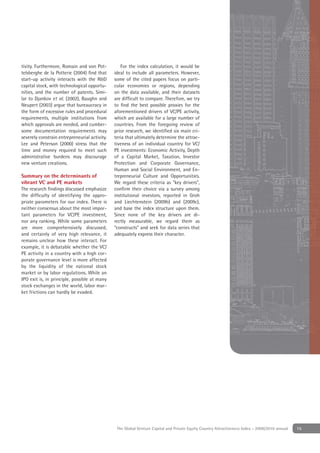
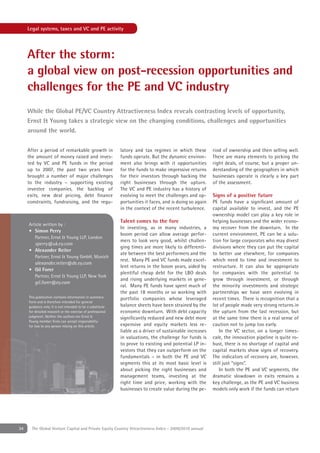
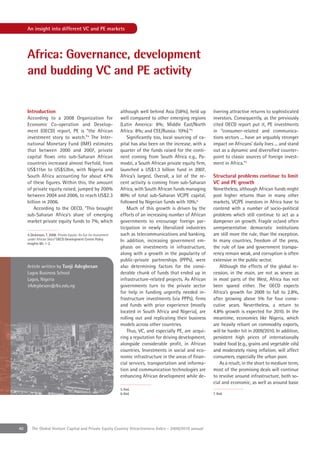
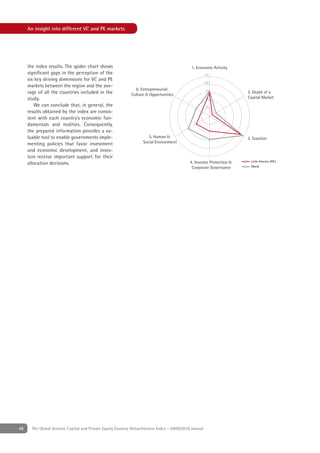
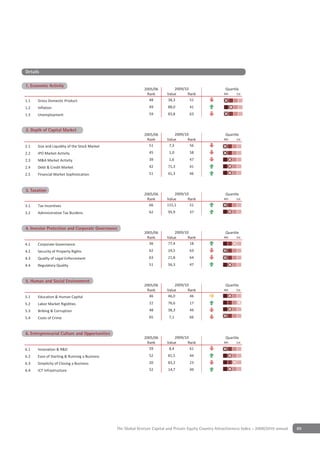
Asia
Basic Facts VCPE-Ranking
2005/06 2009/10 Quar le
Rank Value Rank 4th 1st
VCPE Ranking 4 53,5 4
Econom c Ac t 5 73,9 4
Depth of Cap. Market 4 27,3 3
Taxa on 5 116,5 4
In . Prot. & Corp. Go . 4 68,1 4
Hum. & Soc. En . 5 74,0 5
Quar le
4th 1st Entrepr. Culture & Opp. 4 37,4 5
GDP 14941 [bn USD] IPO Volume
Popula on 3379 [mn] M&A Volume
GDP Growth '02 '08 VC Ac t
Pop. Growth '02 '08 PE Ac t Key Factors Performance
Econom c
Ac t
125
100
SWOT Analysis
Entrepr. Culture 75 Depth of Cap.
& Opp. 50
Market
Strengths
• Very large and powerful economic region 25
• Market leading technologies in many sectors, cost leadership in others 0
• Comparative advantages in terms of labor costs and productivity
• Abundance of natural resources, well-educated workforce and Hum. & Soc.
Taxa on
En ronment
skilled labors
Weaknesses As a
In . Prot. & Worl
• Persistent administrative inefficiencies Corp. Go .
United States = 100 Points
• VC/PE investors are seen critically regarding their commitment to
the companies’ interests
• Relatively weak corporate governance compared to Western standards Separate VC and PE Indices
• Export-driven economies 0
• Cultural challenges in achieving control of private enterprises
1
Opportunities
• Succession issues in family owned businesses foster VC/PE
Index Rank
2
investment
• Several fragmented industries with potential for consolidation 3
• Relatively large, young and growing middle-income population in
emerging urban centers 4
Threats
• Increasingly negative sentiment towards the asset class if VC/ 5
2005/06 2006/07 2007/08 2008/09 2009/10
PE investors are not regarded appropriately supporting investee
VC PE VCPE
companies in the current economic climate
• Inadequate power and transport infrastructure in selected areas
• Cultural, ethnical, religious, or even terroristic turmoil in certain regions Comparison within Peer Group
Outlook 2005/06 2009/10 Quar le
• Progress towards greater transparency and global economic integration Rank Value Rank 4th 1st
• Many companies will find it increasingly hard to obtain access North Amer ca 1 96,9 1
to additional capital and will need to deploy their capital more Australas a 2 76,4 2
effectively Western Europe 3 67,5 3
• Many companies will be forced to divest non-core businesses As a 4 53,5 4
• Continuing strong global position in high-tech sector
M le East 5 45,9 5
• Continuing relaxation of restrictions of capital flows
Eastern Europe 6 41,9 6
a n Amer ca 7 34,9 7
Afr ca 8 33,2 8
56 The Global Venture Capital and Private Equity Country Attractiveness Index - 2009/2010 annual](https://image.slidesharecdn.com/iesevcpeindexannual2009-110326195513-phpapp02/85/Iese-vcpe-index_annual_2009-55-320.jpg)
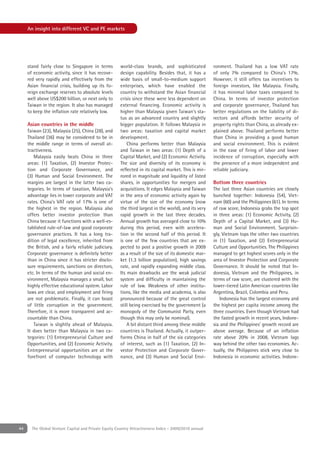
![Regional and country profiles
Australasia
Basic Facts VCPE-Ranking
2005/06 2009/10 Quartile
Rank Value Rank 4th 1st
VCPE Ranking 2 76,4 2
Economic Activity 2 95,5 2
Depth of Cap. Market 2 29,7 2
Taxation 8 104,1 6
Inv. Prot. & Corp. Gov. 1 107,4 1
Hum. & Soc. Env. 1 114,5 1
Quartile Entrepr. Culture & Opp. 2 85,8 2
4th 1st
GDP 1106 [bn USD] IPO Volume
Population 25 [mn] M&A Volume
GDP Growth '02 '08 VC Activity
Pop. Growth '02 '08 PE Activity Key Factors Performance
Economic
Activity
125
SWOT Analysis 100
Entrepr. Culture 75 Depth of Cap.
& Opp. 50
Market
Strengths
25
• Innovation-driven economies with pioneering scientific research
0
institutions and world class R&D facilities
• Strong economy and sound banking/capital/financial market
Hum. & Soc.
systems Environment
Taxation
• Democratic and stable political, regulatory and legal environment
Australasia
Weaknesses Inv. Prot. & World
• Low tax incentives Corp. Gov.
United States = 100 Points
• Performance of VC/PE investee companies facing tough market
conditions
Separate VC and PE Indices
• Slow recovery from the recessionary environment predicted
0
Opportunities
• Strong M&A market with international targets and sound
prospects for exits
1
• Strong stock market culture, providing good IPO opportunities
Index Rank
Threats
• High interest rate environment making current debt raisings 2
difficult
Outlook
• Investment funds are likely to restrict allocation to PE, but the 3
industry will continue to attract capital from other sources 2005/06 2006/07 2007/08 2008/09 2009/10
including sovereign wealth funds and high net worth individuals VC PE VCPE
• Business models and margins continue to be under pressure
• Increasing pressure from LPs to exit less successful investee Comparison within Peer Group
companies
• Financing and acquisition opportunities are expected to increase 2005/06 2009/10 Quartile
Rank Value Rank 4th 1st
North America 1 96,9 1
Australasia 2 76,4 2
Western Europe 3 67,5 3
Asia 4 53,5 4
Middle East 5 45,9 5
Eastern Europe 6 41,9 6
Latin America 7 34,9 7
Africa 8 33,2 8
58 The Global Venture Capital and Private Equity Country Attractiveness Index - 2009/2010 annual](https://image.slidesharecdn.com/iesevcpeindexannual2009-110326195513-phpapp02/85/Iese-vcpe-index_annual_2009-57-320.jpg)

![Regional and country profiles
Eastern Europe
Basic Facts VCPE-Ranking
2005/06 2009/10 Quartile
Rank Value Rank 4th 1st
VCPE Ranking 6 41,9 6
Economic Activity 6 72,6 6
Depth of Cap. Market 7 9,6 8
Taxation 2 123,6 2
Inv. Prot. & Corp. Gov. 6 64,8 6
Hum. & Soc. Env. 6 69,0 6
Quartile
4th 1st Entrepr. Culture & Opp. 5 39,8 4
GDP 2466 [bn USD] IPO Volume
Population 228 [mn] M&A Volume
GDP Growth '02 '08 VC Activity
Pop. Growth '02 '08 PE Activity Key Factors Performance
Economic
Activity
125
SWOT Analysis 100
Entrepr. Culture 75 Depth of Cap.
& Opp. 50
Market
Strengths
25
• High tax incentives among most of the Eastern European
0
countries
• Strong stock market in Poland
Hum. & Soc.
Taxation
Weaknesses Environment
• The financial crisis affected strongly the generally weak capital Eastern Europe
market structure World
Inv. Prot. &
• Lack of experience in connection with structuring and completing Corp. Gov.
United States = 100 Points
complex transactions
• Lack of management teams for MBO situations
Separate VC and PE Indices
Opportunities 0
• Catching-up entrepreneurial culture and opportunities for venture
1
capital investors
• Privatization projects are still going on 2
• Reform of legal systems provides increasing security and
Index Rank
3
attractive environment for VC/PE.
4
Threats
5
• Financial crisis may make funding difficult for local GPs
• Increasingly unstable regulatory and enforcement environment if 6
financial crisis continues for more than two years
7
Outlook 2005/06 2006/07 2007/08 2008/09 2009/10
• Increasing VC/PE focus on privatizations VC PE VCPE
• Continuing regime of tax incentives
• Increasing experience in leverage transactions should these Comparison within Peer Group
reappear post crisis
2005/06 2009/10 Quartile
Dr. Dubsky, Partner, DLA-Piper, Austria Rank Value Rank 4th 1st
North America 1 96,9 1
Australasia 2 76,4 2
Western Europe 3 67,5 3
Asia 4 53,5 4
Middle East 5 45,9 5
Eastern Europe 6 41,9 6
Latin America 7 34,9 7
Africa 8 33,2 8
60 The Global Venture Capital and Private Equity Country Attractiveness Index - 2009/2010 annual](https://image.slidesharecdn.com/iesevcpeindexannual2009-110326195513-phpapp02/85/Iese-vcpe-index_annual_2009-59-320.jpg)

![Regional and country profiles
Latin America
Basic Facts VCPE-Ranking
2005/06 2009/10 Quartile
Rank Value Rank 4th 1st
VCPE Ranking 7 34,9 7
Economic Activity 7 73,6 5
Depth of Cap. Market 8 10,0 7
Taxation 6 112,6 5
Inv. Prot. & Corp. Gov. 8 45,8 8
Hum. & Soc. Env. 7 48,2 8
Quartile
4th 1st Entrepr. Culture & Opp. 7 29,1 7
GDP 3846 [bn USD] IPO Volume
Population 471 [mn] M&A Volume
GDP Growth '02 '08 VC Activity
Pop. Growth '02 '08 PE Activity Key Factors Performance
Economic
Activity
125
SWOT Analysis 100
Entrepr. Culture 75 Depth of Cap.
& Opp. 50
Market
Strengths
25
• The Latin American region has seen a strong increase of economic
0
activity even during the financial crisis
• Strong tax incentives contribute comprehensively to the region’s
appreciation Hum. & Soc.
Taxation
Environment
Weaknesses Latin America
• The dimensions in which the region is most fragile are the capital World
Inv. Prot. &
markets with respect to the small number of listed domestic Corp. Gov.
United States = 100 Points
companies, IPO opportunities, and the low dynamic of the M&A
markets
Separate VC and PE Indices
• Lacking entrepreneurial culture hinders the developed of new
0
companies
1
Opportunities
2
• Some countries have followed Brazil’s lead in cultivating domestic
sources of institutional capital for private equity firms and a 3
Index Rank
number of new funds have been raised with commitments from 4
domestic pension funds 5
• Improvements with respect to law and enforcement bring more
6
security to investors
7
Threats
8
• Investor protection and corporate governance structures are still 2005/06 2006/07 2007/08 2008/09 2009/10
an import issue revealing room for development VC PE VCPE
• Many countries are perceived to have high levels of corruption
Outlook Comparison within Peer Group
• While many economies grow strongly, some others remain under
populist governments 2005/06 2009/10 Quartile
Rank Value Rank 4th 1st
• Lack of basic infrastructure hinders the development on one side,
one the other, this provides investment opportunities North America 1 96,9 1
Australasia 2 76,4 2
Western Europe 3 67,5 3
Asia 4 53,5 4
Middle East 5 45,9 5
Eastern Europe 6 41,9 6
Latin America 7 34,9 7
Africa 8 33,2 8
62 The Global Venture Capital and Private Equity Country Attractiveness Index - 2009/2010 annual](https://image.slidesharecdn.com/iesevcpeindexannual2009-110326195513-phpapp02/85/Iese-vcpe-index_annual_2009-61-320.jpg)
![Regional and country profiles
Middle East
Basic Facts VCPE-Ranking
2005/06 2009/10 Quartile
Rank Value Rank 4th 1st
VCPE Ranking 5 45,9 5
Economic Activity 4 72,2 7
Depth of Cap. Market 5 13,8 5
Taxation 1 133,3 1
Inv. Prot. & Corp. Gov. 5 66,6 5
Hum. & Soc. Env. 4 76,4 4
Quartile
4th 1st Entrepr. Culture & Opp. 6 35,5 6
GDP 1270 [bn USD] IPO Volume
Population 119 [mn] M&A Volume
GDP Growth '02 '08 VC Activity
Pop. Growth '02 '08 PE Activity Key Factors Performance
Economic
Activity
150
125
SWOT Analysis 100
Entrepr. Culture Depth of Cap.
& Opp. 75 Market
Strengths 50
25
• Sufficiently diversified cash rich economies 0
• Relatively robust economic growth
• Steady growing population with "real demand" Hum. & Soc.
Taxation
• Government’s commitment to continuous growth Environment
Middle East
Weaknesses
Inv. Prot. & World
• Weak corporate governance as most businesses are still controlled by Corp. Gov.
families United States = 100 Points
• Underdeveloped legal framework to support VC/PE activity
• Highly dependent on volatile oil prices Separate VC and PE Indices
0
Opportunities
1
• Ideal time to focus on distressed companies with good business
models 2
Index Rank
• Focus on businesses wishing to transform from family business to
3
corporate structure
• Availability of assets at attractive valuations 4
Threats 5
• Economic growth to slow down due to decrease in global tourism
6
industry
2005/06 2006/07 2007/08 2008/09 2009/10
• Managing expectations of existing shareholders/family members a VC PE VCPE
key challenge
• Size and liquidity of stock markets may affect exits
Comparison within Peer Group
• Decrease in availability of private funds as a result of the crisis
• Lack of liquidity impacting setting up new funds 2005/06 2009/10 Quartile
Rank Value Rank 4th 1st
Outlook North America 1 96,9 1
• Global economic downturn to slow down activity in the short term Australasia 2 76,4 2
• Potential for acquiring assets at attractive valuations
Western Europe 3 67,5 3
• Transformations from family run businesses to corporate structures
Asia 4 53,5 4
• IPO markets to re-open as a result of a gradual recovery
Middle East 5 45,9 5
Phil Gandier, Partner, Ernst & Young Middle East Eastern Europe 6 41,9 6
Latin America 7 34,9 7
Africa 8 33,2 8
64 The Global Venture Capital and Private Equity Country Attractiveness Index - 2009/2010 annual](https://image.slidesharecdn.com/iesevcpeindexannual2009-110326195513-phpapp02/85/Iese-vcpe-index_annual_2009-63-320.jpg)
![Regional and country profiles
North America
Basic Facts VCPE-Ranking
2005/06 2009/10 Quartile
Rank Value Rank 4th 1st
VCPE Ranking 1 96,9 1
Economic Activity 1 100,3 1
Depth of Cap. Market 1 82,0 1
Taxation 4 100,8 8
Inv. Prot. & Corp. Gov. 2 101,1 2
Hum. & Soc. Env. 2 106,3 2
Quartile
4th 1st Entrepr. Culture & Opp. 1 99,9 1
GDP 15984 [bn USD] IPO Volume
Population 342 [mn] M&A Volume
GDP Growth '02 '08 VC Activity
Pop. Growth '02 '08 PE Activity Key Factors Performance
Economic
Activity
125
SWOT Analysis 100
Entrepr. Culture 75 Depth of Cap.
& Opp. Market
Strengths 50
• Strong innovation and entrepreneurship culture 25
• Strong US VC/PE market and financial community 0
Weaknesses
Hum. & Soc.
• Financial services have a very large stake of the overall economic Environment
Taxation
output, making the region especially vulnerable to the financial North America
crisis
Inv. Prot. & World
Opportunities Corp. Gov.
United States = 100 Points
• Innovations and fast growth segments such as cleantech, cloud
computing, wireless and security Separate VC and PE Indices
Threats 0
• Succession planning in some funds
• Impact of lack of exits on the ability to raise new or follow on funds
Outlook
Index Rank
• Strong industry with new investment and growth opportunities 1
• The number of players will continue to shrink: less funds will be able
to raise follow-on funds
2
2005/06 2006/07 2007/08 2008/09 2009/10
VC PE VCPE
Comparison within Peer Group
2005/06 2009/10 Quartile
Rank Value Rank 4th 1st
North America 1 96,9 1
Australasia 2 76,4 2
Western Europe 3 67,5 3
Asia 4 53,5 4
Middle East 5 45,9 5
Eastern Europe 6 41,9 6
Latin America 7 34,9 7
Africa 8 33,2 8
66 The Global Venture Capital and Private Equity Country Attractiveness Index - 2009/2010 annual](https://image.slidesharecdn.com/iesevcpeindexannual2009-110326195513-phpapp02/85/Iese-vcpe-index_annual_2009-65-320.jpg)

![Regional and country profiles
Western Europe
Basic Facts VCPE-Ranking
2005/06 2009/10 Quartile
Rank Value Rank 4th 1st
VCPE Ranking 3 67,5 3
Economic Activity 3 93,8 3
Depth of Cap. Market 3 23,3 4
Taxation 3 121,1 3
Inv. Prot. & Corp. Gov. 3 90,5 3
Hum. & Soc. Env. 3 93,3 3
Quartile
4th 1st Entrepr. Culture & Opp. 3 80,2 3
GDP 17763 [bn USD] IPO Volume
Population 403 [mn] M&A Volume
GDP Growth '02 '08 VC Activity
Pop. Growth '02 '08 PE Activity Key Factors Performance
Economic
Activity
125
SWOT Analysis 100
Entrepr. Culture 75 Depth of Cap.
& Opp. 50
Market
Strengths
25
• Large sample of companies and still smaller private capital share
0
than in the USA, which reveals some catch up potential
Weaknesses Hum. & Soc.
Taxation
• There is an ongoing discussion about a new regulatory framework, Environment
which causes uncertainty and might burden investors with Western Europe
additional costs and efforts World
Inv. Prot. &
Corp. Gov.
Opportunities United States = 100 Points
• Europe might recover from the crisis earlier and better than
expected, leaving investors with two “buyers’ years” (2010/2011) Separate VC and PE Indices
similar to 2002/2003
0
Threats
• Regulation together with reputation damages from 2007/2008 1
investments and a deeper crisis than expected might cause a real
Index Rank
shakeout in the industry and damage the VC/PE market for a
longer period 2
Outlook
• It is more likely that we will see something like the 2002/2003 3
activity very soon and Western Europe maturing similar to US
market 15 years ago. Coupled with all the infrastructure and 4
expertise, deals will get sourced and done efficiently 2005/06 2006/07 2007/08 2008/09 2009/10
VC PE VCPE
Florian Huber, Senior Manager, Ernst & Young Germany
Comparison within Peer Group
2005/06 2009/10 Quartile
Rank Value Rank 4th 1st
North America 1 96,9 1
Australasia 2 76,4 2
Western Europe 3 67,5 3
Asia 4 53,5 4
Middle East 5 45,9 5
Eastern Europe 6 41,9 6
Latin America 7 34,9 7
Africa 8 33,2 8
68 The Global Venture Capital and Private Equity Country Attractiveness Index - 2009/2010 annual](https://image.slidesharecdn.com/iesevcpeindexannual2009-110326195513-phpapp02/85/Iese-vcpe-index_annual_2009-67-320.jpg)

![Regional and country profiles
Argentina
Capital: Buenos Aires ++ Official Language: Spanish ++ Currency: Argentine Peso
Basic Facts VCPE-Ranking
2005/06 2009/10 Quartile
Rank Value Rank 4th 1st
VCPE Ranking 59 29,1 59
Economic Activity 51 74,3 42
Depth of Cap. Market 60 6,5 59
Taxation 54 113,7 37
Inv. Prot. & Corp. Gov. 61 30,4 64
Hum. & Soc. Env. 62 44,9 53
Quartile
4th 1st Entrepr. Culture & Opp. 48 29,6 51
GDP 303 [bn USD] IPO Volume
Population 40 [mn] M&A Volume
GDP Growth '02 '08 VC Activity
Pop. Growth '02 '08 PE Activity Key Factors Performance
Economic
Activity
125
SWOT Analysis 100
Entrepr. Culture 75 Depth of Cap.
& Opp. 50
Market
Strengths
25
• Tax advantages on dividends and share transfers
0
Weaknesses
• Many regulatory hurdles to overcome to develop a stronger Hum. & Soc.
Taxation
industry Environment
• Legal framework for fund formation and operation presents Argentina
difficulties, particularly for foreign funds Latin America
Inv. Prot. &
• Corporate governance standards and enforcement remains Corp. Gov.
United States = 100 Points
lengthy and cumbersome
Opportunities Separate VC and PE Indices
• Strength of entrepreneurial dynamism and quality of Argentina’s 52
accounting standards 53
Threats 54
• With the pension system re-nationalisation, institutional 55
Index Rank
investment is now effectively barred from the PE/VC industry 56
• High perception of corruption 57
58
Outlook 59
• The country is underperforming relative to its size and level of 60
development 61
• Improvement in the VC/PE business environment does not appear 62
to be a major near-term priority 2005/06 2006/07 2007/08 2008/09 2009/10
VC PE VCPE
Comparison within Peer Group
2005/06 2009/10 Quartile
Rank Value Rank 4th 1st
Chile 27 45,8 32
Mexico 51 35,8 49
Brazil 56 34,6 51
Uruguay 50 33,4 52
Peru 54 32,4 53
Colombia 55 29,4 58
Argentina 59 29,1 59
Paraguay 66 14,9 65
Venezuela 65 8,9 66
70 The Global Venture Capital and Private Equity Country Attractiveness Index - 2009/2010 annual](https://image.slidesharecdn.com/iesevcpeindexannual2009-110326195513-phpapp02/85/Iese-vcpe-index_annual_2009-69-320.jpg)
![Regional and country profiles
Australia
Capital: Canberra ++ Official Language: English ++ Currency: Australian Dollar
Basic Facts VCPE-Ranking
2005/06 2009/10 Quartile
Rank Value Rank 4th 1st
VCPE Ranking 6 81,9 4
Economic Activity 15 96,7 7
Depth of Cap. Market 5 42,9 4
Taxation 39 106,9 41
Inv. Prot. & Corp. Gov. 10 99,0 11
Hum. & Soc. Env. 6 112,3 5
Quartile
4th 1st
Entrepr. Culture & Opp. 13 86,1 13
GDP 980 [bn USD] IPO Volume
Population 21 [mn] M&A Volume
GDP Growth '02 '08 VC Activity
Pop. Growth '02 '08 PE Activity Key Factors Performance
Economic
Activity
125
SWOT Analysis 100
Entrepr. Culture 75 Depth of Cap.
& Opp. 50
Market
Strengths
25
• Strong economy and sound banking/capital/financial market
0
systems
• Democratic and stable political, regulatory and legal environment
• Government support for foreign investors Hum. & Soc.
Taxation
Environment
• Significant number of VC/PE investments currently under
Australia
management
Inv. Prot. & Australasia
Weaknesses Corp. Gov.
United States = 100 Points
• Competition from both local and overseas investors
• Tax rates are comparatively high
Separate VC and PE Indices
• Performance of VC/PE investee companies facing tough market
conditions 2
• Slow recovery from the recessionary environment predicted
3
Opportunities
• Strong M&A market with international targets and sound
Index Rank
4
prospects for exits
• VC/PE investors have a significant amount of dry powder to make
5
new investments
• Strong stock market listed culture, providing good opportunities
6
for IPO
Threats 7
2005/06 2006/07 2007/08 2008/09 2009/10
• High interest rate environment making current debt raisings
VC PE VCPE
difficult
• Liquidity issues continue to restrict the level and availability of
leverage Comparison within Peer Group
• P2P’s and PIPES are proving more difficult in finding support 2005/06 2009/10 Quartile
from boards/shareholders Rank Value Rank 4th 1st
• Refinance of existing senior debt packages in the next two years Australia 6 81,9 4
Outlook Hong Kong 4 79,5 5
• Business models and margins continue to be under pressure Singapore 5 78,5 6
• Increasing pressure from LPs to exit less successful investee Japan 7 76,5 7
companies Republic of Korea 15 67,5 13
• Financing and acquisition opportunities are expected to increase
New Zealand 18 60,0 18
Bryan Zekulich, Partner, Ernst & Young Australia Taiwan 25 55,3 23
Malaysia 23 54,4 25
China 42 48,5 28
72 The Global Venture Capital and Private Equity Country Attractiveness Index - 2009/2010 annual](https://image.slidesharecdn.com/iesevcpeindexannual2009-110326195513-phpapp02/85/Iese-vcpe-index_annual_2009-71-320.jpg)

![Regional and country profiles
Austria
Capital: Vienna ++ Official Language: German (official nationwide); Slovene, Croatian, Hungarian (each official in one region) ++
Currency: Euro
Basic Facts VCPE-Ranking
2005/06 2009/10 Quartile
Rank Value Rank 4th 1st
VCPE Ranking 20 58,6 19
Economic Activity 17 96,3 8
Depth of Cap. Market 31 11,8 37
Taxation 38 114,7 36
Inv. Prot. & Corp. Gov. 15 93,0 16
Hum. & Soc. Env. 11 103,9 9
Quartile
4th 1st Entrepr. Culture & Opp. 17 76,1 19
GDP 411 [bn USD] IPO Volume
Population 8 [mn] M&A Volume
GDP Growth '02 '08 VC Activity
Pop. Growth '02 '08 PE Activity Key Factors Performance
Economic
Activity
125
SWOT Analysis 100
Entrepr. Culture 75 Depth of Cap.
& Opp. Market
Strengths 50
• Still a niche market which is not as crowded as Germany, while 25
offering a similar, but smaller sample of companies and industries 0
Weaknesses
Hum. & Soc.
• Almost a “closed shop”, which takes a lot of effort to enter for a Environment
Taxation
little deal flow and transactions of smaller size Austria
Opportunities Inv. Prot. & Western Europe
• Austria has a lot of hidden champions and family owned Corp. Gov.
United States = 100 Points
companies with succession problems
Separate VC and PE Indices
Threats
• Regulation together with reputation damages from 2007/2008 15
investments and a deeper crisis than expected might cause a real 16
shakeout in the industry and might damage the VC/PE Market on 17
a longer term 18
Index Rank
19
Outlook
20
• Will stay a niche, but might be used as base for Eastern European 21
acquisitions as Austria offers good resources with respect to the 22
necessary language skills and the cultural understanding. 23
24
Florian Huber, Senior Manager, Ernst & Young Germany 25
2005/06 2006/07 2007/08 2008/09 2009/10
VC PE VCPE
Comparison within Peer Group
2005/06 2009/10 Quartile
Rank Value Rank 4th 1st
Norway 11 66,3 14
Finland 12 65,9 15
France 17 65,2 16
Belgium 19 61,1 17
Austria 20 58,6 19
Ireland 16 58,3 21
Luxembourg 24 54,6 24
Portugal 28 49,5 27
Greece 44 40,7 39
74 The Global Venture Capital and Private Equity Country Attractiveness Index - 2009/2010 annual](https://image.slidesharecdn.com/iesevcpeindexannual2009-110326195513-phpapp02/85/Iese-vcpe-index_annual_2009-73-320.jpg)
![Regional and country profiles
Belgium
Capital: Brussels ++ Official Language: Dutch, French, German ++ Currency: Euro
Basic Facts VCPE-Ranking
2005/06 2009/10 Quartile
Rank Value Rank 4th 1st
VCPE Ranking 19 61,1 17
Economic Activity 26 91,1 16
Depth of Cap. Market 20 15,2 27
Taxation 61 102,8 47
Inv. Prot. & Corp. Gov. 16 92,0 17
Hum. & Soc. Env. 13 101,8 11
Quartile
4th 1st
Entrepr. Culture & Opp. 15 79,4 16
GDP 501 [bn USD] IPO Volume
Population 11 [mn] M&A Volume
GDP Growth '02 '08 VC Activity
Pop. Growth '02 '08 PE Activity Key Factors Performance
Economic
Activity
125
100
SWOT Analysis Entrepr. Culture 75 Depth of Cap.
& Opp. 50
Market
Strengths
25
• Attractive taxation for investors with limited taxation on capital 0
gains and on patent income
• Strong education system resulting in highly skilled workforce and
Hum. & Soc.
important R&D activity Environment
Taxation
Weaknesses Belgium
• Due to the limited size of the deals, takeover opportunities are still Inv. Prot. & Western Europe
fundable from a bank perspective Corp. Gov.
United States = 100 Points
• Prominent role of government backed VC's
Opportunities Separate VC and PE Indices
• Most SMEs are still in private hands
15
• More and more private SMEs are open to external investors
Threats 16
• Available funds within PE sector, predominantly used for add-on
17
investments
Index Rank
• Stock exchange: liquidity on small caps is very limited 18
Outlook 19
• Increasing number of strategic deals
• The new tax/legal framework favors R&D investments (tax 20
incentives for researchers, patent income deduction, notional
21
interest deduction), importantly decreasing the corporate effective 2005/06 2006/07 2007/08 2008/09 2009/10
tax rate VC PE VCPE
Marc Guns, Partner, Ernst & Young Belgium Comparison within Peer Group
2005/06 2009/10 Quartile
Rank Value Rank 4th 1st
Germany 9 69,1 10
Denmark 10 67,7 12
Finland 12 65,9 15
France 17 65,2 16
Belgium 19 61,1 17
Austria 20 58,6 19
Ireland 16 58,3 21
Italy 32 47,5 29
Greece 44 40,7 39
76 The Global Venture Capital and Private Equity Country Attractiveness Index - 2009/2010 annual](https://image.slidesharecdn.com/iesevcpeindexannual2009-110326195513-phpapp02/85/Iese-vcpe-index_annual_2009-75-320.jpg)

![Regional and country profiles
Brazil
Capital: Brasília ++ Official Language: Portuguese ++ Currency: Brazilian Real
Basic Facts VCPE-Ranking
2005/06 2009/10 Quartile
Rank Value Rank 4th 1st
VCPE Ranking 56 34,6 51
Economic Activity 48 79,9 34
Depth of Cap. Market 29 19,3 18
Taxation 66 39,2 65
Inv. Prot. & Corp. Gov. 52 45,4 54
Hum. & Soc. Env. 54 42,0 56
Quartile Entrepr. Culture & Opp. 65 22,7 57
4th 1st
GDP 1537 [bn USD] IPO Volume
Population 194 [mn] M&A Volume
GDP Growth '02 '08 VC Activity
Pop. Growth '02 '08 PE Activity Key Factors Performance
Economic
Activity
125
SWOT Analysis 100
Entrepr. Culture 75 Depth of Cap.
& Opp. 50
Market
Strengths
25
• Strong government support programs for start-ups, technology
0
ventures and SMEs
• Number of companies listed on the Brazilian stock exchange
increased remarkably in the past years Hum. & Soc.
Taxation
Environment
• An initial framework for VC activity, focused on smaller firms and
Brazil
start-ups, was provided by FIEs
Inv. Prot. & Latin America
Weaknesses Corp. Gov.
United States = 100 Points
• Fighting the perception of corruption remains a serious challenge
• The process of registering and enforcing patents and other
Separate VC and PE Indices
intellectual property remains slow and cumbersome
30
Opportunities
• Favourable legislation on fund formation and operation, 35
permissive regulations on institutional investors and strong
40
entrepreneurship
Index Rank
Threats 45
• Corruption is pervasive throughout the public sector and there
50
have only been a few sanctions against those involved in illegal
campaign financing activities 55
Outlook 60
• Brazil leads the region in the development of a local PE/VC 2005/06 2006/07 2007/08 2008/09 2009/10
industry VC PE VCPE
Comparison within Peer Group
2005/06 2009/10 Quartile
Rank Value Rank 4th 1st
Chile 27 45,8 32
Mexico 51 35,8 49
Brazil 56 34,6 51
Uruguay 50 33,4 52
Peru 54 32,4 53
Colombia 55 29,4 58
Argentina 59 29,1 59
Paraguay 66 14,9 65
Venezuela 65 8,9 66
78 The Global Venture Capital and Private Equity Country Attractiveness Index - 2009/2010 annual](https://image.slidesharecdn.com/iesevcpeindexannual2009-110326195513-phpapp02/85/Iese-vcpe-index_annual_2009-77-320.jpg)
![Regional and country profiles
Bulgaria
Capital: Sofia ++ Official Language: Bulgarian ++ Currency: Bulgarian Lev
Basic Facts VCPE-Ranking
2005/06 2009/10 Quartile
Rank Value Rank 4th 1st
VCPE Ranking 48 30,6 55
Economic Activity 54 63,6 53
Depth of Cap. Market 56 4,4 64
Taxation 13 138,1 8
Inv. Prot. & Corp. Gov. 47 46,2 53
Hum. & Soc. Env. 50 49,4 49
Quartile
4th 1st
Entrepr. Culture & Opp. 41 38,5 37
GDP 51 [bn USD] IPO Volume
Population 8 [mn] M&A Volume
GDP Growth '02 '08 VC Activity
Pop. Growth '02 '08 PE Activity Key Factors Performance
Economic
Activity
150
125
SWOT Analysis 100
Entrepr. Culture Depth of Cap.
& Opp. 75 Market
Strengths 50
• Growing market 25
0
• Increasing number of investment opportunities
• Return has been higher than in mature markets
Hum. & Soc.
Taxation
Weaknesses Environment
• Deal size is relatively small Bulgaria
• Quality of target information below standard Inv. Prot. & Eastern Europe
Corp. Gov.
Opportunities United States = 100 Points
• Market expects higher than average growth
• Current low penetration of the service sector: existence of growth Separate VC and PE Indices
opportunities
40
Threats
• Continuing impact of crisis 45
• Small market
Index Rank
• Slow recovery of foreign markets
50
Outlook
• Following the crisis, the VC/PE market in Bulgaria could be
expected to become active with a six-month delay compared to 55
developed markets. Opportunities will arise from smaller size deals
60
Diana Nikolaeva, Partner, Ernst & Young Bulgaria 2005/06 2006/07 2007/08 2008/09 2009/10
VC PE VCPE
Comparison within Peer Group
2005/06 2009/10 Quartile
Rank Value Rank 4th 1st
Poland 41 45,8 31
Czech Republic 33 45,5 34
Estonia 30 44,5 35
Hungary 34 41,1 37
Lithuania 37 40,4 40
Croatia 47 38,6 45
Romania 52 38,1 47
Latvia 39 35,6 50
Bulgaria 48 30,6 55
80 The Global Venture Capital and Private Equity Country Attractiveness Index - 2009/2010 annual](https://image.slidesharecdn.com/iesevcpeindexannual2009-110326195513-phpapp02/85/Iese-vcpe-index_annual_2009-79-320.jpg)
![Regional and country profiles
Canada
Capital: Ottawa ++ Official Language: English, French ++ Currency: Canadian Dollar
Basic Facts VCPE-Ranking
2005/06 2009/10 Quartile
Rank Value Rank 4th 1st
VCPE Ranking 2 85,8 2
Economic Activity 13 95,3 10
Depth of Cap. Market 3 49,8 3
Taxation 17 100,2 52
Inv. Prot. & Corp. Gov. 11 100,8 9
Hum. & Soc. Env. 5 111,9 6
Quartile
4th 1st
Entrepr. Culture & Opp. 5 94,7 7
GDP 1491 [bn USD] IPO Volume
Population 33 [mn] M&A Volume
GDP Growth '02 '08 VC Activity
Pop. Growth '02 '08 PE Activity Key Factors Performance
Economic
Activity
125
SWOT Analysis 100
Entrepr. Culture 75 Depth of Cap.
& Opp. 50
Market
Strengths
25
• Many similarities with the US
0
• Canada benefits from the “facilities” and the deal supporting
institutions of the US
• Government support to spur the asset class (tax credits, indirect Hum. & Soc.
Taxation
Environment
investments)
Canada
Weaknesses North America
Inv. Prot. &
• Canada’s original VC/PE industry is still young, and little developed Corp. Gov.
United States = 100 Points
• Generated returns remain disappointing, so far
Opportunities Separate VC and PE Indices
• Political desire to turn the resource-based economy into a 0
knowledge-based economy
• Massive public investments into R&D
1
Threats
Index Rank
• Reduction of public support of R&D and VC/PE industry
2
Outlook
• The activities of the Canadian government to spur innovation and
growth should yield to a much stronger VC/PE market 3
4
2005/06 2006/07 2007/08 2008/09 2009/10
VC PE VCPE
Comparison within Peer Group
2005/06 2009/10 Quartile
Rank Value Rank 4th 1st
United States 1 100,0 1
Canada 2 85,8 2
United Kingdom 3 84,3 3
Switzerland 8 76,3 8
Netherlands 14 70,1 9
Germany 9 69,1 10
Sweden 13 69,0 11
Denmark 10 67,7 12
Norway 11 66,3 14
82 The Global Venture Capital and Private Equity Country Attractiveness Index - 2009/2010 annual](https://image.slidesharecdn.com/iesevcpeindexannual2009-110326195513-phpapp02/85/Iese-vcpe-index_annual_2009-81-320.jpg)

![Regional and country profiles
Chile
Capital: Santiago ++ Official Language: Spanish ++ Currency: Chilean Peso
Basic Facts VCPE-Ranking
2005/06 2009/10 Quartile
Rank Value Rank 4th 1st
VCPE Ranking 27 45,8 32
Economic Activity 32 72,7 44
Depth of Cap. Market 32 12,6 34
Taxation 18 112,8 39
Inv. Prot. & Corp. Gov. 24 80,2 22
Hum. & Soc. Env. 27 77,0 27
Quartile
4th 1st
Entrepr. Culture & Opp. 36 35,2 42
GDP 190 [bn USD] IPO Volume
Population 17 [mn] M&A Volume
GDP Growth '02 '08 VC Activity
Pop. Growth '02 '08 PE Activity Key Factors Performance
Economic
Activity
125
SWOT Analysis 100
Entrepr. Culture 75 Depth of Cap.
& Opp. 50
Market
Strengths
25
• Law establishes corporate governance norms like the formation of
0
audit committees and strengthens management responsibility for
ensuring fair market prices for transactions
• Lower incidences of perceived corruption in the region Hum. & Soc.
Taxation
Environment
• There is considerable entrepreneurial dynamism
Chile
Weaknesses Latin America
Inv. Prot. &
• Low levels of market capitalization and high costs of meeting Corp. Gov.
United States = 100 Points
listing requirements mean that IPO exits are not accessible to the
vast majority of SMEs
Separate VC and PE Indices
• Value-added tax on fund administrator commissions for foreign
participants in funds 25
• Foreign investors from a majority of countries still face double- 26
taxation 27
28
Opportunities
Index Rank
29
• Law stimulates PE/VC activity through a new form of corporate 30
organization, the share-issuing limited-liability company, which 31
provides a more flexible instrument to receive venture capital 32
33
Threats
34
• The cost of protecting trademarks and patents is high, and the
35
country remains on the US Special 301 Watch List for intellectual
2005/06 2006/07 2007/08 2008/09 2009/10
property violations.
VC PE VCPE
Comparison within Peer Group
2005/06 2009/10 Quartile
Rank Value Rank 4th 1st
Chile 27 45,8 32
Mexico 51 35,8 49
Brazil 56 34,6 51
Uruguay 50 33,4 52
Peru 54 32,4 53
Colombia 55 29,4 58
Argentina 59 29,1 59
Paraguay 66 14,9 65
Venezuela 65 8,9 66
84 The Global Venture Capital and Private Equity Country Attractiveness Index - 2009/2010 annual](https://image.slidesharecdn.com/iesevcpeindexannual2009-110326195513-phpapp02/85/Iese-vcpe-index_annual_2009-83-320.jpg)
![Regional and country profiles
China
Capital: Beijing ++ O cial Language: Standard Mandarin ++ Currency: Yuan Renminbi
Basic Facts VCPE-Ranking
2005/06 2009/10 Quar le
Rank Value Rank 4th 1st
VCPE Ranking 42 48,5 28
Econom c Ac t 28 79,7 35
Depth of Cap. Market 16 37,7 6
Taxa on 62 72,1 62
In . Prot. & Corp. Go . 55 48,6 52
Hum. & Soc. En . 42 61,4 42
4th
Quar le
1st
Entrepr. Culture & Opp. 50 29,6 50
GDP 4192 [bn USD] IPO Volume
Popula on 1336 [mn] M&A Volume
GDP Growth '02 '08 VC Ac t
Pop. Growth '02 '08 PE Ac t Key Factors Performance
Econom c
Ac t
125
100
SWOT Analysis
Entrepr. Culture 75 Depth of Cap.
& Opp. 50
Market
Strengths
25
• Period from first VC/PE round to IPO is shorter than in other
0
countries
• Various IPOs with high international recognition in the past few
years Hum. & Soc.
Taxa on
En ronment
• Numerous alternative stock markets available for VC/PE exits
• Large companies acquiring VC/PE investees seen as attractive Ch na
alternative exit In . Prot. & As a
Corp. Go .
United States = 100 Points
Weaknesses
• Downturn of economy due to poor export atmosphere
Separate VC and PE Indices
• Poor market sentiment due to financial crisis
• Government policy may affect the availability of exits in overseas 15
stock markets due to strict going public criteria
20
Opportunities
25
• Strong growing economy
Index Rank
• Focus on new industries, such as solar and wind power 30
• Higher chances of success for green field investments
35
Threats
• High valuation levels may reduce the number of transactions 40
• LPs are requesting the GPs to be more cautious with investment
45
decisions
2005/06 2006/07 2007/08 2008/09 2009/10
• Uncertainty on the success of stimulus policies
VC PE VCPE
Outlook
• Too early to assess the impact of the stimulus policies to the Comparison within Peer Group
economy, but World Bank’s economic growth forecast for China
2005/06 2009/10 Quar le
rose significantly
Rank Value Rank 4th 1st
• Large increase in use of wind and solar power over the next
Hong Kong 4 79,5 5
decade planned: aimed to match Europe by 2020, producing a
fifth of its energy from renewable sources Japan 7 76,5 7
Republ c of Korea 15 67,5 13
Ringo Choi, Managing Partner, Ernst & Young China Mala s a 23 54,4 25
Ch na 42 48,5 28
In a 46 40,9 38
Russ an Federa on 49 38,0 48
Indones a 60 30,7 54
Ph l pp nes 57 26,1 61
86 The Global Venture Capital and Private Equity Country Attractiveness Index - 2009/2010 annual](https://image.slidesharecdn.com/iesevcpeindexannual2009-110326195513-phpapp02/85/Iese-vcpe-index_annual_2009-85-320.jpg)
![Regional and country profiles
Colombia
Capital: Bogotá ++ Official Language: Spanish ++ Currency: Colombian Peso
Basic Facts VCPE-Ranking
2005/06 2009/10 Quartile
Rank Value Rank 4th 1st
VCPE Ranking 55 29,4 58
Economic Activity 46 65,6 49
Depth of Cap. Market 47 8,1 51
Taxation 64 105,1 45
Inv. Prot. & Corp. Gov. 59 39,1 58
Hum. & Soc. Env. 60 31,3 64
Quartile
4th 1st
Entrepr. Culture & Opp. 51 30,2 49
GDP 234 [bn USD] IPO Volume
Population 47 [mn] M&A Volume
GDP Growth '02 '08 VC Activity
Pop. Growth '02 '08 PE Activity Key Factors Performance
Economic
Activity
125
SWOT Analysis 100
Entrepr. Culture 75 Depth of Cap.
& Opp. 50
Market
Strengths
25
• Low barriers to participation for institutional investors
0
• Liberal policies towards foreign portfolio investment
• Under recent corporate governance reforms, standards for listed
firms have improved Hum. & Soc.
Taxation
Environment
Weaknesses Colombia
• Decline in the country’s capital market development Inv. Prot. & Latin America
• Low levels of market capitalization and high costs of meeting Corp. Gov.
United States = 100 Points
listing requirements mean that IPO exits are still not accessible to
the vast majority of SMEs
Separate VC and PE Indices
• Efforts to transition to international accounting standards have
met with continued delays 53
Opportunities 54
• A loosening of restrictions will now allow further participation of 55
pension funds in PE/VC activities
Index Rank
56
Threats
57
• Corruption and the weakness of the local judicial system are still
roadblocks 58
• Restricted size and liquidity of capital markets, and resulting 59
difficulty of exits constitute an important impediment
60
2005/06 2006/07 2007/08 2008/09 2009/10
VC PE VCPE
Comparison within Peer Group
2005/06 2009/10 Quartile
Rank Value Rank 4th 1st
Chile 27 45,8 32
Mexico 51 35,8 49
Brazil 56 34,6 51
Uruguay 50 33,4 52
Peru 54 32,4 53
Colombia 55 29,4 58
Argentina 59 29,1 59
Paraguay 66 14,9 65
Venezuela 65 8,9 66
88 The Global Venture Capital and Private Equity Country Attractiveness Index - 2009/2010 annual](https://image.slidesharecdn.com/iesevcpeindexannual2009-110326195513-phpapp02/85/Iese-vcpe-index_annual_2009-87-320.jpg)
![Regional and country profiles
Croatia
Capital: Zagreb ++ Official Language: Croatian ++ Currency: Croatian Kuna
Basic Facts VCPE-Ranking
2005/06 2009/10 Quartile
Rank Value Rank 4th 1st
VCPE Ranking 47 38,6 45
Economic Activity 44 70,6 46
Depth of Cap. Market 59 8,4 49
Taxation 16 128,9 15
Inv. Prot. & Corp. Gov. 45 50,8 48
Hum. & Soc. Env. 40 61,1 43
Quartile
4th 1st
Entrepr. Culture & Opp. 32 43,4 31
GDP 61 [bn USD] IPO Volume
Population 5 [mn] M&A Volume
GDP Growth '02 '08 VC Activity
Pop. Growth '02 '08 PE Activity Key Factors Performance
Economic
Activity
150
125
SWOT Analysis 100
Entrepr. Culture Depth of Cap.
& Opp. 75 Market
Strengths 50
• Significant demand for all kind of financing 25
0
• Government recently introduced strategy for innovations (“BICRO”
and “CRANE”)
Hum. & Soc.
Taxation
Weaknesses Environment
• VC/PE market is in an initial phase of development Croatia
• Limited number of large potential investments Inv. Prot. & Eastern Europe
• Legal and business conditions are not supporting a dynamic SME Corp. Gov.
United States = 100 Points
sector due to lack of simple licensing and registration processes,
and barriers for investments
Separate VC and PE Indices
Opportunities
30
• Traditional bank loans become expensive and unavailable
• Growth potential in companies that are active in Croatia and 35
neighboring countries
40
• Untapped midsize market
Index Rank
Threats 45
• Cultural structure does not contribute to the development of 50
entrepreneurship
• Reduced availability of debt financing and general illiquidity 55
Outlook 60
• The Croatian market is traditionally bank oriented. Reduced access 2005/06 2006/07 2007/08 2008/09 2009/10
to bank loans for SMEs is expected to provide a platform for VC PE VCPE
increasing VC/PE activities. Hidden values are expected to be more
tapped by VC/PE in the near future. Comparison within Peer Group
2005/06 2009/10 Quartile
Balazs Tuske, Partner, Ernst & Young Hungary
Rank Value Rank 4th 1st
Poland 41 45,8 31
Czech Republic 33 45,5 34
Estonia 30 44,5 35
Hungary 34 41,1 37
Lithuania 37 40,4 40
Croatia 47 38,6 45
Romania 52 38,1 47
Latvia 39 35,6 50
Bulgaria 48 30,6 55
90 The Global Venture Capital and Private Equity Country Attractiveness Index - 2009/2010 annual](https://image.slidesharecdn.com/iesevcpeindexannual2009-110326195513-phpapp02/85/Iese-vcpe-index_annual_2009-89-320.jpg)

![Regional and country profiles
Czech Republic
Capital: Prague ++ Official Language: Czech ++ Currency: Czech Koruna
Basic Facts VCPE-Ranking
2005/06 2009/10 Quartile
Rank Value Rank 4th 1st
VCPE Ranking 33 45,5 34
Economic Activity 25 84,7 26
Depth of Cap. Market 43 9,9 44
Taxation 35 120,4 28
Inv. Prot. & Corp. Gov. 32 67,0 35
Hum. & Soc. Env. 23 87,2 20
Quartile
4th 1st
Entrepr. Culture & Opp. 35 41,9 33
GDP 232 [bn USD] IPO Volume
Population 10 [mn] M&A Volume
GDP Growth '02 '08 VC Activity
Pop. Growth '02 '08 PE Activity Key Factors Performance
Economic
Activity
125
SWOT Analysis 100
Entrepr. Culture 75 Depth of Cap.
& Opp. 50
Market
Strengths
25
• Relatively strong mid-term economic growth prospects
0
• Highly educated and skilled labor force, well developed
infrastructure
Hum. & Soc.
Taxation
Weaknesses Environment
• Illiquid capital market Czech Republic
• Negative perception/low profile of VC/PEs as a source of finance Inv. Prot. & Eastern Europe
• Few opportunities for large investments (>500m) Corp. Gov.
United States = 100 Points
• Poor quality of legal enforcement and uncertain tax environment
Opportunities Separate VC and PE Indices
• Many good companies with poor financial management 29
• Large pool of owner managed businesses where owners are now 30
reaching retirement 31
• Companies struggling to obtain credit from banks and looking for 32
other sources of finance
Index Rank
33
• Opportunities in non-cyclical industries such as healthcare 34
Threats 35
• 2010 elections may result in less favorable tax regime 36
37
• FX volatility (postponement of EURO adoption to at least 2015)
38
and adverse impact on export competitiveness
39
Outlook 2005/06 2006/07 2007/08 2008/09 2009/10
• Czech market continues to offer VC/PEs opportunities to execute VC PE VCPE
leveraged transactions with companies showing reasonable
growth prospects. Comparison within Peer Group
2005/06 2009/10 Quartile
Vladislav Severa, Partner, Ernst & Young Czech Republic
Rank Value Rank 4th 1st
Poland 41 45,8 31
Czech Republic 33 45,5 34
Estonia 30 44,5 35
Hungary 34 41,1 37
Lithuania 37 40,4 40
Croatia 47 38,6 45
Romania 52 38,1 47
Latvia 39 35,6 50
Bulgaria 48 30,6 55
92 The Global Venture Capital and Private Equity Country Attractiveness Index - 2009/2010 annual](https://image.slidesharecdn.com/iesevcpeindexannual2009-110326195513-phpapp02/85/Iese-vcpe-index_annual_2009-91-320.jpg)
![Regional and country profiles
Denmark
Capital: Copenhagen ++ Official Language: Danish ++ Currency: Danish Krone
Basic Facts VCPE-Ranking
2005/06 2009/10 Quartile
Rank Value Rank 4th 1st
VCPE Ranking 10 67,7 12
Economic Activity 14 92,3 14
Depth of Cap. Market 26 14,3 29
Taxation 33 120,5 27
Inv. Prot. & Corp. Gov. 4 106,0 4
Hum. & Soc. Env. 2 120,8 2
Quartile
4th 1st
Entrepr. Culture & Opp. 7 100,1 2
GDP 345 [bn USD] IPO Volume
Population 6 [mn] M&A Volume
GDP Growth '02 '08 VC Activity
Pop. Growth '02 '08 PE Activity Key Factors Performance
Economic
Activity
125
SWOT Analysis 100
Entrepr. Culture 75 Depth of Cap.
& Opp. 50
Market
Strengths
25
• Strong VC/PE environment with local as well as international
0
players
Weaknesses Hum. & Soc.
Taxation
• Low end of the VC market not powerful enough Environment
Denmark
Opportunities
• Many PE houses have raised funds recently Inv. Prot. & Western Europe
Corp. Gov.
• Backlog of exits from PE houses United States = 100 Points
Threats
Separate VC and PE Indices
• Financing can still be a problem
• Imbalance between financing opportunities and market pricing 8
on companies 9
10
Outlook 11
• Continuous PE activity expected
Index Rank
12
13
Christian Aarosin, Partner, Ernst & Young Denmark 14
15
16
17
18
2005/06 2006/07 2007/08 2008/09 2009/10
VC PE VCPE
Comparison within Peer Group
2005/06 2009/10 Quartile
Rank Value Rank 4th 1st
Germany 9 69,1 10
Denmark 10 67,7 12
Finland 12 65,9 15
France 17 65,2 16
Belgium 19 61,1 17
Austria 20 58,6 19
Ireland 16 58,3 21
Italy 32 47,5 29
Greece 44 40,7 39
94 The Global Venture Capital and Private Equity Country Attractiveness Index - 2009/2010 annual](https://image.slidesharecdn.com/iesevcpeindexannual2009-110326195513-phpapp02/85/Iese-vcpe-index_annual_2009-93-320.jpg)
![Regional and country profiles
Egypt
Capital: Cairo ++ Official Language: Arabic ++ Currency: Egyptian Pound
Basic Facts VCPE-Ranking
2005/06 2009/10 Quartile
Rank Value Rank 4th 1st
VCPE Ranking 53 30,1 57
Economic Activity 61 52,8 59
Depth of Cap. Market 51 9,3 45
Taxation 37 122,1 23
Inv. Prot. & Corp. Gov. 53 49,3 49
Hum. & Soc. Env. 49 37,9 61
Quartile
4th 1st
Entrepr. Culture & Opp. 57 20,7 58
GDP 168 [bn USD] IPO Volume
Population 77 [mn] M&A Volume
GDP Growth '02 '08 VC Activity
Pop. Growth '02 '08 PE Activity Key Factors Performance
Economic
Activity
150
125
SWOT Analysis 100
Entrepr. Culture Depth of Cap.
& Opp. 75 Market
Strengths 50
• Economy is sufficiently diversified and investors can find broad 25
0
industries for investment
• Growth relies on reform initiatives that spurred FDI flow and
strengthened the purchasing power of a large and growing Hum. & Soc.
Taxation
Environment
population base
Egypt
Weaknesses Middle East
Inv. Prot. &
• Market is too fragmented, hence local knowledge and presence in Corp. Gov.
United States = 100 Points
the market is necessary
• Regulatory enforcement is still a key issue to be addressed in the
Separate VC and PE Indices
country
50
Opportunities 51
• Ideal time to look at defensive sectors such as FMCG, education, 52
pharmaceutical and services related industries such as media and 53
advertising
Index Rank
54
• Ideal time to have a closer look at distressed companies having 55
good business models 56
Threats 57
58
• Over the short-term, economic growth is projected to slow down
59
as the global tourism industry slows down
60
Outlook 2005/06 2006/07 2007/08 2008/09 2009/10
• Over the short-term period, global economic slow-down will VC PE VCPE
impact growth prospects and overall business performance in
Egypt. However, the long-term positive impact of the economic Comparison within Peer Group
reforms will filter into the economy.
2005/06 2009/10 Quartile
Rank Value Rank 4th 1st
Nawal Nely, Senior Manager, Ernst & Young Egypt
Israel 21 55,8 22
United Arab Emirates 26 51,7 26
Saudi Arabia 36 46,4 30
Kuwait 29 40,1 42
Oman 38 38,1 46
Morocco 58 30,3 56
Egypt 53 30,1 57
Nigeria 64 24,4 62
Kenya 63 19,3 64
96 The Global Venture Capital and Private Equity Country Attractiveness Index - 2009/2010 annual](https://image.slidesharecdn.com/iesevcpeindexannual2009-110326195513-phpapp02/85/Iese-vcpe-index_annual_2009-95-320.jpg)
![Regional and country profiles
Estonia
Capital: Tallinn ++ Official Language: Estonian ++ Currency: Estonian Kroon
Basic Facts VCPE-Ranking
2005/06 2009/10 Quartile
Rank Value Rank 4th 1st
VCPE Ranking 30 44,5 35
Economic Activity 39 51,6 60
Depth of Cap. Market 44 8,3 50
Taxation 25 129,7 14
Inv. Prot. & Corp. Gov. 21 82,6 20
Hum. & Soc. Env. 37 77,6 26
Quartile
4th 1st
Entrepr. Culture & Opp. 24 58,8 25
GDP 24 [bn USD] IPO Volume
Population 1 [mn] M&A Volume
GDP Growth '02 '08 VC Activity
Pop. Growth '02 '08 PE Activity Key Factors Performance
Economic
Activity
150
125
SWOT Analysis 100
Entrepr. Culture Depth of Cap.
& Opp. 75 Market
Strengths 50
• Simple and attractive tax system 25
0
• Increasing “European” business culture
• Open economy with strong foreign direct investment inflows
• Strong track record of VC/PE companies’ portfolios Hum. & Soc.
Taxation
Environment
Weaknesses Estonia
• Overall small M&A market and low liquidity stock exchange Inv. Prot. & Eastern Europe
• Mostly investments in traditional industries Corp. Gov.
United States = 100 Points
• Historical high account deficit
Opportunities Separate VC and PE Indices
• Government has no debt and has accumulated extensive 25
stabilization reserves
• Government strives to meet the Euro adaption criteria and join 30
the Euro-zone in 2011
• Increasing interest towards innovative industries
Index Rank
35
Threats
• Difficulties in obtaining bank financing in the near future 40
• VC/PE companies may struggle to find attractive exit
45
opportunities
• Baltic region, which is seen as one area, eclipses the amenities of
50
Estonia
2005/06 2006/07 2007/08 2008/09 2009/10
Outlook VC PE VCPE
• Development of VC/PE investments is much dependent on the
sentiment about growth prospects and devaluation risks in the Comparison within Peer Group
Baltics
2005/06 2009/10 Quartile
• Foreign VC/PE houses will start to show interest for Baltic Rank Value Rank 4th 1st
companies if the bottom has been reached and solid growth
Poland 41 45,8 31
opportunities arise
Czech Republic 33 45,5 34
Lili Kirikal, Manager, Ernst & Young Estonia Estonia 30 44,5 35
Hungary 34 41,1 37
Lithuania 37 40,4 40
Croatia 47 38,6 45
Romania 52 38,1 47
Latvia 39 35,6 50
Bulgaria 48 30,6 55
98 The Global Venture Capital and Private Equity Country Attractiveness Index - 2009/2010 annual](https://image.slidesharecdn.com/iesevcpeindexannual2009-110326195513-phpapp02/85/Iese-vcpe-index_annual_2009-97-320.jpg)

![Regional and country profiles
Finland
Capital: Helsinki ++ Official Language: Finnish, Swedish ++ Currency: Euro
Basic Facts VCPE-Ranking
2005/06 2009/10 Quartile
Rank Value Rank 4th 1st
VCPE Ranking 12 65,9 15
Economic Activity 19 90,7 17
Depth of Cap. Market 25 14,5 28
Taxation 32 116,3 32
Inv. Prot. & Corp. Gov. 5 102,9 5
Hum. & Soc. Env. 7 107,4 7
Quartile
4th 1st
Entrepr. Culture & Opp. 2 102,3 1
GDP 274 [bn USD] IPO Volume
Population 5 [mn] M&A Volume
GDP Growth '02 '08 VC Activity
Pop. Growth '02 '08 PE Activity Key Factors Performance
Economic
Activity
125
SWOT Analysis 100
Entrepr. Culture 75 Depth of Cap.
& Opp. 50
Market
Strengths
25
• High education and R&D contribution
0
• Strong selected sectors
Weaknesses Hum. & Soc.
Taxation
• Relative small local markets to support the business case Environment
• Early stage VC financing needs to be further developed Finland
Opportunities Inv. Prot. & Western Europe
Corp. Gov.
• New sectors arising, for example cleantech United States = 100 Points
• Build globally leading clusters in certain strong industries
Separate VC and PE Indices
Threats
• Internalization is typically a must to success 10
• Challenges in financing in current environment 11
12
Outlook 13
• Finland will be seen as an interesting area to invest
Index Rank
14
15
Petri Ojala, Partner, Ernst & Young Finland 16
17
18
19
20
2005/06 2006/07 2007/08 2008/09 2009/10
VC PE VCPE
Comparison within Peer Group
2005/06 2009/10 Quartile
Rank Value Rank 4th 1st
Germany 9 69,1 10
Denmark 10 67,7 12
Finland 12 65,9 15
France 17 65,2 16
Belgium 19 61,1 17
Austria 20 58,6 19
Ireland 16 58,3 21
Italy 32 47,5 29
Greece 44 40,7 39
100 The Global Venture Capital and Private Equity Country Attractiveness Index - 2009/2010 annual](https://image.slidesharecdn.com/iesevcpeindexannual2009-110326195513-phpapp02/85/Iese-vcpe-index_annual_2009-99-320.jpg)
![Regional and country profiles
France
Capital: Paris ++ Official Language: French ++ Currency: Euro
Basic Facts VCPE-Ranking
2005/06 2009/10 Quartile
Rank Value Rank 4th 1st
VCPE Ranking 17 65,2 16
Economic Activity 24 95,0 11
Depth of Cap. Market 7 28,8 10
Taxation 58 106,1 44
Inv. Prot. & Corp. Gov. 23 83,9 19
Hum. & Soc. Env. 19 78,3 25
Quartile
4th 1st
Entrepr. Culture & Opp. 22 69,2 22
GDP 2834 [bn USD] IPO Volume
Population 62 [mn] M&A Volume
GDP Growth '02 '08 VC Activity
Pop. Growth '02 '08 PE Activity Key Factors Performance
Economic
Activity
125
SWOT Analysis 100
Entrepr. Culture 75 Depth of Cap.
& Opp. 50
Market
Strengths
25
• Smaller decrease of number of deals in France than in Europe
0
• Early stage investments resist better in France than in Europe, due
to convergent public incentives in favor of innovation
• Consistent deal-flow of high quality high tech projects Hum. & Soc.
Taxation
Environment
Weaknesses France
• French GPs realize less international deals than their European Inv. Prot. & Western Europe
peers, e.g., UK, Germany, Sweden Corp. Gov.
United States = 100 Points
• Cleantech investments are late in France, although accelerating
Opportunities Separate VC and PE Indices
• Tax policy in favor of asset class: “FCPI”, “Loi Tepa” 8
• Tax policy in favor of innovation: “Credit Impot Recherche”, 9
“OSEO” incentives 10
Threats 11
Index Rank
• Only a few large funds of funds 12
• French emerging companies have difficulties to grow (after four 13
years of existence) and to become market leaders 14
• Outlook 15
16
• French tax policies may foster new promising opportunities for
17
VC/PE
18
2005/06 2006/07 2007/08 2008/09 2009/10
Philippe Grand, Partner, Ernst & Young France
VC PE VCPE
Comparison within Peer Group
2005/06 2009/10 Quartile
Rank Value Rank 4th 1st
Germany 9 69,1 10
Denmark 10 67,7 12
Finland 12 65,9 15
France 17 65,2 16
Belgium 19 61,1 17
Austria 20 58,6 19
Ireland 16 58,3 21
Italy 32 47,5 29
Greece 44 40,7 39
102 The Global Venture Capital and Private Equity Country Attractiveness Index - 2009/2010 annual](https://image.slidesharecdn.com/iesevcpeindexannual2009-110326195513-phpapp02/85/Iese-vcpe-index_annual_2009-101-320.jpg)

![Regional and country profiles
Germany
Capital: Berlin ++ Official Language: German ++ Currency: Euro
Basic Facts VCPE-Ranking
2005/06 2009/10 Quartile
Rank Value Rank 4th 1st
VCPE Ranking 9 69,1 10
Economic Activity 43 97,1 5
Depth of Cap. Market 8 23,6 14
Taxation 24 126,6 16
Inv. Prot. & Corp. Gov. 12 94,2 14
Hum. & Soc. Env. 17 90,0 19
Quartile
4th 1st
Entrepr. Culture & Opp. 12 85,1 14
GDP 3624 [bn USD] IPO Volume
Population 83 [mn] M&A Volume
GDP Growth '02 '08 VC Activity
Pop. Growth '02 '08 PE Activity Key Factors Performance
Economic
Activity
150
125
SWOT Analysis 100
Entrepr. Culture Depth of Cap.
& Opp. 75 Market
Strengths 50
• Large number of interesting targets of all sizes and strong 25
0
potential from privately owned businesses facing succession
problems
• Many corporations in technological and market leadership Hum. & Soc.
Taxation
Environment
• Diverse portfolio of industries in Europe’s leading economy
Germany
• Very strong infrastructure and reliable administration
• Cultural attitude towards performance and diligence Inv. Prot. & Western Europe
Corp. Gov.
United States = 100 Points
Weaknesses
• Crisis driven failures have damaged the reputation of the
Separate VC and PE Indices
industry and it will take some time to win back sellers’ and public
confidence 6
7
Opportunities
• Unfavorable loan situation makes many companies look for other 8
sources of capital and VC/PE represents a promising option 9
Index Rank
• Comprehensive restructuring in current crisis will bring German 10
industries into favorite competitive positions for the next cycle
11
Threats 12
• Current portfolios are hit hard by the crisis
13
• German economy is export oriented, and hence, strongly
14
dependent on the recovery of the world’s markets
2005/06 2006/07 2007/08 2008/09 2009/10
Outlook VC PE VCPE
• Mid-term, the market will reach former performance as German
targets are mostly leading players in important markets, and will Comparison within Peer Group
fully participate from the post crisis upturn of the world economy.
2005/06 2009/10 Quartile
Rank Value Rank 4th 1st
Florian Huber, Senior Manager, Ernst & Young Germany
Germany 9 69,1 10
Denmark 10 67,7 12
Finland 12 65,9 15
France 17 65,2 16
Belgium 19 61,1 17
Austria 20 58,6 19
Ireland 16 58,3 21
Italy 32 47,5 29
Greece 44 40,7 39
104 The Global Venture Capital and Private Equity Country Attractiveness Index - 2009/2010 annual](https://image.slidesharecdn.com/iesevcpeindexannual2009-110326195513-phpapp02/85/Iese-vcpe-index_annual_2009-103-320.jpg)
![Regional and country profiles
Greece
Capital: Athens ++ Official Language: Greek ++ Currency: Euro
Basic Facts VCPE-Ranking
2005/06 2009/10 Quartile
Rank Value Rank 4th 1st
VCPE Ranking 44 40,7 39
Economic Activity 29 88,5 21
Depth of Cap. Market 36 12,6 35
Taxation 41 120,9 26
Inv. Prot. & Corp. Gov. 48 54,2 45
Hum. & Soc. Env. 46 47,7 50
Quartile
4th 1st
Entrepr. Culture & Opp. 37 36,7 39
GDP 355 [bn USD] IPO Volume
Population 11 [mn] M&A Volume
GDP Growth '02 '08 VC Activity
Pop. Growth '02 '08 PE Activity Key Factors Performance
Economic
Activity
125
SWOT Analysis 100
Entrepr. Culture 75 Depth of Cap.
& Opp. 50
Market
Strengths
25
• Tax and legal environment supports VC/PE
0
• Small local VC/PE players
• Numerous companies are controlled by one shareholding family
Hum. & Soc.
Taxation
Weaknesses Environment
• Limited number of large potential investments Greece
• Long negotiation time for deal making Inv. Prot. & Western Europe
Corp. Gov.
Opportunities United States = 100 Points
• Untapped market
• Opportunities in companies that are also active in neighboring Separate VC and PE Indices
countries
34
• Growth of region
36
Threats 38
• Reduced availability of debt financing
40
Index Rank
• Recent drop in confidence
• Local economy is expected to take longer to recover from the 42
global downturn due to structural issues 44
Outlook 46
• The mid-cap market is expected to continue to be dominated by a 48
handful of VC/PE players 50
• Downturn provides opportunities for established GPs to target 2005/06 2006/07 2007/08 2008/09 2009/10
diversified industries focusing on their core operations and selling VC PE VCPE
non-core assets.
Comparison within Peer Group
George Momferratos, Partner, Ernst & Young Greece
2005/06 2009/10 Quartile
Rank Value Rank 4th 1st
Germany 9 69,1 10
Denmark 10 67,7 12
Finland 12 65,9 15
France 17 65,2 16
Belgium 19 61,1 17
Austria 20 58,6 19
Ireland 16 58,3 21
Italy 32 47,5 29
Greece 44 40,7 39
106 The Global Venture Capital and Private Equity Country Attractiveness Index - 2009/2010 annual](https://image.slidesharecdn.com/iesevcpeindexannual2009-110326195513-phpapp02/85/Iese-vcpe-index_annual_2009-105-320.jpg)
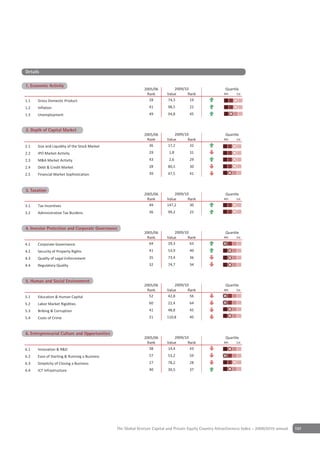
![Regional and country profiles
Hong Kong
Capital: ++ O cial Language: Chinese, English ++ Currency: Hong Kong Dollar
Basic Facts VCPE-Ranking
2005/06 2009/10 Quar le
Rank Value Rank 4th 1st
VCPE Ranking 4 79,5 5
Econom c Ac 4 89,3 19
Depth of Cap. Market 6 37,7 5
Taxa on 8 137,7 9
In . Prot. & Corp. Go . 3 107,1 3
Hum. & Soc. En . 8 106,1 8
4th
Quar le
1st
Entrepr. Culture & Opp. 14 77,9 18
GDP 219 [bn USD] IPO Volume
Popul on 7 [mn] M&A Volume
GDP Growth '02 '08 VC
Pop. Growth '02 '08 PE Key Factors Performance
Econom c
Ac t
150
125
SWOT Analysis 100
Entrepr. Culture Depth of Cap.
& Opp. 75 Market
Strengths 50
• Financial center with a very strong and professional infrastructure 25
0
• Period from first VC/PE round to IPO is shorter than in other
countries
• Various IPOs with high international recognition in the last few Hum. & Soc.
Taxa on
En ronment
years
HongKong
Weaknesses
In . Prot. & As a
• Downturn of Chinese exports due to world-wide recession Corp. Go .
United States = 100 Points
• Poor market sentiment due to financial crisis
Opportunities Separate VC and PE Indices
• Strong growing Chinese economy 3
• Focus on new industries, such as solar and wind power
• Higher chances of success for green field investments
Threats 4
Index Rank
• High valuation levels may reduce the number of transactions
• LPs are requesting the GPs to be more cautious with investment
decisions
5
• Uncertainty on the success of Chinese stimulus policies
Outlook
• Too early to assess the impact of the Chinese stimulus policies, 6
but World Bank’s economic growth forecast for China rose 2005/06 2006/07 2007/08 2008/09 2009/10
significantly, underlining Hong Kong’s upside potential VC PE VCPE
• Large increase in use of wind and solar power over the next
decade planned: aimed to match Europe by 2020, producing a Comparison within Peer Group
fifth of its energy from renewable sources
2005/06 2009/10 Quar le
Rank Value Rank 4th 1st
Ringo Choi, Managing Partner, Ernst & Young China
Hong Kong 4 79,5 5
Japan 7 76,5 7
Re c of Korea 15 67,5 13
Mala a 23 54,4 25
C a 42 48,5 28
I a 46 40,9 38
n Fede on 49 38,0 48
Indone a 60 30,7 54
P es 57 26,1 61
108 The Global Venture Capital and Private Equity Country Attractiveness Index - 2009/2010 annual](https://image.slidesharecdn.com/iesevcpeindexannual2009-110326195513-phpapp02/85/Iese-vcpe-index_annual_2009-107-320.jpg)

![Regional and country profiles
Hungary
Capital: Budapest ++ Official Language: Magyar (Hungarian) ++ Currency: Forint
Basic Facts VCPE-Ranking
2005/06 2009/10 Quartile
Rank Value Rank 4th 1st
VCPE Ranking 34 41,1 37
Economic Activity 34 74,3 41
Depth of Cap. Market 48 8,0 54
Taxation 15 126,4 17
Inv. Prot. & Corp. Gov. 29 70,7 31
Hum. & Soc. Env. 41 59,2 45
Quartile
4th 1st
Entrepr. Culture & Opp. 30 47,1 30
GDP 157 [bn USD] IPO Volume
Population 10 [mn] M&A Volume
GDP Growth '02 '08 VC Activity
Pop. Growth '02 '08 PE Activity Key Factors Performance
Economic
Activity
150
125
SWOT Analysis 100
Entrepr. Culture Depth of Cap.
& Opp. 75 Market
Strengths 50
• Post privatization phase 25
0
• Hungary is known to have grown talent and know how in selected
industries
• Tax laws are changing to attract foreign investors Hum. & Soc.
Taxation
Environment
Weaknesses Hungary
• Macro-economic policy is heavily influenced by foreign investors Inv. Prot. & Eastern Europe
• Limited number of large potential investments Corp. Gov.
United States = 100 Points
• Lack of maturity in deal making
Opportunities Separate VC and PE Indices
• Untapped midsize market 30
• Growth potential of Hungarian companies already invested in 32
neighboring countries 34
• Growth opportunities of CEE region 36
• Market consolidation in various industries
Index Rank
38
• Difficult to raise financing for local players 40
• Hidden values due to under-developed management structures 42
• Government's support for the EU funded “Jeremie-Program” (Oct 44
2009) to fuel VC activities and to encourage companies to come 46
to market, presenting viable investment opportunities 48
50
Threats
2005/06 2006/07 2007/08 2008/09 2009/10
• Reduced availability of debt financing
VC PE VCPE
• Currency volatility
• Recent drop in investor confidence
Comparison within Peer Group
Outlook
2005/06 2009/10 Quartile
• Strengthening investments of regional VC/PE players leveraging Rank Value Rank 4th 1st
market consolidation and untapped values
Poland 41 45,8 31
Balazs Tuske, Partner, Ernst & Young Hungary Czech Republic 33 45,5 34
Estonia 30 44,5 35
Hungary 34 41,1 37
Lithuania 37 40,4 40
Croatia 47 38,6 45
Romania 52 38,1 47
Latvia 39 35,6 50
Bulgaria 48 30,6 55
110 The Global Venture Capital and Private Equity Country Attractiveness Index - 2009/2010 annual](https://image.slidesharecdn.com/iesevcpeindexannual2009-110326195513-phpapp02/85/Iese-vcpe-index_annual_2009-109-320.jpg)
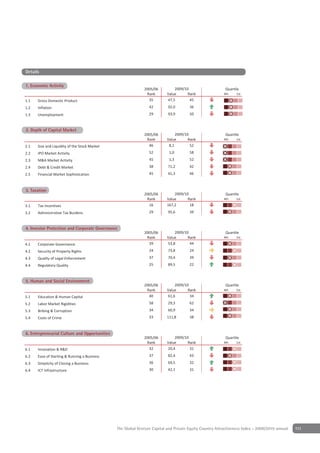
![Regional and country profiles
India
Capital: New Delhi ++ O cial Language: Hindi, English ++ Currency: Indian Rupee
Basic Facts VCPE-Ranking
2005/06 2009/10 Quar le
Rank Value Rank 4th 1st
VCPE Ranking 46 40,9 38
Econom c Ac 45 63,0 55
Depth of Cap. Market 9 33,5 8
Taxa on 56 97,1 58
In . Prot. & Corp. Go . 43 54,8 44
Hum. & Soc. En . 39 64,9 39
4th
Quar le
1st
Entrepr. Culture & Opp. 63 11,5 64
GDP 1201 [bn USD] IPO Volume
Po on 1186 [mn] M&A Volume
GDP Growth '02 '08 VC
Pop. Growth '02 '08 PE Key Factors Performance
Econom c
Ac t
125
100
SWOT Analysis
Entrepr. Culture 75 Depth of Cap.
& Opp. 50
Market
Strengths
25
• Second-fastest growing economy; increased consumption among
0
youth driving cross-sector growth
• Strong private sector; VC/PE investments growing at CAGR of
84% (from US$1 billion in 2002 to US$41.3 billion by 2008) Hum. & Soc.
Taxa on
En ronment
• High intellectual capital, leading to emergence of VC hotspots
(e.g., Bengaluru) Ind a
• Active equity capital and transaction markets facilitating exit In . Prot. & As a
Corp. Go .
options United States = 100 Points
Weaknesses
Separate VC and PE Indices
• Regulatory restrictions on foreign investment in certain sectors,
albeit easing gradually 25
• Crowded market (~300+ GPs) with limited scale of assets limiting
deal sizes; buy-out market in a nascent stage 30
Opportunities
Index Rank
35
• Capital required for core (and defensive) sectors (e.g., infrastructure,
manufacturing, healthcare) 40
• Stable government with a long-term secular and growth oriented
outlook 45
• Few large domestic funds provide foreign investment
opportunities 50
2005/06 2006/07 2007/08 2008/09 2009/10
Threats
VC PE VCPE
• Competition from emerging nations (e.g., Brazil, China) to attract
foreign VC/PE funds
• Unclear policy and taxation Comparison within Peer Group
2005/06 2009/10 Quar le
Outlook
Rank Value Rank 4th 1st
• Cross-sector growth and a strong financial services framework
Hong Kong 4 79,5 5
characterize the economy. A stable government is also expected
to encourage further foreign investment, thereby providing Japan 7 76,5 7
opportunities for VC/PE Re c of Korea 15 67,5 13
Mala a 23 54,4 25
Nishesh Dalal, Associate Director, Ernst & Young India C a 42 48,5 28
I a 46 40,9 38
n Fede on 49 38,0 48
Indone a 60 30,7 54
P es 57 26,1 61
112 The Global Venture Capital and Private Equity Country Attractiveness Index - 2009/2010 annual](https://image.slidesharecdn.com/iesevcpeindexannual2009-110326195513-phpapp02/85/Iese-vcpe-index_annual_2009-111-320.jpg)
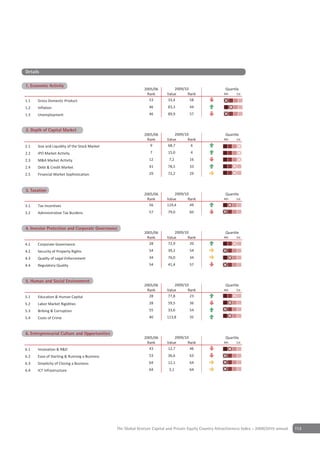
![Regional and country profiles
Indonesia
Capital: Jakarta ++ l Language: Indonesia ++ Currency: Rupiah
Basic Facts VCPE-Ranking
2005/06 2009/10 Quar le
Rank Value Rank 4th 1st
VCPE Ranking 60 30,7 54
Econom c Ac t 60 63,5 54
Depth of Cap. Market 39 13,8 31
Taxa on 48 97,5 57
In . Prot. & Corp. Go . 64 32,1 63
Hum. & Soc. En . 52 47,6 51
4th
Quar le
1st
Entrepr. Culture & Opp. 61 16,6 61
GDP 478 [bn USD] IPO Volume
Popula on 234 [mn] M&A Volume
GDP Growth '02 '08 VC Ac t
Pop. Growth '02 '08 PE Ac t Key Factors Performance
Econom c
Ac t
125
100
SWOT Analysis
Entrepr. Culture 75 Depth of Cap.
& Opp. 50
Market
Strengths
25
• High economic growth
0
• High market potential from large population and rich natural
resources
Hum. & Soc.
Taxa on
Weaknesses En ronment
• Disadvantageous tax system towards double taxation on income
Indones a
• Inefficient IPO regulation that reduces VC/PE exit options In . Prot. & As a
Corp. Go .
Opportunities United States = 100 Points
• Opportunities for acquiring under-valued assets of under-
managed large family companies Separate VC and PE Indices
• Intensification of infrastructure development and natural resource 52
exploration
54
Threats
• Indonesian law does not recognize limited partnership 56
Index Rank
• Weak judicial independence
58
Outlook
• Despite a few large VC/PE transactions lately and the country's 60
high market potential, VC/PE is still developing. One of the
62
obstacles is that Indonesia’s law does not recognize limited
partnerships and collective investment framework. Most existing 64
VC/PE firms operate as extended arm of VC/PE institutions of 2005/06 2006/07 2007/08 2008/09 2009/10
developed countries. Current target industries include coal mining, VC PE VCPE
infrastructure, telecommunication, CPO plantation and banking
Comparison within Peer Group
Giuseppe Nicolosi, Managing Partner, Ernst & Young Indonesia
2005/06 2009/10 Quar le
Rank Value Rank 4th 1st
Hong Kong 4 79,5 5
Japan 7 76,5 7
Republ c of Korea 15 67,5 13
Mala s a 23 54,4 25
Ch na 42 48,5 28
In a 46 40,9 38
Russ an Federa on 49 38,0 48
Indones a 60 30,7 54
Ph l pp nes 57 26,1 61
114 The Global Venture Capital and Private Equity Country Attractiveness Index - 2009/2010 annual](https://image.slidesharecdn.com/iesevcpeindexannual2009-110326195513-phpapp02/85/Iese-vcpe-index_annual_2009-113-320.jpg)

![Regional and country profiles
Ireland
Capital: Dublin ++ Official Language: English, Irish ++ Currency: Euro
Basic Facts VCPE-Ranking
2005/06 2009/10 Quartile
Rank Value Rank 4th 1st
VCPE Ranking 16 58,3 21
Economic Activity 1 84,4 28
Depth of Cap. Market 28 10,7 41
Taxation 6 143,3 5
Inv. Prot. & Corp. Gov. 9 101,6 7
Hum. & Soc. Env. 10 99,6 13
Quartile
4th 1st
Entrepr. Culture & Opp. 19 78,1 17
GDP 270 [bn USD] IPO Volume
Population 4 [mn] M&A Volume
GDP Growth '02 '08 VC Activity
Pop. Growth '02 '08 PE Activity Key Factors Performance
Economic
Activity
150
125
SWOT Analysis 100
Entrepr. Culture Depth of Cap.
& Opp. 75 Market
Strengths 50
25
• Strow focus on indigenous entrepreneurs/start-ups 0
• VC/PE co-invest with government funding which reduces
institutional funding required
Hum. & Soc.
• Successful fundraisings Environment
Taxation
Weaknesses Ireland
• Limited debt available Inv. Prot. & Western Europe
• Low risk appetite Corp. Gov.
United States = 100 Points
• A number of sectors which VC/PE find less attractive such as retail,
leisure and construction Separate VC and PE Indices
Opportunities 12
• Government focus on high potential and "Smart Economy"
14
businesses such as new green technologies
• Strong medical device/pharmaceutical industry and renewable 16
energy opportunities
Index Rank
18
• Valuations are coming down as there are less funding alternatives
available to investees 20
22
Threats
• Recession is significantly deeper than in other countries 24
• Company failures are increasing
26
• Declining opportunities for start-ups in the recession except in 2005/06 2006/07 2007/08 2008/09 2009/10
defensive sectors VC PE VCPE
• Declining M&A market means reduced exit opportunities and
returns for VC/PE
Comparison within Peer Group
Outlook Quartile
2005/06 2009/10
• Increasing VC/PE focus on technology and biotech with high Rank Value Rank 4th 1st
expertise developed in these sectors less competition from private Germany 9 69,1 10
high net worth funds due to their exposure in declining markets
Denmark 10 67,7 12
• Government provides tax breaks
Finland 12 65,9 15
John O’Halloran, Director, Ernst & Young Ireland France 17 65,2 16
Belgium 19 61,1 17
Austria 20 58,6 19
Ireland 16 58,3 21
Italy 32 47,5 29
Greece 44 40,7 39
116 The Global Venture Capital and Private Equity Country Attractiveness Index - 2009/2010 annual](https://image.slidesharecdn.com/iesevcpeindexannual2009-110326195513-phpapp02/85/Iese-vcpe-index_annual_2009-115-320.jpg)
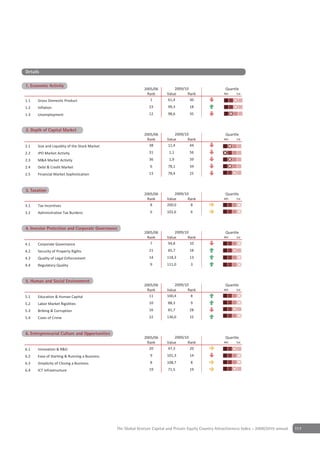
![Regional and country profiles
Israel
Capital: Jerusalem ++ Official Language: Hebrew, Arabic ++ Currency: New Israeli Shekel
Basic Facts VCPE-Ranking
2005/06 2009/10 Quartile
Rank Value Rank 4th 1st
VCPE Ranking 21 55,8 22
Economic Activity 23 87,7 24
Depth of Cap. Market 24 15,3 26
Taxation 51 106,3 43
Inv. Prot. & Corp. Gov. 19 80,7 21
Hum. & Soc. Env. 21 78,8 24
Quartile
4th 1st
Entrepr. Culture & Opp. 21 71,1 21
GDP 203 [bn USD] IPO Volume
Population 7 [mn] M&A Volume
GDP Growth '02 '08 VC Activity
Pop. Growth '02 '08 PE Activity Key Factors Performance
Economic
Activity
150
125
SWOT Analysis 100
Entrepr. Culture Depth of Cap.
& Opp. 75 Market
Strengths 50
• Strong entrepreneurial culture 25
0
• Mature market with very good infrastructure
• Government support, favorite tax regime and solid regulatory
environment Hum. & Soc.
Taxation
Environment
• High level human capital
Israel
• International culture with a global vision
• Solid banking system Inv. Prot. & Middle East
Corp. Gov.
United States = 100 Points
Weaknesses
• Geo-political situation
Separate VC and PE Indices
Opportunities
20
• Many late stage companies
• Lack of financing for mega deals 21
• Some privatization 22
• Opportunities in cleantech market
Index Rank
23
Threats
24
• Security and political environment
• Lack of long-term planning 25
Outlook 26
• Israel’s economy is expected to have good growth mainly due to 27
the perspectives in technology based industries. 2005/06 2006/07 2007/08 2008/09 2009/10
VC PE VCPE
Oren Bar-On, Partner, Ernst & Young Israel
Comparison within Peer Group
2005/06 2009/10 Quartile
Rank Value Rank 4th 1st
Israel 21 55,8 22
United Arab Emirates 26 51,7 26
Saudi Arabia 36 46,4 30
Kuwait 29 40,1 42
Oman 38 38,1 46
Morocco 58 30,3 56
Egypt 53 30,1 57
Nigeria 64 24,4 62
Kenya 63 19,3 64
118 The Global Venture Capital and Private Equity Country Attractiveness Index - 2009/2010 annual](https://image.slidesharecdn.com/iesevcpeindexannual2009-110326195513-phpapp02/85/Iese-vcpe-index_annual_2009-117-320.jpg)

![Regional and country profiles
Italy
Capital: Rome ++ Official Language: Italian ++ Currency: Euro
Basic Facts VCPE-Ranking
2005/06 2009/10 Quartile
Rank Value Rank 4th 1st
VCPE Ranking 32 47,5 29
Economic Activity 50 89,7 18
Depth of Cap. Market 17 17,7 21
Taxation 55 101,6 49
Inv. Prot. & Corp. Gov. 46 53,1 46
Hum. & Soc. Env. 48 52,0 47
Quartile
4th 1st
Entrepr. Culture & Opp. 27 56,3 27
GDP 2286 [bn USD] IPO Volume
Population 59 [mn] M&A Volume
GDP Growth '02 '08 VC Activity
Pop. Growth '02 '08 PE Activity Key Factors Performance
Economic
Activity
125
SWOT Analysis 100
Entrepr. Culture 75 Depth of Cap.
& Opp. 50
Market
Strengths
25
• Banking system only moderately hit by the global credit crunch
0
compared to other industrialized countries
• Highly fragmented and flexible industrial base mainly comprised
of small-to-mid family-owned businesses Hum. & Soc.
Taxation
Environment
Weaknesses Italy
• Companies operating in mature low value-added industries Inv. Prot. & Western Europe
exposed to international competition from Eastern European and Corp. Gov.
United States = 100 Points
Asian countries
• Articulated and significant tax burdens both for companies and
Separate VC and PE Indices
individuals
• Labor market less flexible compared to other industrialized 26
countries 28
• Investments in infrastructure below European average and low
30
level of Internet penetration and computer literacy
Index Rank
• SMEs companies with unsophisticated reporting systems and 32
statutory accounts often only prepared for compliance/tax
34
purposes
36
Opportunities
• Market fragmentation leaves room for viable deals in the mid-cap 38
market 40
• Launch of AIM Italy dedicated to small/mid size companies and 2005/06 2006/07 2007/08 2008/09 2009/10
simplified listing procedures VC PE VCPE
• Change in bankruptcy law creates opportunities for turnaround
transactions Comparison within Peer Group
Threats 2005/06 2009/10 Quartile
• Limited VC role in supporting R&D activity and early stage Rank Value Rank 4th 1st
financing in innovative ventures Germany 9 69,1 10
Outlook Denmark 10 67,7 12
• Once current uncertainty is overcome, the Italian market may Finland 12 65,9 15
present good grounds for investment opportunities and growth France 17 65,2 16
Belgium 19 61,1 17
Umberto Nobile, Partner, Ernst & Young Italy
Austria 20 58,6 19
Ireland 16 58,3 21
Italy 32 47,5 29
Greece 44 40,7 39
120 The Global Venture Capital and Private Equity Country Attractiveness Index - 2009/2010 annual](https://image.slidesharecdn.com/iesevcpeindexannual2009-110326195513-phpapp02/85/Iese-vcpe-index_annual_2009-119-320.jpg)
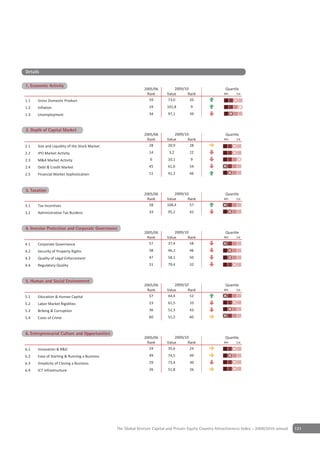
![Regional and country profiles
Japan
Capital: Tokyo ++ O cial Language: Japanese ++ Currency: Yen
Basic Facts VCPE-Ranking
2005/06 2009/10 Quar le
Rank Value Rank 4th 1st
VCPE Ranking 7 76,5 7
Econom c Ac 9 96,9 6
Depth of Cap. Market 4 37,5 7
Taxa on 60 101,6 48
In . Prot. & Corp. Go . 17 91,0 18
Hum. & Soc. En . 18 92,1 18
4th
Quar le
1st
Entrepr. Culture & Opp. 8 94,7 8
GDP 5009 [bn USD] IPO Volume
Popul on 128 [mn] M&A Volume
GDP Growth '02 '08 VC
Pop. Growth '02 '08 PE Key Factors Performance
Econom c
Ac t
125
100
SWOT Analysis
Entrepr. Culture 75 Depth of Cap.
& Opp. 50
Market
Strengths
25
• Japan is still the world’s second largest economy
0
• Market leading technology in many sectors
Weaknesses Hum. & Soc.
Taxa on
• VC/PE investors are seen critically regarding their commitment to En ronment
the companies’ interests
Japan
• Relatively weak corporate governance compared to Western In . Prot. & As a
standards Corp. Go .
United States = 100 Points
Opportunities
• Japanese companies receive limited investments and would Separate VC and PE Indices
benefit from VC/PE as they are broadly diversified with many non-
5
core businesses
• Succession issues in family-owned businesses foster VC/PE 6
investment
7
• Take-private deals and PIPEs are becoming more understood and
Index Rank
accepted by management 8
Threats
9
• Increasingly negative sentiment towards VC/PE if VC/PE investors
are not seen as appropriately supporting investee companies in 10
the current economic climate
11
• Increasingly difficult funding environment
2005/06 2006/07 2007/08 2008/09 2009/10
Outlook VC PE VCPE
• VC/PE sector will likely pick up in 2011
• Many companies will find it increasingly hard to obtain access Comparison within Peer Group
to additional capital and will need to deploy their capital more
2005/06 2009/10 Quar le
effectively
Rank Value Rank 4th 1st
• Many companies will be forced to divest non-core businesses
Hong Kong 4 79,5 5
Michael Buxton, Partner, Ernst & Young Japan Japan 7 76,5 7
Re c of Korea 15 67,5 13
Mala a 23 54,4 25
C a 42 48,5 28
I a 46 40,9 38
n Fede on 49 38,0 48
Indone a 60 30,7 54
P es 57 26,1 61
122 The Global Venture Capital and Private Equity Country Attractiveness Index - 2009/2010 annual](https://image.slidesharecdn.com/iesevcpeindexannual2009-110326195513-phpapp02/85/Iese-vcpe-index_annual_2009-121-320.jpg)
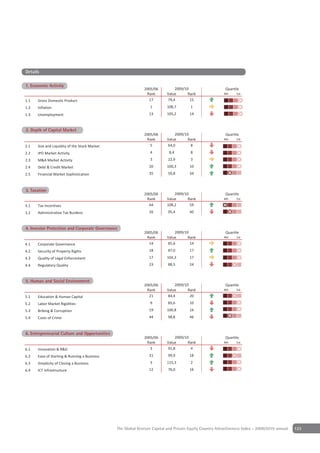
![Regional and country profiles
Kenya
Capital: Nairobi ++ O cial Language: English, Swahili ++ Currency: Kenyan Shilling
Basic Facts VCPE-Ranking
2005/06 2009/10 Quar le
Rank Value Rank 4th 1st
VCPE Ranking 63 19,3 64
Econom c Ac t 66 6,6 66
Depth of Cap. Market 57 7,2 57
Taxa on 50 68,7 63
In . Prot. & Corp. Go . 50 43,0 55
Hum. & Soc. En . 58 38,3 59
4th
Quar le
1st
Entrepr. Culture & Opp. 60 17,6 60
GDP 30 [bn USD] IPO Volume
Popula on 39 [mn] M&A Volume
GDP Growth '02 '08 VC Ac t
Pop. Growth '02 '08 PE Ac t Key Factors Performance
Econom c
Ac t
125
100
SWOT Analysis
Entrepr. Culture 75 Depth of Cap.
& Opp. 50
Market
Strengths
25
• Regional hub, providing access to the rest of East Africa
0
• Well developed IT and communication infrastructure
• Highly qualified pool of professionals in all disciplines
• Increased access to credit, and presence of Development Banks Hum. & Soc.
Taxa on
En ronment
e.g., PTA Bank, IFC, EADB, ADB
• Government encouraging and facilitating PPPs Ken a
• Presence of International VC/PE firms coupled with large local In . Prot. & Afr ca
Corp. Go .
firms United States = 100 Points
Weaknesses
Separate VC and PE Indices
• Preference of bank debt and public equity markets
• Shocks of the 2008 political unrest result in higher risk rating 62
• High cost of doing business e.g., high cost of energy
• Predominantly agro-based economy 63
• Tax regime
Index Rank
Opportunities 64
• Returning professionals from developed countries
• Economic liberalization programs, and Internationalization
• SMEs face financing challenges 65
• Robust emerging middle class will spur economy
• The emerging security exchanges in the East African region will 66
provide better exit routes 2005/06 2006/07 2007/08 2008/09 2009/10
VC PE VCPE
Threats
• Potential political instability
• Opening of COMESA markets may lead to cheap imports that Comparison within Peer Group
harm local industries 2005/06 2009/10 Quar le
• Level of corruption Rank Value Rank 4th 1st
Israel 21 55,8 22
Outlook
• Increased focus on PPP will boost the growth of VC/PE Saud Arab a 36 46,4 30
• Projected higher economic growth Kuwa t 29 40,1 42
• The global crisis has increased interest in Africa, with Kenya being South Afr ca 43 39,5 43
a beneficiary Oman 38 38,1 46
Morocco 58 30,3 56
Evans Kamau, Senior Manager, Ernst & Young Kenya
Eg pt 53 30,1 57
N ger a 64 24,4 62
Ken a 63 19,3 64
124 The Global Venture Capital and Private Equity Country Attractiveness Index - 2009/2010 annual](https://image.slidesharecdn.com/iesevcpeindexannual2009-110326195513-phpapp02/85/Iese-vcpe-index_annual_2009-123-320.jpg)
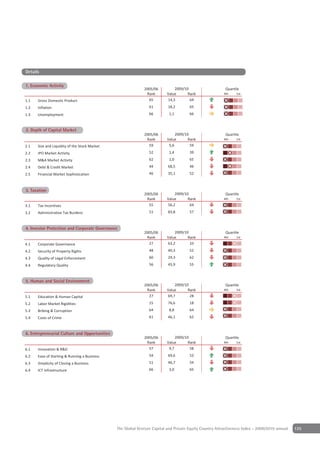
![Regional and country profiles
Kuwait
Capital: Kuwait City ++ Official Language: Arabic ++ Currency: Kuwaiti Dinar
Basic Facts VCPE-Ranking
2005/06 2009/10 Quartile
Rank Value Rank 4th 1st
VCPE Ranking 29 40,1 42
Economic Activity 3 92,4 13
Depth of Cap. Market 37 11,6 38
Taxation 3 50,2 64
Inv. Prot. & Corp. Gov. 35 62,1 40
Hum. & Soc. Env. 30 73,0 33
Quartile
4th 1st
Entrepr. Culture & Opp. 39 32,0 45
GDP 141 [bn USD] IPO Volume
Population 3 [mn] M&A Volume
GDP Growth '02 '08 VC Activity
Pop. Growth '02 '08 PE Activity Key Factors Performance
Economic
Activity
150
125
SWOT Analysis 100
Entrepr. Culture Depth of Cap.
& Opp. 75 Market
Strengths 50
• High sovereign rating for Kuwait 25
0
• Cash rich economy
• Most businesses adopt/use IFRS
Hum. & Soc.
Taxation
Weaknesses Environment
• Weakness of corporate governance as most businesses are Kuwait
controlled by influential families Middle East
Inv. Prot. &
• Asset starved economy – impacting asset pricing (too much cash Corp. Gov.
United States = 100 Points
chasing few good assets)
• Highly dependent on oil prices
Separate VC and PE Indices
Opportunities
22
• Consolidation imminent in certain sectors
• Business houses need to restructure/transform into public 27
companies as part of overall estate planning
• Opportunities for public to private transactions
Index Rank
32
Threats
• Size and liquidity of stock market may affect exits 37
Outlook 42
• Increased PE activity as a result of consolidation in selected
sectors – motivated in part by the current economic environment 47
• Availability of assets at attractive valuations 2005/06 2006/07 2007/08 2008/09 2009/10
VC PE VCPE
Anil Menon, Director, Ernst & Young Kuwait
Comparison within Peer Group
2005/06 2009/10 Quartile
Rank Value Rank 4th 1st
Israel 21 55,8 22
United Arab Emirates 26 51,7 26
Saudi Arabia 36 46,4 30
Kuwait 29 40,1 42
Oman 38 38,1 46
Morocco 58 30,3 56
Egypt 53 30,1 57
Nigeria 64 24,4 62
Kenya 63 19,3 64
126 The Global Venture Capital and Private Equity Country Attractiveness Index - 2009/2010 annual](https://image.slidesharecdn.com/iesevcpeindexannual2009-110326195513-phpapp02/85/Iese-vcpe-index_annual_2009-125-320.jpg)
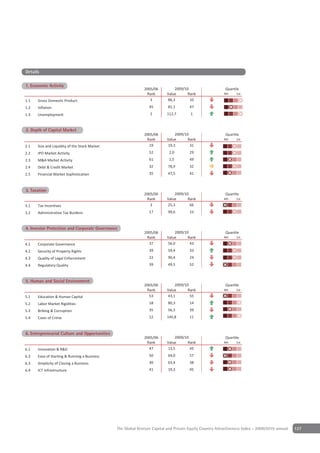
![Regional and country profiles
Latvia
Capital: Riga ++ Official Language: Latvian ++ Currency: Latvian Lats
Basic Facts VCPE-Ranking
2005/06 2009/10 Quartile
Rank Value Rank 4th 1st
VCPE Ranking 39 35,6 50
Economic Activity 47 37,7 64
Depth of Cap. Market 58 6,2 60
Taxation 9 141,5 7
Inv. Prot. & Corp. Gov. 27 72,5 29
Hum. & Soc. Env. 35 69,5 36
Quartile
4th 1st
Entrepr. Culture & Opp. 33 38,7 36
GDP 33 [bn USD] IPO Volume
Population 2 [mn] M&A Volume
GDP Growth '02 '08 VC Activity
Pop. Growth '02 '08 PE Activity Key Factors Performance
Economic
Activity
150
125
SWOT Analysis 100
Entrepr. Culture Depth of Cap.
& Opp. 75 Market
Strengths 50
• EU efforts stimulate investments in growth companies with the 25
0
JEREMIE fund – the launch has meant more cash available for
future deals
Hum. & Soc.
Taxation
Weaknesses Environment
• VC is historically underdeveloped Latvia
• Local PE houses have invested actively but with heavy leverage Inv. Prot. & Eastern Europe
• Only a few have saved cash or invested conservatively over the Corp. Gov.
United States = 100 Points
last years
Opportunities Separate VC and PE Indices
• Bank financing availability seems to be easing gradually, which 35
raises hope for some deals to commence in the future 37
Threats 39
• The prospects of many have been slashed by the crisis 41
Index Rank
43
Outlook 45
• Development of VC/PE investments will be much dependent on 47
the general public perceptions about growth prospects of Baltic 49
economies 51
• GPs from abroad will start showing stronger interest for Baltic 53
companies when the bottom has been reached and the growth 55
opportunities become visible 2005/06 2006/07 2007/08 2008/09 2009/10
VC PE VCPE
Raimonds Kulbergs, Manager, Ernst & Young Latvia
Comparison within Peer Group
2005/06 2009/10 Quartile
Rank Value Rank 4th 1st
Poland 41 45,8 31
Czech Republic 33 45,5 34
Estonia 30 44,5 35
Hungary 34 41,1 37
Lithuania 37 40,4 40
Croatia 47 38,6 45
Romania 52 38,1 47
Latvia 39 35,6 50
Bulgaria 48 30,6 55
128 The Global Venture Capital and Private Equity Country Attractiveness Index - 2009/2010 annual](https://image.slidesharecdn.com/iesevcpeindexannual2009-110326195513-phpapp02/85/Iese-vcpe-index_annual_2009-127-320.jpg)
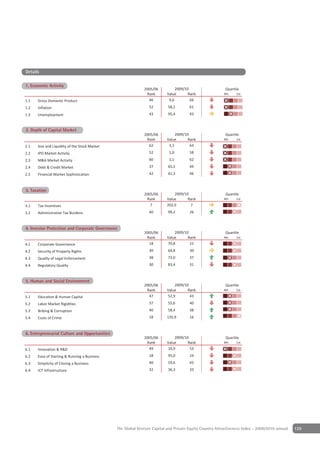
![Regional and country profiles
Lithuania
Capital: Vilnius ++ Official Language: Lithuanian ++ Currency: Lithuanian Litas
Basic Facts VCPE-Ranking
2005/06 2009/10 Quartile
Rank Value Rank 4th 1st
VCPE Ranking 37 40,4 40
Economic Activity 35 67,2 48
Depth of Cap. Market 54 6,9 58
Taxation 10 136,7 10
Inv. Prot. & Corp. Gov. 31 69,9 32
Hum. & Soc. Env. 43 63,9 40
Quartile
4th 1st
Entrepr. Culture & Opp. 29 49,6 29
GDP 48 [bn USD] IPO Volume
Population 3 [mn] M&A Volume
GDP Growth '02 '08 VC Activity
Pop. Growth '02 '08 PE Activity Key Factors Performance
Economic
Activity
150
125
SWOT Analysis 100
Entrepr. Culture Depth of Cap.
& Opp. 75 Market
Strengths 50
• Flexibility of market players presents good prospects for the future 25
0
• Open market, having good relationships with both Western and
Eastern Europe
Hum. & Soc.
Taxation
Weaknesses Environment
• Lack of available capital and innovation in using alternative means Lithuania
of financing Eastern Europe
Inv. Prot. &
• Low level of experience of local market players Corp. Gov.
United States = 100 Points
Opportunities
• Low priced market as a consequence of current downturn in the Separate VC and PE Indices
economy
35
• Numerous opportunities relating to the operational effectiveness
37
of businesses, synergies, and management, enhancing the value of
businesses in the future 39
Index Rank
Threats 41
• Changing legislation in tax area as well as in other business 43
related areas (e.g., competition, de-monopolization) towards
45
unfavorable direction
47
• Late and very limited credit market reopening
• Negative short- and mid-term outlook on Lithuania from foreign 49
investors
2005/06 2006/07 2007/08 2008/09 2009/10
Outlook VC PE VCPE
• Challenging economical environment will leave the strongest
players in the market and will strengthen their position Comparison within Peer Group
2005/06 2009/10 Quartile
Rolandas Laukaitis, Senior Manager, Ernst & Young Lithuania
Rank Value Rank 4th 1st
Poland 41 45,8 31
Czech Republic 33 45,5 34
Estonia 30 44,5 35
Hungary 34 41,1 37
Lithuania 37 40,4 40
Croatia 47 38,6 45
Romania 52 38,1 47
Latvia 39 35,6 50
Bulgaria 48 30,6 55
130 The Global Venture Capital and Private Equity Country Attractiveness Index - 2009/2010 annual](https://image.slidesharecdn.com/iesevcpeindexannual2009-110326195513-phpapp02/85/Iese-vcpe-index_annual_2009-129-320.jpg)
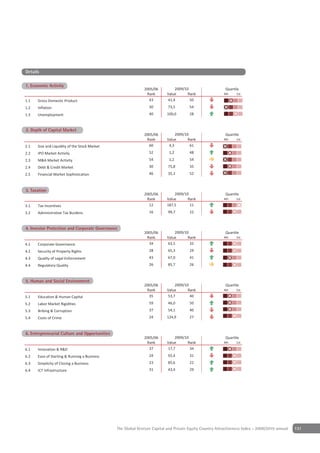
![Regional and country profiles
Luxembourg
Capital: Luxembourg ++ Official Language: Luxermbourgish, French, German ++ Currency: Euro
Basic Facts VCPE-Ranking
2005/06 2009/10 Quartile
Rank Value Rank 4th 1st
VCPE Ranking 24 54,6 24
Economic Activity 5 92,4 12
Depth of Cap. Market 40 10,1 42
Taxation 12 136,4 11
Inv. Prot. & Corp. Gov. 13 94,7 13
Hum. & Soc. Env. 34 81,1 22
Quartile
4th 1st
Entrepr. Culture & Opp. 20 74,6 20
GDP 54 [bn USD] IPO Volume
Population 0 [mn] M&A Volume
GDP Growth '02 '08 VC Activity
Pop. Growth '02 '08 PE Activity Key Factors Performance
Economic
Activity
150
125
SWOT Analysis 100
Entrepr. Culture Depth of Cap.
& Opp. 75 Market
Strengths 50
• Direct and personal contact with regulatory authorities with 25
0
respect to accreditation processes and tax treatment
• Multilingual and internationally-oriented qualified workforce
• No constraints applicable to pension funds when investing in Hum. & Soc.
Taxation
Environment
VC/PE and absence of geographical restrictions for investments
Luxembourg
outside Luxembourg
• Favorable tax policy with respect to investments in VC/PE, Inv. Prot. & Western Europe
Corp. Gov.
intellectual property and R&D expenditures United States = 100 Points
• Complete portfolio of products enabling maximum legal, tax and
operational structuring flexibility Separate VC and PE Indices
Weaknesses 20
• Lack of specific tax rate for SMEs 21
• Limited deal flow 22
23
Opportunities
Index Rank
24
• Re-domiciliation of businesses looking for an on-shore European 25
VC/PE Fund label 26
• Stock options tax treatment could be used to support talent 27
retention in investee company 28
• VC/PE structures very relevant for investment in cleantech and 29
renewable energies 30
2005/06 2006/07 2007/08 2008/09 2009/10
Threats
VC PE VCPE
• Duplication of available products and tax incentives by
competitive locations
• Treaty access requires strict compliance with substance Comparison within Peer Group
requirements 2005/06 2009/10 Quartile
Rank Value Rank 4th 1st
Outlook
Germany 9 69,1 10
• Thanks to a tradition of innovation and client-focused attitude
of authorities, Luxembourg managed to position itself as a major Denmark 10 67,7 12
center for VC/PE on-shore investment and fund structuring in Finland 12 65,9 15
Europe. The country seems fully prepared to welcome VC/PE France 17 65,2 16
players considering on-shore re-domiciliation in a global context Belgium 19 61,1 17
calling for increased regulation
Austria 20 58,6 19
Ireland 16 58,3 21
Luxembourg 24 54,6 24
Greece 44 40,7 39
132 The Global Venture Capital and Private Equity Country Attractiveness Index - 2009/2010 annual](https://image.slidesharecdn.com/iesevcpeindexannual2009-110326195513-phpapp02/85/Iese-vcpe-index_annual_2009-131-320.jpg)
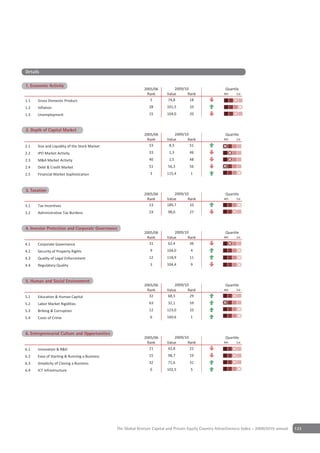
![Regional and country profiles
Malaysia
Capital: Kuala Lumpur ++ l Language: Bahasa Melayu ++ Currency: Malaysian Ringgit
Basic Facts VCPE-Ranking
2005/06 2009/10 Quar le
Rank Value Rank 4th 1st
VCPE Ranking 23 54,4 25
Econom c Ac t 33 77,5 38
Depth of Cap. Market 12 23,0 15
Taxa on 27 123,7 21
In . Prot. & Corp. Go . 25 73,3 28
Hum. & Soc. En . 22 75,8 28
4th
Quar le
1st
Entrepr. Culture & Opp. 31 43,2 32
GDP 209 [bn USD] IPO Volume
Popula on 27 [mn] M&A Volume
GDP Growth '02 '08 VC Ac t
Pop. Growth '02 '08 PE Ac t Key Factors Performance
Econom c
Ac t
125
100
SWOT Analysis
Entrepr. Culture 75 Depth of Cap.
& Opp. 50
Market
Strengths
25
• Established regulatory framework and financial markets, both
0
conventional and Islamic
• Government support and tax incentives for the VC/PE industry
• Liberalization of foreign equity restrictions should widen the Hum. & Soc.
Taxa on
En ronment
spectrum of opportunities in PIPEs and buyouts by foreign funds
Mala s a
Weaknesses
In . Prot. & As a
• Sources of capital still come predominantly from government Corp. Go . United States = 100 Points
agencies, despite consistent calls for banks, pensions funds and
insurance companies to increase their participation
Separate VC and PE Indices
• Governmental and regulatory approval processes remain sub-
optimal despite current liberalization measures 17
• Government-linked investment corporations (“GLICs”) and 18
government-linked companies (“GLCs”) continue to add to their 19
portfolios through direct investments, which stiffens competition 20
Index Rank
for larger deals 21
• Need for improvement of local PE and VC managers’ skills 22
23
Opportunities 24
• Large and diversified conglomerates and GLCs continue to rebalance 25
their portfolios through divestment of non-core businesses 26
• Several GLICs hold substantial direct investments in related 27
enterprises which provide attractive consolidation opportunities 2005/06 2006/07 2007/08 2008/09 2009/10
• Stimulus packages are slowly taking effect, creating opportunities VC PE VCPE
to participate in capital raising activities by private sector promoters
Threats Comparison within Peer Group
• Increased competition for already limited quality deals by SPACs 2005/06 2009/10 Quar le
that raise public capital Rank Value Rank 4th 1st
• Government-driven national PE management company (“Ekuinas”) Hong Kong 4 79,5 5
with an initial allocation of RM500 million for investments in SMEs Japan 7 76,5 7
Outlook Republ c of Korea 15 67,5 13
• Cautious optimism is returning, but competition in the industry is Mala s a 23 54,4 25
likely to increase Ch na 42 48,5 28
In a 46 40,9 38
Edwin Chew, Executive Director, Ernst & Young Malaysia
Russ an Federa on 49 38,0 48
Indones a 60 30,7 54
Ph l pp nes 57 26,1 61
134 The Global Venture Capital and Private Equity Country Attractiveness Index - 2009/2010 annual](https://image.slidesharecdn.com/iesevcpeindexannual2009-110326195513-phpapp02/85/Iese-vcpe-index_annual_2009-133-320.jpg)
![Regional and country profiles
Mexico
Capital: Mexico City ++ Official Language: Spanish ++ Currency: Mexican Peso
Basic Facts VCPE-Ranking
2005/06 2009/10 Quartile
Rank Value Rank 4th 1st
VCPE Ranking 51 35,8 49
Economic Activity 30 80,5 32
Depth of Cap. Market 45 11,1 39
Taxation 44 108,9 40
Inv. Prot. & Corp. Gov. 51 51,9 47
Hum. & Soc. Env. 59 37,1 62
Quartile
4th 1st
Entrepr. Culture & Opp. 43 31,9 46
GDP 1084 [bn USD] IPO Volume
Population 108 [mn] M&A Volume
GDP Growth '02 '08 VC Activity
Pop. Growth '02 '08 PE Activity Key Factors Performance
Economic
Activity
125
SWOT Analysis 100
Entrepr. Culture 75 Depth of Cap.
& Opp. 50
Market
Strengths
25
• Tax treatment, and quality of accounting standards are relative
0
strengths
• Many newly registered businesses and entrepreneurial activities in
recent years Hum. & Soc.
Taxation
Environment
Weaknesses Mexico
• IPOs remain a difficult and unattractive exit option for VC/PE Inv. Prot. & Latin America
investments Corp. Gov.
United States = 100 Points
• Insurers are not permitted to use VC/PE assets to cover solvency
margins and face strong restrictions with respect to their VC/PE
Separate VC and PE Indices
allocations
• Mexican law protects intellectual property rights, but enforcement 46
is weak and pirated goods exist throughout the country
47
Opportunities
48
• Arise by improvements of tax treatment, corporate governance,
Index Rank
protection of minority rights and quality of accounting standards 49
Threats
50
• Growing evidence of violence and crime
• Need to lift barriers to institutional investment and improve the 51
access to equity markets for SMEs
52
Outlook 2005/06 2006/07 2007/08 2008/09 2009/10
• Underperform relative to the size and the potential of the VC PE VCPE
country´s economy
Comparison within Peer Group
2005/06 2009/10 Quartile
Rank Value Rank 4th 1st
Chile 27 45,8 32
Mexico 51 35,8 49
Brazil 56 34,6 51
Uruguay 50 33,4 52
Peru 54 32,4 53
Colombia 55 29,4 58
Argentina 59 29,1 59
Paraguay 66 14,9 65
Venezuela 65 8,9 66
136 The Global Venture Capital and Private Equity Country Attractiveness Index - 2009/2010 annual](https://image.slidesharecdn.com/iesevcpeindexannual2009-110326195513-phpapp02/85/Iese-vcpe-index_annual_2009-135-320.jpg)
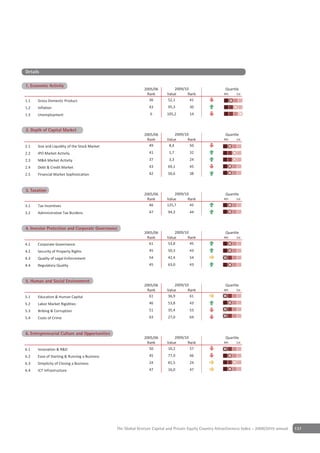
![Regional and country profiles
Morocco
Capital: Rabat ++ Official Language: Arabic ++ Currency: Moroccan Dirham
Basic Facts VCPE-Ranking
2005/06 2009/10 Quartile
Rank Value Rank 4th 1st
VCPE Ranking 58 30,3 56
Economic Activity 53 65,0 51
Depth of Cap. Market 55 9,1 46
Taxation 59 101,4 50
Inv. Prot. & Corp. Gov. 60 38,8 59
Hum. & Soc. Env. 57 37,9 60
Quartile
4th 1st
Entrepr. Culture & Opp. 52 26,2 53
GDP 87 [bn USD] IPO Volume
Population 32 [mn] M&A Volume
GDP Growth '02 '08 VC Activity
Pop. Growth '02 '08 PE Activity Key Factors Performance
Economic
Activity
125
SWOT Analysis 100
Entrepr. Culture 75 Depth of Cap.
& Opp. 50
Market
Strengths
25
• Low competition yet in one of the advanced African markets
0
• Will probably turn into a hub for European GPs expanding to
Northern African countries
• Geo-political location and relations: close to Spain, and Portugal, Hum. & Soc.
Taxation
Environment
strongly connected to France
Morocco
• Tax breaks providing incentives to investors
Inv. Prot. & Africa
Weaknesses Corp. Gov.
United States = 100 Points
• Barriers to trade and investment across the North African region
have stymied economic integration
Separate VC and PE Indices
• Economy remains dependent on agriculture
• 15 percent of the population is considered poor 54
Opportunities 55
• Economic growth rates of 5% expected
56
• Political activity to ease capital flows
Index Rank
• Opportunities from corporations that shift production to low cost 57
facilities
• State-led projects for roads, railways, ports, health and education 58
Threats 59
• Political tensions with Algeria
60
Outlook 2005/06 2006/07 2007/08 2008/09 2009/10
• Business-friendly reforms are expected to spur VC/PE activity VC PE VCPE
Comparison within Peer Group
2005/06 2009/10 Quartile
Rank Value Rank 4th 1st
Israel 21 55,8 22
Saudi Arabia 36 46,4 30
Kuwait 29 40,1 42
South Africa 43 39,5 43
Oman 38 38,1 46
Morocco 58 30,3 56
Egypt 53 30,1 57
Nigeria 64 24,4 62
Kenya 63 19,3 64
138 The Global Venture Capital and Private Equity Country Attractiveness Index - 2009/2010 annual](https://image.slidesharecdn.com/iesevcpeindexannual2009-110326195513-phpapp02/85/Iese-vcpe-index_annual_2009-137-320.jpg)
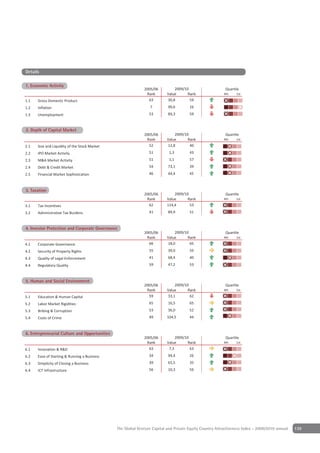
![Regional and country profiles
Netherlands
Capital: Amsterdam ++ Official Language: Dutch ++ Currency: Euro
Basic Facts VCPE-Ranking
2005/06 2009/10 Quartile
Rank Value Rank 4th 1st
VCPE Ranking 14 70,1 9
Economic Activity 18 101,2 3
Depth of Cap. Market 15 22,1 16
Taxation 46 118,0 29
Inv. Prot. & Corp. Gov. 14 93,5 15
Hum. & Soc. Env. 16 95,6 16
Quartile
4th 1st
Entrepr. Culture & Opp. 9 95,7 6
GDP 859 [bn USD] IPO Volume
Population 17 [mn] M&A Volume
GDP Growth '02 '08 VC Activity
Pop. Growth '02 '08 PE Activity Key Factors Performance
Economic
Activity
125
SWOT Analysis 100
Entrepr. Culture 75 Depth of Cap.
& Opp. 50
Market
Strengths
25
• VC/PE is of great economic importance
0
• GPs are real active shareholders with extensive experience
• Dutch GPs are successful in receiving financing from banks as
they usually use less leverage Hum. & Soc.
Taxation
Environment
Weaknesses Netherlands
• VC/PE firms tend to focus primarily on financial results and cost Inv. Prot. & Western Europe
cutting, often by cutting headcount Corp. Gov.
United States = 100 Points
Opportunities
• Increasing activity of foreign VC/PE firms Separate VC and PE Indices
• VC/PE has become a fixed part of the investment portfolio of 4
many banks and pension funds
• Sharp increase in private investors, such as families and wealthy 6
individuals
8
Index Rank
Threats
• Number of transactions in the Dutch buy-out market remains low 10
• Increasing interest rates 12
• Limitations regarding the fiscal advantage of deducting interest
expenses 14
Outlook 16
• More equity capital is required for new investments 2005/06 2006/07 2007/08 2008/09 2009/10
• Disappointing performance of some portfolio companies VC PE VCPE
• Anticipated that portfolio companies of VC/PE firms surpass the
financial performance of publicly-listed companies Comparison within Peer Group
2005/06 2009/10 Quartile
Marc Guns, Partner, Ernst & Young Netherlands
Rank Value Rank 4th 1st
Netherlands 14 70,1 9
Germany 9 69,1 10
Denmark 10 67,7 12
Finland 12 65,9 15
France 17 65,2 16
Belgium 19 61,1 17
Austria 20 58,6 19
Ireland 16 58,3 21
Greece 44 40,7 39
140 The Global Venture Capital and Private Equity Country Attractiveness Index - 2009/2010 annual](https://image.slidesharecdn.com/iesevcpeindexannual2009-110326195513-phpapp02/85/Iese-vcpe-index_annual_2009-139-320.jpg)
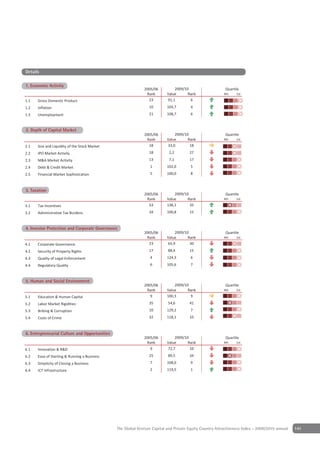
![Regional and country profiles
New Zealand
Capital: Wellington ++ Official Language: English, Maori ++ Currency: New Zealand Dollar
Basic Facts VCPE-Ranking
2005/06 2009/10 Quartile
Rank Value Rank 4th 1st
VCPE Ranking 18 60,0 18
Economic Activity 27 83,5 29
Depth of Cap. Market 27 11,1 40
Taxation 52 99,6 54
Inv. Prot. & Corp. Gov. 2 113,4 2
Hum. & Soc. Env. 3 116,5 4
Quartile
4th 1st
Entrepr. Culture & Opp. 16 82,2 15
GDP 126 [bn USD] IPO Volume
Population 4 [mn] M&A Volume
GDP Growth '02 '08 VC Activity
Pop. Growth '02 '08 PE Activity Key Factors Performance
Economic
Activity
125
SWOT Analysis 100
Entrepr. Culture 75 Depth of Cap.
& Opp. 50
Market
Strengths
25
• Encouraging clear and simple regulatory environment
0
• Recent introduction of limited liability partnership regime
enhances global consistency
• Growing awareness and support of VC activity complementing Hum. & Soc.
Taxation
Environment
already strong PE investment culture
New Zealand
Weaknesses Australasia
Inv. Prot. &
• Relative weakness of capital market Corp. Gov.
United States = 100 Points
Opportunities
• Increasing allocation of government controlled funds to private Separate VC and PE Indices
VC enterprises – continued stimulation of sector through the NZ
15
Superannuation Fund (SWF equivalent) and other initiatives 16
• Demographics mean there is a strong SME business base with 17
ageing investors looking for exit route 18
Index Rank
Threats 19
• Lack of sufficient IPO exit perspectives 20
21
Outlook 22
• Infrastructure opportunities expected to increase with a PPP 23
regime to be created. 24
• Returning strength to debt markets expected to increase leverage 25
opportunity. 2005/06 2006/07 2007/08 2008/09 2009/10
VC PE VCPE
Bryan Zekulich, Partner, Ernst & Young New Zealand
Comparison within Peer Group
2005/06 2009/10 Quartile
Rank Value Rank 4th 1st
Australia 6 81,9 4
Hong Kong 4 79,5 5
Singapore 5 78,5 6
Japan 7 76,5 7
Republic of Korea 15 67,5 13
New Zealand 18 60,0 18
Taiwan 25 55,3 23
Malaysia 23 54,4 25
China 42 48,5 28
142 The Global Venture Capital and Private Equity Country Attractiveness Index - 2009/2010 annual](https://image.slidesharecdn.com/iesevcpeindexannual2009-110326195513-phpapp02/85/Iese-vcpe-index_annual_2009-141-320.jpg)

![Regional and country profiles
Nigeria
Capital: Abuja ++ Official Language: English ++ Currency: Naira
Basic Facts VCPE-Ranking
2005/06 2009/10 Quartile
Rank Value Rank 4th 1st
VCPE Ranking 64 24,4 62
Economic Activity 65 59,8 57
Depth of Cap. Market 63 5,6 62
Taxation 43 101,3 51
Inv. Prot. & Corp. Gov. 62 39,7 57
Hum. & Soc. Env. 64 40,0 57
Quartile
4th 1st
Entrepr. Culture & Opp. 58 14,7 62
GDP 213 [bn USD] IPO Volume
Population 152 [mn] M&A Volume
GDP Growth '02 '08 VC Activity
Pop. Growth '02 '08 PE Activity Key Factors Performance
Economic
Activity
125
SWOT Analysis 100
Entrepr. Culture 75 Depth of Cap.
& Opp. 50
Market
Strengths
25
• Good growth prospects driven by oil reserves and a large
0
population
Weaknesses Hum. & Soc.
Taxation
• VC/PE markets are still "infant" compared to debt and public Environment
equity markets Nigeria
• Scarce talent for valuation and due diligence Inv. Prot. & Africa
• Entrepreneurs lack business skills Corp. Gov.
United States = 100 Points
• Protectionist tariffs, currency and other controls
• Limited regulatory support for VC/PE and few bankable projects
Separate VC and PE Indices
Opportunities
59
• Economic liberalization programs
• Improvements in legal infrastructure and corporate governance 60
• Increasing number of investment professionals
61
• Tax relief on some VC investments
Index Rank
• Opportunities caused by the SME Equity Investment Scheme 62
Threats
63
• Poor infrastructure
• Social/ethnic and religious unrest 64
• High corruption levels
65
Outlook 2005/06 2006/07 2007/08 2008/09 2009/10
• Nigeria was strongly affected by the global economic downturn VC PE VCPE
and might need longer to emerge from the slowdown
Comparison within Peer Group
Graham Stokoe, Associate Director, Ernst & Young South Africa
2005/06 2009/10 Quartile
Rank Value Rank 4th 1st
Israel 21 55,8 22
Saudi Arabia 36 46,4 30
Kuwait 29 40,1 42
South Africa 43 39,5 43
Oman 38 38,1 46
Morocco 58 30,3 56
Egypt 53 30,1 57
Nigeria 64 24,4 62
Kenya 63 19,3 64
144 The Global Venture Capital and Private Equity Country Attractiveness Index - 2009/2010 annual](https://image.slidesharecdn.com/iesevcpeindexannual2009-110326195513-phpapp02/85/Iese-vcpe-index_annual_2009-143-320.jpg)
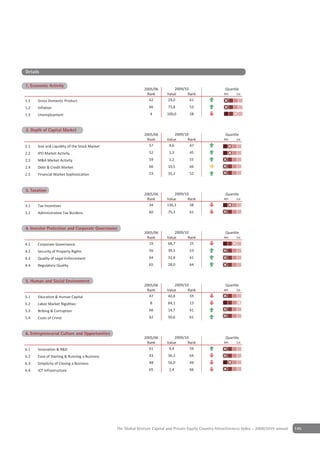
![Regional and country profiles
Norway
Capital: Oslo ++ Official Language: Bokmål Norwegian, Nynorsk Norwegian ++ Currency: Norvegian Krone
Basic Facts VCPE-Ranking
2005/06 2009/10 Quartile
Rank Value Rank 4th 1st
VCPE Ranking 11 66,3 14
Economic Activity 6 104,6 1
Depth of Cap. Market 22 16,1 24
Taxation 26 115,0 35
Inv. Prot. & Corp. Gov. 7 101,0 8
Hum. & Soc. Env. 9 97,7 15
Quartile
4th 1st
Entrepr. Culture & Opp. 11 93,8 9
GDP 444 [bn USD] IPO Volume
Population 5 [mn] M&A Volume
GDP Growth '02 '08 VC Activity
Pop. Growth '02 '08 PE Activity Key Factors Performance
Economic
Activity
125
SWOT Analysis 100
Entrepr. Culture 75 Depth of Cap.
& Opp. 50
Market
Strengths
25
• Strong VC/PE environment with local and Nordic players
0
• Some international players: mostly large Swedish PE firms
• Large amount of VC funds
• Strong VC/PE environment focusing on energy, oil services and ICT Hum. & Soc.
Taxation
Environment
Weaknesses Norway
• Limited number of large PE funds in Norway Inv. Prot. & Western Europe
Corp. Gov.
Opportunities United States = 100 Points
• Approximately €4,000 million in committed non-invested capital
• A large portion of investments are mature Separate VC and PE Indices
• Develop sectors towards cleantech, oil services and energy 8
Threats 9
• Shortage of funding from Norwegian banks 10
• IPOs do not exist as an exit strategy
11
Index Rank
Outlook 12
• Norway remains attractive for overseas investors, especially within
13
oil services sector
• VC/PE activities expected to increase at the end of 2009 14
15
Vegard Stevning, Partner, Ernst & Young Norway 16
2005/06 2006/07 2007/08 2008/09 2009/10
VC PE VCPE
Comparison within Peer Group
2005/06 2009/10 Quartile
Rank Value Rank 4th 1st
Germany 9 69,1 10
Denmark 10 67,7 12
Norway 11 66,3 14
Finland 12 65,9 15
France 17 65,2 16
Belgium 19 61,1 17
Austria 20 58,6 19
Ireland 16 58,3 21
Greece 44 40,7 39
146 The Global Venture Capital and Private Equity Country Attractiveness Index - 2009/2010 annual](https://image.slidesharecdn.com/iesevcpeindexannual2009-110326195513-phpapp02/85/Iese-vcpe-index_annual_2009-145-320.jpg)
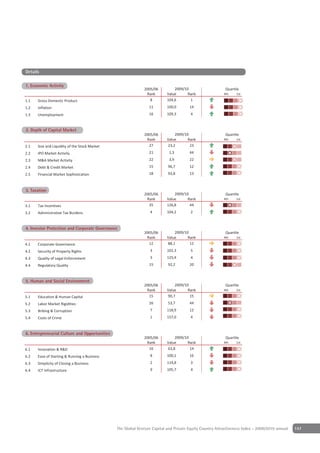
![Regional and country profiles
Oman
Capital: Muscat ++ Official Language: Arabic ++ Currency: Rial Omani
Basic Facts VCPE-Ranking
2005/06 2009/10 Quartile
Rank Value Rank 4th 1st
VCPE Ranking 38 38,1 46
Economic Activity 36 64,6 52
Depth of Cap. Market 49 8,0 53
Taxation 4 146,7 2
Inv. Prot. & Corp. Gov. 36 67,1 34
Hum. & Soc. Env. 26 84,5 21
Quartile
4th 1st
Entrepr. Culture & Opp. 49 23,6 56
GDP 56 [bn USD] IPO Volume
Population 3 [mn] M&A Volume
GDP Growth '02 '08 VC Activity
Pop. Growth '02 '08 PE Activity Key Factors Performance
Economic
Activity
150
125
SWOT Analysis 100
Entrepr. Culture Depth of Cap.
& Opp. 75 Market
Strengths 50
• High oil prices and increased perception of bargains in the 25
0
international market
Weaknesses Hum. & Soc.
Taxation
• Small market with very limited VC/PE activity and low Environment
attractiveness compared to the other GCC countries Oman
• Any entering private VC/PE company competes against Inv. Prot. & Middle East
established governmental and quasi-governmental funds Corp. Gov.
United States = 100 Points
Opportunities
• Deal flow opportunities from family owned conglomerates Separate VC and PE Indices
• Investment opportunities also exist in the form of second and 30
third generation family owned business offices 32
Threats 34
• Investment from government owned funds may decrease as the 36
Index Rank
country is running a budget deficit 38
• Considerable reduction of the number of acquisitions should oil 40
prices drop significantly 42
44
Outlook 46
• In the short term, the activities of private funds may be 48
constrained as the government has cash surpluses, some of which 50
will be spent domestically. However, the government funds started 2005/06 2006/07 2007/08 2008/09 2009/10
investing overseas especially in real estate and the oil sector and VC PE VCPE
become less keen to take equity stakes in local private enterprises
Comparison within Peer Group
Ragheev Singh, Partner, Ernst & Young Oman
2005/06 2009/10 Quartile
Rank Value Rank 4th 1st
Israel 21 55,8 22
United Arab Emirates 26 51,7 26
Saudi Arabia 36 46,4 30
Kuwait 29 40,1 42
Oman 38 38,1 46
Morocco 58 30,3 56
Egypt 53 30,1 57
Nigeria 64 24,4 62
Kenya 63 19,3 64
148 The Global Venture Capital and Private Equity Country Attractiveness Index - 2009/2010 annual](https://image.slidesharecdn.com/iesevcpeindexannual2009-110326195513-phpapp02/85/Iese-vcpe-index_annual_2009-147-320.jpg)
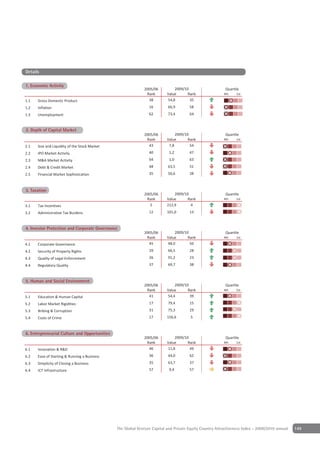
![Regional and country profiles
Paraguay
Capital: Asunción ++ Official Language: Spanish, Guaraní ++ Currency: Guaraní
Basic Facts VCPE-Ranking
2005/06 2009/10 Quartile
Rank Value Rank 4th 1st
VCPE Ranking 66 14,9 65
Economic Activity 64 43,6 61
Depth of Cap. Market 66 3,5 66
Taxation 11 136,2 12
Inv. Prot. & Corp. Gov. 65 21,6 65
Hum. & Soc. Env. 66 10,7 66
Quartile
4th 1st
Entrepr. Culture & Opp. 66 12,9 63
GDP 16 [bn USD] IPO Volume
Population 6 [mn] M&A Volume
GDP Growth '02 '08 VC Activity
Pop. Growth '02 '08 PE Activity Key Factors Performance
Economic
Activity
150
125
SWOT Analysis 100
Entrepr. Culture Depth of Cap.
& Opp. 75 Market
Strengths 50
• Tax incentives for entrepreneurs and companies 25
0
• Relatively low and decreasing unemployment rate
Weaknesses Hum. & Soc.
Taxation
• Underdeveloped capital market Environment
• Low investor protection and corporate governance structures Paraguay
• Missing entrepreneurial culture Inv. Prot. & Latin America
• Excessive bureaucracy, perceived crime and corruption, Corp. Gov.
United States = 100 Points
challenging infrastructure
Opportunities Separate VC and PE Indices
• Expected growth provides some investment opportunities 63
Threats
• Democracy is not yet fully established and the possibility of a 64
military putsch is omnipresent
Index Rank
• Political parties are discredited
65
Outlook
• With the stabilization of democratic power, Paraguay’s prospects
should comprehensively improve 66
67
2005/06 2006/07 2007/08 2008/09 2009/10
VC PE VCPE
Comparison within Peer Group
2005/06 2009/10 Quartile
Rank Value Rank 4th 1st
Chile 27 45,8 32
Mexico 51 35,8 49
Brazil 56 34,6 51
Uruguay 50 33,4 52
Peru 54 32,4 53
Colombia 55 29,4 58
Argentina 59 29,1 59
Paraguay 66 14,9 65
Venezuela 65 8,9 66
150 The Global Venture Capital and Private Equity Country Attractiveness Index - 2009/2010 annual](https://image.slidesharecdn.com/iesevcpeindexannual2009-110326195513-phpapp02/85/Iese-vcpe-index_annual_2009-149-320.jpg)
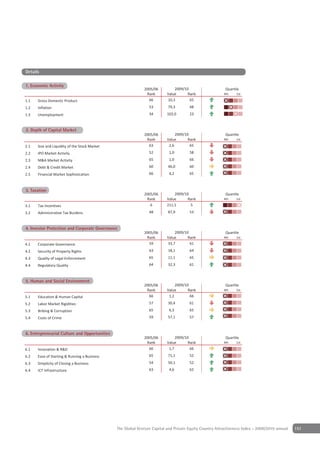
![Regional and country profiles
Peru
Capital: Lima ++ Official Language: Spanish, Quéchua (both official) ++ Currency: Nuevo Sol
Basic Facts VCPE-Ranking
2005/06 2009/10 Quartile
Rank Value Rank 4th 1st
VCPE Ranking 54 32,4 53
Economic Activity 40 71,1 45
Depth of Cap. Market 50 8,6 48
Taxation 36 122,6 22
Inv. Prot. & Corp. Gov. 57 48,9 51
Hum. & Soc. Env. 61 42,4 55
Quartile
4th 1st
Entrepr. Culture & Opp. 54 24,3 54
GDP 128 [bn USD] IPO Volume
Population 28 [mn] M&A Volume
GDP Growth '02 '08 VC Activity
Pop. Growth '02 '08 PE Activity Key Factors Performance
Economic
Activity
125
SWOT Analysis 100
Entrepr. Culture 75 Depth of Cap.
& Opp. 50
Market
Strengths
25
• High-quality accounting standards
0
• Country openness
• Relatively advanced regulations for VC/PE
Hum. & Soc.
Taxation
Weaknesses Environment
• Democratic institutions inspire little public trust Peru
• Judicial system remains little efficient and prone to corruption Inv. Prot. & Latin America
• Minority rights are weakly regulated and protected Corp. Gov.
United States = 100 Points
• IPO market is non-existing
Opportunities Separate VC and PE Indices
• Pension funds are increasingly local active players 49
• Over the longer term, bureaucracy may be gradually reduced,
making the business environment more conducive to 50
entrepreneurship 51
Index Rank
Threats 52
• The IIPA asked that Peru be elevated to the US Trade
53
Representative’s Special 301 priority watch list
• Local culture about VC/PE needs to be developed 54
• Unfavorable tax laws and inadequate tax incentives 55
Outlook 56
• Peru is considered an incipient new market for PE/VC investment 2005/06 2006/07 2007/08 2008/09 2009/10
• Government support for the formation of a PE/VC industry VC PE VCPE
remains tepid
Comparison within Peer Group
2005/06 2009/10 Quartile
Rank Value Rank 4th 1st
Chile 27 45,8 32
Mexico 51 35,8 49
Brazil 56 34,6 51
Uruguay 50 33,4 52
Peru 54 32,4 53
Colombia 55 29,4 58
Argentina 59 29,1 59
Paraguay 66 14,9 65
Venezuela 65 8,9 66
152 The Global Venture Capital and Private Equity Country Attractiveness Index - 2009/2010 annual](https://image.slidesharecdn.com/iesevcpeindexannual2009-110326195513-phpapp02/85/Iese-vcpe-index_annual_2009-151-320.jpg)
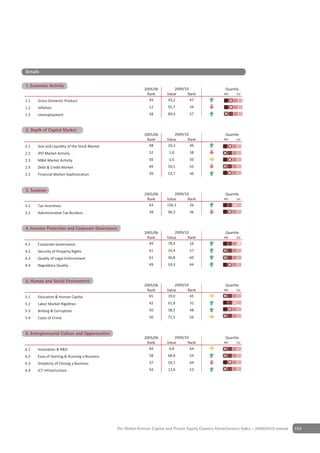
![Regional and country profiles
Philippines
Capital: Manila ++ O cial Language: Filipino, English ++ Currency: Philippine Peso
Basic Facts VCPE-Ranking
2005/06 2009/10 Quar le
Rank Value Rank 4th 1st
VCPE Ranking 57 26,1 61
Econom c Ac t 59 60,8 56
Depth of Cap. Market 41 9,9 43
Taxa on 49 96,8 59
In . Prot. & Corp. Go . 58 38,4 60
Hum. & Soc. En . 53 38,9 58
4th
Quar le
1st
Entrepr. Culture & Opp. 62 11,0 65
GDP 170 [bn USD] IPO Volume
Popula on 90 [mn] M&A Volume
GDP Growth '02 '08 VC Ac t
Pop. Growth '02 '08 PE Ac t Key Factors Performance
Econom c
Ac t
125
100
SWOT Analysis
Entrepr. Culture 75 Depth of Cap.
& Opp. 50
Market
Strengths
25
• Relatively large, young and growing middle-income population in
0
emerging urban centers
• Competent professionals and affordable workforce
• Robust remittances from over 8 million overseas Filipinos drive Hum. & Soc.
Taxa on
En ronment
consumer spending and economic activities
Ph l pp nes
Weaknesses
In . Prot. & As a
• Inadequate power and transport infrastructure in selected areas Corp. Go .
United States = 100 Points
• Persistent politicking in the National Capital Region and persistent
terrorist activities in surrounding provinces
Separate VC and PE Indices
• Budget deficits restrain government from undertaking programs
to improve infrastructure 53
54
Opportunities 55
• Increasing off-shoring and outsourcing activities in the US and 56
other industrial economies provide investment opportunities
Index Rank
57
• As signatory of China-ASEAN FTA, country is part of the world’s 58
most dynamic emerging regional market and investment 59
destination 60
61
Threats
62
• Politicking and terrorism concerns may disrupt business and
63
economic activities
2005/06 2006/07 2007/08 2008/09 2009/10
• Failure to improve infrastructure and lower cost of doing business
VC PE VCPE
may discourage prospective investors
Outlook Comparison within Peer Group
• Moderate growth may continue with large and young growing
2005/06 2009/10 Quar le
middle-income consumers
Rank Value Rank 4th 1st
• Growth opportunities may accelerate with improved
Hong Kong 4 79,5 5
infrastructure facilities
Japan 7 76,5 7
Renato Galve Ernst & Young Philippines Republ c of Korea 15 67,5 13
Mala s a 23 54,4 25
Ch na 42 48,5 28
In a 46 40,9 38
Russ an Federa on 49 38,0 48
Indones a 60 30,7 54
Ph l pp nes 57 26,1 61
154 The Global Venture Capital and Private Equity Country Attractiveness Index - 2009/2010 annual](https://image.slidesharecdn.com/iesevcpeindexannual2009-110326195513-phpapp02/85/Iese-vcpe-index_annual_2009-153-320.jpg)
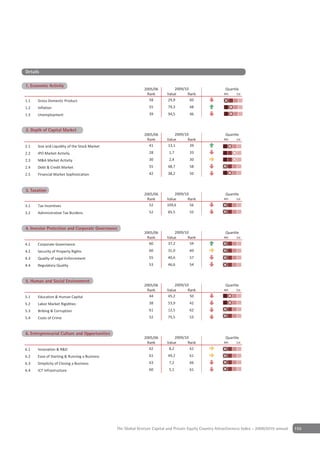
![Regional and country profiles
Poland
Capital: Warsaw ++ Official Language: Polish ++ Currency: Zloty
Basic Facts VCPE-Ranking
2005/06 2009/10 Quartile
Rank Value Rank 4th 1st
VCPE Ranking 41 45,8 31
Economic Activity 42 84,5 27
Depth of Cap. Market 42 13,5 32
Taxation 19 117,3 30
Inv. Prot. & Corp. Gov. 38 62,7 39
Hum. & Soc. Env. 44 71,2 34
Quartile
4th 1st
Entrepr. Culture & Opp. 38 39,3 35
GDP 530 [bn USD] IPO Volume
Population 38 [mn] M&A Volume
GDP Growth '02 '08 VC Activity
Pop. Growth '02 '08 PE Activity Key Factors Performance
Economic
Activity
125
SWOT Analysis 100
Entrepr. Culture 75 Depth of Cap.
& Opp. 50
Market
Strengths
25
• Many experienced GPs relative to the rest of the CEE region
0
• Decent expectation of vendors
• Stronger position of VC/PE
Hum. & Soc.
Taxation
Weaknesses Environment
• Limited bank financing Poland
• Market situation worsened due to inappropriate approaches of Inv. Prot. & Eastern Europe
selected VC/PE backed companies in pre-distressed situations Corp. Gov.
United States = 100 Points
Opportunities
• Expected economic growth Separate VC and PE Indices
• Exits through IPOs at Warsaw stock exchange 30
• Privatization provides some opportunities
32
• Better condition and transparent perception of the Polish
economy, caused by the limited involvement of the government 34
during the slowdown
Index Rank
36
Threats 38
• Financing investments with bank loans is unpredictable at this 40
stage
42
• Size of local companies limits number of large transactions
44
Outlook
• Euro zone in 2014/2015 2005/06 2006/07 2007/08 2008/09 2009/10
VC PE VCPE
Brendan O’Mahony, Partner, Ernst & Young Poland
Comparison within Peer Group
2005/06 2009/10 Quartile
Rank Value Rank 4th 1st
Poland 41 45,8 31
Czech Republic 33 45,5 34
Estonia 30 44,5 35
Hungary 34 41,1 37
Lithuania 37 40,4 40
Croatia 47 38,6 45
Romania 52 38,1 47
Latvia 39 35,6 50
Bulgaria 48 30,6 55
156 The Global Venture Capital and Private Equity Country Attractiveness Index - 2009/2010 annual](https://image.slidesharecdn.com/iesevcpeindexannual2009-110326195513-phpapp02/85/Iese-vcpe-index_annual_2009-155-320.jpg)
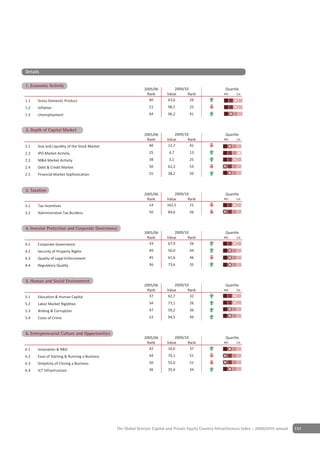
![Regional and country profiles
Portugal
Capital: Lisbon ++ Official Language: Portuguese ++ Currency: Euro
Basic Facts VCPE-Ranking
2005/06 2009/10 Quartile
Rank Value Rank 4th 1st
VCPE Ranking 28 49,5 27
Economic Activity 49 81,3 31
Depth of Cap. Market 34 13,2 33
Taxation 20 121,0 25
Inv. Prot. & Corp. Gov. 34 72,1 30
Hum. & Soc. Env. 29 73,0 32
Quartile
4th 1st
Entrepr. Culture & Opp. 28 52,8 28
GDP 243 [bn USD] IPO Volume
Population 11 [mn] M&A Volume
GDP Growth '02 '08 VC Activity
Pop. Growth '02 '08 PE Activity Key Factors Performance
Economic
Activity
125
SWOT Analysis 100
Entrepr. Culture 75 Depth of Cap.
& Opp. 50
Market
Strengths
25
• Very attractive tax conditions for business angels and VC/PE funds
0
Weaknesses
• Small number of business angels and early stage funds Hum. & Soc.
Taxation
• Low IRR of existing funds Environment
• Absence of Portuguese companies in the Alternext stock exchange Portugal
Opportunities Inv. Prot. & Western Europe
Corp. Gov.
• Need for consolidation in traditional industries with room for United States = 100 Points
build up buy outs
• Specialized funds: all existing funds are generalists Separate VC and PE Indices
• Clusters with good potential: energy, life sciences and leisure 25
Threats 26
• Government bonds yields very high (currently above 4.3%),
27
increasing opportunity cost of capital
Index Rank
• Small size of domestic market 28
• Low growth of Portuguese economy
29
Outlook 30
• Modest levels of fund raising and investment
• Increase of early stage and growth capital investments, partially 31
enhanced by state programs 32
• Buy outs penalized by difficult credit environment 2005/06 2006/07 2007/08 2008/09 2009/10
VC PE VCPE
José Gonzaga Rosa, Partner, Ernst & Young Portugal
Comparison within Peer Group
2005/06 2009/10 Quartile
Rank Value Rank 4th 1st
Germany 9 69,1 10
Denmark 10 67,7 12
Finland 12 65,9 15
France 17 65,2 16
Belgium 19 61,1 17
Austria 20 58,6 19
Ireland 16 58,3 21
Portugal 28 49,5 27
Greece 44 40,7 39
158 The Global Venture Capital and Private Equity Country Attractiveness Index - 2009/2010 annual](https://image.slidesharecdn.com/iesevcpeindexannual2009-110326195513-phpapp02/85/Iese-vcpe-index_annual_2009-157-320.jpg)
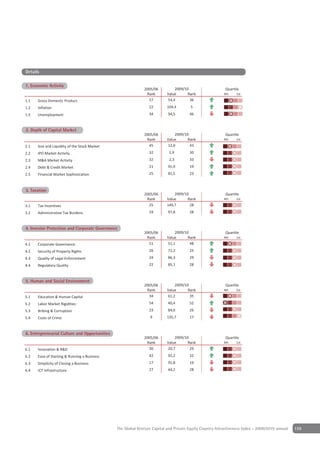
![Regional and country profiles
Republic of Korea
Capital: Seoul ++ Official Language: Korean ++ Currency: South Korean Won
Basic Facts VCPE-Ranking
2005/06 2009/10 Quartile
Rank Value Rank 4th 1st
VCPE Ranking 15 67,5 13
Economic Activity 20 87,7 23
Depth of Cap. Market 10 29,8 9
Taxation 14 134,6 13
Inv. Prot. & Corp. Gov. 20 75,7 26
Hum. & Soc. Env. 24 73,6 30
Quartile
4th 1st
Entrepr. Culture & Opp. 18 89,7 12
GDP 851 [bn USD] IPO Volume
Population 48 [mn] M&A Volume
GDP Growth '02 '08 VC Activity
Pop. Growth '02 '08 PE Activity Key Factors Performance
Economic
Activity
150
125
SWOT Analysis 100
Entrepr. Culture Depth of Cap.
& Opp. 75 Market
Strengths 50
• Dynamic and solid economy with positive GDP growth 25
0
• Top 10 export country in the world, with leading industries such
as electronics, semi-conductors, vessels, automobiles
• Increasing number of GPs with a rising influence in the M&A Hum. & Soc.
Taxation
Environment
market
Republic of Korea
Weaknesses Asia
Inv. Prot. &
• Recent volatility of foreign exchange rate Corp. Gov.
United States = 100 Points
• Lack of infrastructure for foreign investors compared to advanced
countries
Separate VC and PE Indices
Opportunities
6
• Corporate restructuring on a rise 7
• Leading technologies in mobile phones, internet network, display, 8
shipbuilding etc. in favor of VC/PE investments 9
• Changes to partner with large conglomerates in the value chain
Index Rank
10
Threats 11
• Dominance of large conglomerates (chaebol) in many key 12
industries, making it hard for new enterprises to grow 13
14
• Saturation of domestic market in traditional industries, resulting
15
in fierce competition
16
Outlook 2005/06 2006/07 2007/08 2008/09 2009/10
• M&A activities expected to rise as Korean economy rebounds and VC PE VCPE
corporations continue to restructure
• Strong competition is expected in certain sectors such as green Comparison within Peer Group
energy and high technology areas, as large companies have
2005/06 2009/10 Quartile
significant cash and look for profit sources
Rank Value Rank 4th 1st
Hong Kong 4 79,5 5
Ki Whan Jung, Partner, Ernst & Young Korea
Japan 7 76,5 7
Republic of Korea 15 67,5 13
Malaysia 23 54,4 25
China 42 48,5 28
India 46 40,9 38
Russian Federation 49 38,0 48
Indonesia 60 30,7 54
Philippines 57 26,1 61
160 The Global Venture Capital and Private Equity Country Attractiveness Index - 2009/2010 annual](https://image.slidesharecdn.com/iesevcpeindexannual2009-110326195513-phpapp02/85/Iese-vcpe-index_annual_2009-159-320.jpg)

![Regional and country profiles
Romania
Capital: Bucharest ++ Official Language: Romanian ++ Currency: Leu
Basic Facts VCPE-Ranking
2005/06 2009/10 Quartile
Rank Value Rank 4th 1st
VCPE Ranking 52 38,1 47
Economic Activity 55 76,8 39
Depth of Cap. Market 46 8,8 47
Taxation 65 95,8 60
Inv. Prot. & Corp. Gov. 44 58,7 41
Hum. & Soc. Env. 55 60,1 44
Quartile
4th 1st
Entrepr. Culture & Opp. 47 36,6 40
GDP 193 [bn USD] IPO Volume
Population 21 [mn] M&A Volume
GDP Growth '02 '08 VC Activity
Pop. Growth '02 '08 PE Activity Key Factors Performance
Economic
Activity
125
SWOT Analysis 100
Entrepr. Culture 75 Depth of Cap.
& Opp. 50
Market
Strengths
25
• 5.8% expected annual economic growth during 2014 to 2018,
0
above Euro-zone average (BMI)
Weaknesses Hum. & Soc.
Taxation
• Longer payback periods Environment
• Relative expensive financing Romania
• Pricing gap between buyers and sellers due to a few opportunistic Inv. Prot. & Eastern Europe
deals in the past Corp. Gov.
United States = 100 Points
Opportunities
• Sizeable market with important domestic demand and uncovered Separate VC and PE Indices
needs in the following sectors: infrastructure, housing, green
40
energy and healthcare 42
• Still unconsolidated sectors, such as agro-food, logistics and IT 44
Threats 46
Index Rank
• Poor infrastructure 48
• Wages tend towards Western EU levels 50
52
Outlook 54
• Distressed assets, debt transactions and turnaround opportunities 56
likely to rise 58
• Key success factors for closing Romanian deals: local presence or 60
connections, focus, determination and patience to complete deals 2005/06 2006/07 2007/08 2008/09 2009/10
on a longer timeframe than expected VC PE VCPE
Cornelia Bumbacea, Partner, Ernst & Young Romania Comparison within Peer Group
2005/06 2009/10 Quartile
Rank Value Rank 4th 1st
Poland 41 45,8 31
Czech Republic 33 45,5 34
Estonia 30 44,5 35
Hungary 34 41,1 37
Lithuania 37 40,4 40
Croatia 47 38,6 45
Romania 52 38,1 47
Latvia 39 35,6 50
Bulgaria 48 30,6 55
162 The Global Venture Capital and Private Equity Country Attractiveness Index - 2009/2010 annual](https://image.slidesharecdn.com/iesevcpeindexannual2009-110326195513-phpapp02/85/Iese-vcpe-index_annual_2009-161-320.jpg)
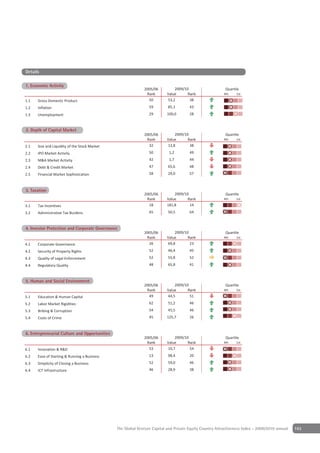
![Regional and country profiles
Russian Federation
Capital: Moscow ++ Official Language: Russian ++ Currency: Russian Ruble
Basic Facts VCPE-Ranking
2005/06 2009/10 Quartile
Rank Value Rank 4th 1st
VCPE Ranking 49 38,0 48
Economic Activity 57 75,0 40
Depth of Cap. Market 38 16,9 23
Taxation 22 124,7 19
Inv. Prot. & Corp. Gov. 56 37,6 61
Hum. & Soc. Env. 51 42,6 54
Quartile
4th 1st
Entrepr. Culture & Opp. 45 31,4 47
GDP 1653 [bn USD] IPO Volume
Population 142 [mn] M&A Volume
GDP Growth '02 '08 VC Activity
Pop. Growth '02 '08 PE Activity Key Factors Performance
Economic
Activity
125
SWOT Analysis 100
Entrepr. Culture 75 Depth of Cap.
& Opp. 50
Market
Strengths
25
• Consumers continue to desire "Western style" goods
0
• Many global players see Russia as having stronger prospects in the
near- and mid-term than most developed markets
Hum. & Soc.
Taxation
Weaknesses Environment
• Confidence and transparency in corporate laws and weak local Russian Federation
accounting and auditing standards Asia
Inv. Prot. &
• The need to be "on the ground" creates challenges for foreign GPs Corp. Gov.
United States = 100 Points
• Weak infrastructure
Opportunities Separate VC and PE Indices
• Financial pressures placed on oligarchs and other business owners 44
may bring unexpected deal flow
45
Threats 46
• A "second wave" of the financial crisis could severely damage
47
Index Rank
Russian’s economy, and government's reserves will likely not be
sufficient to intervene as heavily as in fall 2008 48
• Increasing proportion of economy becoming state controlled 49
Outlook 50
• The more challenging economic environment will make it easier 51
to distinguish strong performers from those who have "risen 52
with the tide", and limits the number of local players who have 2005/06 2006/07 2007/08 2008/09 2009/10
traditionally used connections and speed to their advantage, VC PE VCPE
thereby presenting interesting opportunities
Comparison within Peer Group
Doug Jenkinson, Partner, Ernst & Young Russia
2005/06 2009/10 Quartile
Rank Value Rank 4th 1st
Hong Kong 4 79,5 5
Japan 7 76,5 7
Republic of Korea 15 67,5 13
Malaysia 23 54,4 25
China 42 48,5 28
India 46 40,9 38
Russian Federation 49 38,0 48
Indonesia 60 30,7 54
Philippines 57 26,1 61
164 The Global Venture Capital and Private Equity Country Attractiveness Index - 2009/2010 annual](https://image.slidesharecdn.com/iesevcpeindexannual2009-110326195513-phpapp02/85/Iese-vcpe-index_annual_2009-163-320.jpg)
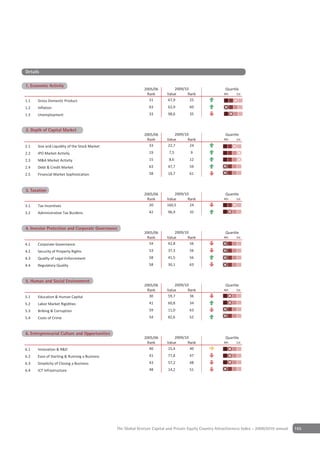
![Regional and country profiles
Saudi Arabia
Capital: Riyadh ++ Official Language: Arabic ++ Currency: Saudi Riyal
Basic Facts VCPE-Ranking
2005/06 2009/10 Quartile
Rank Value Rank 4th 1st
VCPE Ranking 36 46,4 30
Economic Activity 16 79,1 36
Depth of Cap. Market 35 13,9 30
Taxation 2 160,9 1
Inv. Prot. & Corp. Gov. 40 63,5 37
Hum. & Soc. Env. 33 70,4 35
Quartile
4th 1st
Entrepr. Culture & Opp. 55 36,2 41
GDP 468 [bn USD] IPO Volume
Population 25 [mn] M&A Volume
GDP Growth '02 '08 VC Activity
Pop. Growth '02 '08 PE Activity Key Factors Performance
Economic
Activity
175
150
SWOT Analysis 125
Entrepr. Culture 100 Depth of Cap.
& Opp. 75 Market
Strengths 50
• Robust economic growth and government's focus to keep KSA 25
0
on the growth path is expected to result in favorable investment
climate
• Large population base and related "real demand" key business Hum. & Soc.
Taxation
Environment
drivers
Saudi Arabia
Weaknesses Middle East
Inv. Prot. &
• Overhang of family businesses with weak corporate governance Corp. Gov.
United States = 100 Points
framework
• Underdeveloped legal framework to support VC/PE activity
Separate VC and PE Indices
Opportunities
25
• Availability of attractive businesses which may consider
27
transitioning from family based to corporate structure
29
• Relatively larger size of businesses in Saudi makes it attractive
31
from a VC/PE ticket size perspective
Index Rank
33
Threats 35
• Limited appreciation of VC/PEs’ role and value added 37
• Most VC/PE activity is happening in the private/family space
39
• Managing expectations of existing shareholders/family members
41
is a key challenge
43
Outlook 2005/06 2006/07 2007/08 2008/09 2009/10
• Significant interest from regional and international GPs looking to VC PE VCPE
Saudi Arabia
• As more transactions take place, the sellers' market will mature Comparison within Peer Group
2005/06 2009/10 Quartile
Tanuj Paruthi, Director, Ernst & Young Saudi Arabia
Rank Value Rank 4th 1st
Israel 21 55,8 22
United Arab Emirates 26 51,7 26
Saudi Arabia 36 46,4 30
Kuwait 29 40,1 42
Oman 38 38,1 46
Morocco 58 30,3 56
Egypt 53 30,1 57
Nigeria 64 24,4 62
Kenya 63 19,3 64
166 The Global Venture Capital and Private Equity Country Attractiveness Index - 2009/2010 annual](https://image.slidesharecdn.com/iesevcpeindexannual2009-110326195513-phpapp02/85/Iese-vcpe-index_annual_2009-165-320.jpg)
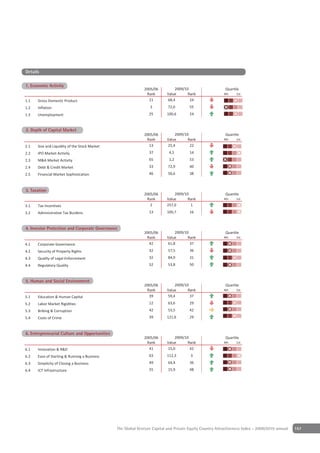
![Regional and country profiles
Singapore
Capital: Singapore ++ O cial Language: English, Malay,Chinese, Tamil ++ Currency: Singapore Dollar
Basic Facts VCPE-Ranking
2005/06 2009/10 Quar le
Rank Value Rank 4th 1st
VCPE Ranking 5 78,5 6
Econom c Ac 2 87,5 25
Depth of Cap. Market 11 26,0 13
Taxa on 7 141,7 6
In . Prot. & Corp. Go . 1 113,5 1
Hum. & Soc. En . 1 124,1 1
4th
Quar le
1st
Entrepr. Culture & Opp. 6 93,8 10
GDP 186 [bn USD] IPO Volume
Popul on 5 [mn] M&A Volume
GDP Growth '02 '08 VC
Pop. Growth '02 '08 PE Key Factors Performance
Econom c
Ac t
150
125
SWOT Analysis 100
Entrepr. Culture Depth of Cap.
& Opp. 75 Market
Strengths 50
• Corporate perceptions of VC/PE is positive 25
0
• Liberal financial environment conducive to optimizing innovative
financing structures, and access to a well developed capital
market Hum. & Soc.
Taxa on
En ronment
• Government’s active role through co-investment in new
enterprises, and favorable taxation for VC/PE funds S ngapore
In . Prot. & As a
Weaknesses Corp. Go .
United States = 100 Points
• Cultural challenges in achieving control of private enterprises
• Lack of new deal opportunities; tight control by the GLC of the
Separate VC and PE Indices
economic landscape limits the need for external capital
• Valuation gap continues 3
Opportunities
• Several fragmented industries with potential for consolidation 4
• Less chasing of deals compared to other markets in the region
Index Rank
• Deal size suitable for limited leverage environment 5
Threats
• Competition from the SWF and government-backed VCs 6
• Competition by hedge funds and other speculative players
Outlook 7
• Strong fundamentals for economic growth and a liberal, 2005/06 2006/07 2007/08 2008/09 2009/10
supportive government should support the growth of VC/PE VC PE VCPE
activity
• Increased liquidity and stabilization of financial markets in the Comparison within Peer Group
recent months should soon support a reemergence of VC/PE
2005/06 2009/10 Quar le
activity
Rank Value Rank 4th 1st
Hong Kong 4 79,5 5
Purandar Rao, Partner, Ernst & Young Singapore
S ngapore 5 78,5 6
Japan 7 76,5 7
Re c of Korea 15 67,5 13
Mala a 23 54,4 25
C a 42 48,5 28
I a 46 40,9 38
Indone a 60 30,7 54
P es 57 26,1 61
168 The Global Venture Capital and Private Equity Country Attractiveness Index - 2009/2010 annual](https://image.slidesharecdn.com/iesevcpeindexannual2009-110326195513-phpapp02/85/Iese-vcpe-index_annual_2009-167-320.jpg)
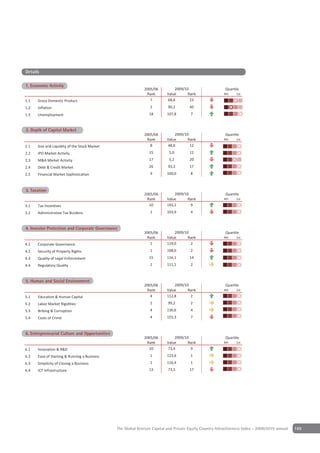
![Regional and country profiles
Slovakia
Capital: Bratislava ++ Official Language: Slovak ++ Currency: Euro
Basic Facts VCPE-Ranking
2005/06 2009/10 Quartile
Rank Value Rank 4th 1st
VCPE Ranking 40 40,3 41
Economic Activity 41 78,9 37
Depth of Cap. Market 52 7,4 56
Taxation 21 123,9 20
Inv. Prot. & Corp. Gov. 33 66,1 36
Hum. & Soc. Env. 38 67,6 37
Quartile
4th 1st
Entrepr. Culture & Opp. 34 41,8 34
GDP 91 [bn USD] IPO Volume
Population 5 [mn] M&A Volume
GDP Growth '02 '08 VC Activity
Pop. Growth '02 '08 PE Activity Key Factors Performance
Economic
Activity
125
SWOT Analysis 100
Entrepr. Culture 75 Depth of Cap.
& Opp. 50
Market
Strengths
25
• Skilled workforce represents the main determinant of FDI inflows
0
• Completed market reforms are judged positively from abroad
Weaknesses Hum. & Soc.
Taxation
• Cost-based competitiveness is no longer sufficient in many Environment
industries Slovakia
• Too much exposure to EU import demand Inv. Prot. & Eastern Europe
• Further pursuit of market reforms less of a priority for the current Corp. Gov.
United States = 100 Points
government
Opportunities Separate VC and PE Indices
• Growth prospects remain positive despite the current global 37
turmoil
• Structural reforms should gradually improve the health of public 38
finance and country prospects 39
• Accession to the Euro zone in 2009 should increase the appeal for
Index Rank
40
foreign investors
41
Threats
• Export-oriented economy with a significant exposure to 42
automotive 43
• Substantial dependency on Russia’s gas/oil supplies
44
• Euro zone entry means loss of exchange rate flexibility and poses
2005/06 2006/07 2007/08 2008/09 2009/10
a threat to price levels
VC PE VCPE
Outlook
• Challenging economic environment will facilitate distinguishing Comparison within Peer Group
strong performers and those who have "risen with the tide", and
2005/06 2009/10 Quartile
limits the number of local players who have traditionally used
Rank Value Rank 4th 1st
connections and speed to their advantage, thereby presenting
Poland 41 45,8 31
interesting opportunities.
Czech Republic 33 45,5 34
Vladislav Severa, Partner, Ernst & Young Czech and Slovakia Estonia 30 44,5 35
Hungary 34 41,1 37
Lithuania 37 40,4 40
Slovakia 40 40,3 41
Croatia 47 38,6 45
Latvia 39 35,6 50
Bulgaria 48 30,6 55
170 The Global Venture Capital and Private Equity Country Attractiveness Index - 2009/2010 annual](https://image.slidesharecdn.com/iesevcpeindexannual2009-110326195513-phpapp02/85/Iese-vcpe-index_annual_2009-169-320.jpg)
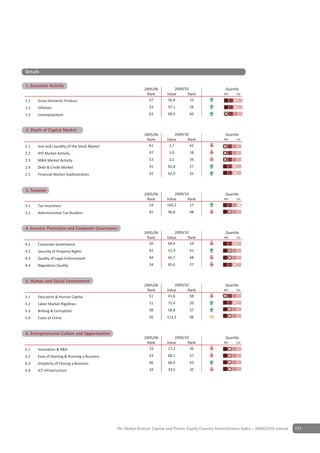
![Regional and country profiles
Slovenia
Capital: Ljubljana ++ Official Language: Slovene ++ Currency: Euro
Basic Facts VCPE-Ranking
2005/06 2009/10 Quartile
Rank Value Rank 4th 1st
VCPE Ranking 31 45,6 33
Economic Activity 31 80,2 33
Depth of Cap. Market 53 8,0 52
Taxation 23 121,8 24
Inv. Prot. & Corp. Gov. 30 69,7 33
Hum. & Soc. Env. 25 75,5 29
Quartile
4th 1st
Entrepr. Culture & Opp. 25 63,3 23
GDP 53 [bn USD] IPO Volume
Population 2 [mn] M&A Volume
GDP Growth '02 '08 VC Activity
Pop. Growth '02 '08 PE Activity Key Factors Performance
Economic
Activity
125
SWOT Analysis 100
Entrepr. Culture 75 Depth of Cap.
& Opp. 50
Market
Strengths
25
• One of the strongest economies in Central and Eastern Europe
0
• High demand for financing
Weaknesses Hum. & Soc.
Taxation
• Very limited number of local VC/PE funds and transactions in the Environment
past Slovenia
• Unfavorable tax and legal regulations for VC/PE investments Inv. Prot. & Eastern Europe
• Limited number of potential large investments Corp. Gov.
United States = 100 Points
Opportunities
• Generally underdeveloped VC/PE market provides room for new Separate VC and PE Indices
market entrants
25
• Increased demand for capital injections 27
• Potential for participation in the privatization of numerous state 29
owned/influenced companies 31
• Difficult to raise financing for local players
Index Rank
33
Threats 35
• Legal and business conditions are not supporting a dynamic SME 37
sector due to complicated licensing and registration processes and 39
41
investment barriers
43
• Lack of maturity in deal making, slow legal processing and
45
underdeveloped capital market
2005/06 2006/07 2007/08 2008/09 2009/10
Outlook VC PE VCPE
• Underdeveloped market with small number of transactions, lack
of regulatory framework, difficulties in accessing traditional bank Comparison within Peer Group
financing and the lack of experience in restructuring will demand
2005/06 2009/10 Quartile
for more VC/PE activities in Slovenia
Rank Value Rank 4th 1st
• Start-ups exhibiting a dedicated growth and global reach present
Poland 41 45,8 31
under-valued opportunities to GPs
Slovenia 31 45,6 33
Balazs Tuske, Partner, Ernst & Young Hungary Czech Republic 33 45,5 34
Estonia 30 44,5 35
Hungary 34 41,1 37
Lithuania 37 40,4 40
Croatia 47 38,6 45
Latvia 39 35,6 50
Bulgaria 48 30,6 55
172 The Global Venture Capital and Private Equity Country Attractiveness Index - 2009/2010 annual](https://image.slidesharecdn.com/iesevcpeindexannual2009-110326195513-phpapp02/85/Iese-vcpe-index_annual_2009-171-320.jpg)
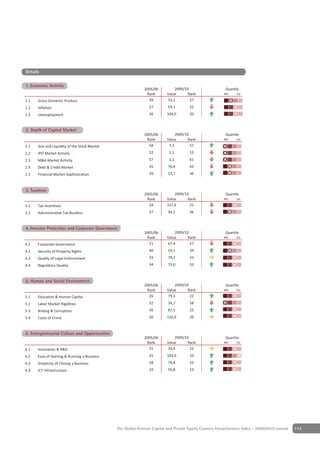
![Regional and country profiles
South Africa
Capital: Pretoria (exec.), Bloemfontein (judic.), Cape Town (legis.) ++ Official Language: Afrikaans, English and others ++
Currency: Rand
Basic Facts VCPE-Ranking
2005/06 2009/10 Quartile
Rank Value Rank 4th 1st
VCPE Ranking 43 39,5 43
Economic Activity 56 53,3 58
Depth of Cap. Market 23 18,0 20
Taxation 34 115,2 34
Inv. Prot. & Corp. Gov. 28 73,8 27
Hum. & Soc. Env. 63 34,3 63
Quartile
4th 1st
Entrepr. Culture & Opp. 46 30,3 48
GDP 283 [bn USD] IPO Volume
Population 49 [mn] M&A Volume
GDP Growth '02 '08 VC Activity
Pop. Growth '02 '08 PE Activity Key Factors Performance
Economic
Activity
125
SWOT Analysis 100
Entrepr. Culture 75 Depth of Cap.
& Opp. 50
Market
Strengths
25
• One of the most sophisticated VC/PE industries among emerging
0
markets
• Very positive with respect to investment and fund raising activity
• Expert transaction advisory services (tax, financial, legal, Hum. & Soc.
Taxation
Environment
commercial) locally available
South Africa
• SAVCA Association that maintains ethical and professional
standards Inv. Prot. & Africa
Corp. Gov.
United States = 100 Points
Weaknesses
• Local fund raising limited by caps of local pension funds
Separate VC and PE Indices
Opportunities
36
• Continent's largest and most diverse economy
• Limited competition from international VC/PE firms 38
• In principle, government's policies have and will continue to 40
encourage transaction activity
Index Rank
42
Threats
44
• Government perceived as being soft in wage negotiations
46
Outlook
• Recovery from recession in South Africa may lag global recovery 48
• VC/PE investment activity expected to increase again in 2010 50
2005/06 2006/07 2007/08 2008/09 2009/10
Graham Stokoe, Associate Director, Ernst & Young South Africa VC PE VCPE
Comparison within Peer Group
2005/06 2009/10 Quartile
Rank Value Rank 4th 1st
Israel 21 55,8 22
Saudi Arabia 36 46,4 30
Kuwait 29 40,1 42
South Africa 43 39,5 43
Oman 38 38,1 46
Morocco 58 30,3 56
Egypt 53 30,1 57
Nigeria 64 24,4 62
Kenya 63 19,3 64
174 The Global Venture Capital and Private Equity Country Attractiveness Index - 2009/2010 annual](https://image.slidesharecdn.com/iesevcpeindexannual2009-110326195513-phpapp02/85/Iese-vcpe-index_annual_2009-173-320.jpg)

![Regional and country profiles
Spain
Capital: Madrid ++ Official Language: Spanish ++ Currency: Euro
Basic Facts VCPE-Ranking
2005/06 2009/10 Quartile
Rank Value Rank 4th 1st
VCPE Ranking 22 58,3 20
Economic Activity 22 87,7 22
Depth of Cap. Market 14 26,6 12
Taxation 53 104,1 46
Inv. Prot. & Corp. Gov. 26 76,4 24
Hum. & Soc. Env. 32 66,5 38
Quartile
4th 1st
Entrepr. Culture & Opp. 23 57,6 26
GDP 1609 [bn USD] IPO Volume
Population 45 [mn] M&A Volume
GDP Growth '02 '08 VC Activity
Pop. Growth '02 '08 PE Activity Key Factors Performance
Economic
Activity
125
SWOT Analysis 100
Entrepr. Culture 75 Depth of Cap.
& Opp. 50
Market
Strengths
25
• Strong banking system, even during the credit crunch
0
• Strong PE sector in small and mid market due to the amount of
family owned companies
Hum. & Soc.
Taxation
Weaknesses Environment
• Relatively inflexible labor regulation restricts companies' ability to Spain
change headcount Western Europe
Inv. Prot. &
• Low work force mobility Corp. Gov.
United States = 100 Points
Opportunities
• Favorable access to fast growing Latin American markets through Separate VC and PE Indices
Spanish companies
12
• The boards of directors of many companies are not involved in the
strategy definition and decision-making process, leaving room for 14
VC/PEs to improve the quality of board members
16
• Improved exit conditions due to the launch of a new stock
Index Rank
exchange 18
Threats
20
• Current discussion about a more restrictive EU regulation on
investments 22
Outlook 24
• These challenges may create an attractive market for transactions 2005/06 2006/07 2007/08 2008/09 2009/10
in the future VC PE VCPE
Remigio Barroso, Partner, Ernst & Young Spain Comparison within Peer Group
2005/06 2009/10 Quartile
Rank Value Rank 4th 1st
Germany 9 69,1 10
Denmark 10 67,7 12
Finland 12 65,9 15
France 17 65,2 16
Belgium 19 61,1 17
Austria 20 58,6 19
Spain 22 58,3 20
Ireland 16 58,3 21
Greece 44 40,7 39
176 The Global Venture Capital and Private Equity Country Attractiveness Index - 2009/2010 annual](https://image.slidesharecdn.com/iesevcpeindexannual2009-110326195513-phpapp02/85/Iese-vcpe-index_annual_2009-175-320.jpg)
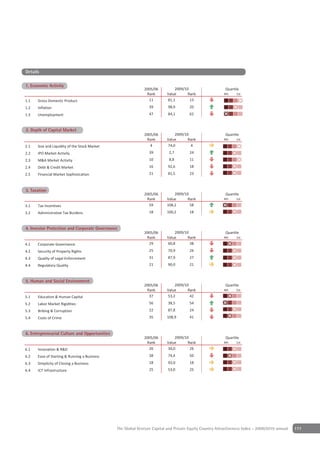
![Regional and country profiles
Sweden
Capital: Stockholm ++ Official Language: Swedish ++ Currency: Swedish Krona
Basic Facts VCPE-Ranking
2005/06 2009/10 Quartile
Rank Value Rank 4th 1st
VCPE Ranking 13 69,0 11
Economic Activity 10 91,6 15
Depth of Cap. Market 18 20,0 17
Taxation 31 113,7 38
Inv. Prot. & Corp. Gov. 18 96,1 12
Hum. & Soc. Env. 12 103,4 10
Quartile
4th 1st
Entrepr. Culture & Opp. 3 97,8 4
GDP 490 [bn USD] IPO Volume
Population 9 [mn] M&A Volume
GDP Growth '02 '08 VC Activity
Pop. Growth '02 '08 PE Activity Key Factors Performance
Economic
Activity
125
SWOT Analysis 100
Entrepr. Culture 75 Depth of Cap.
& Opp. 50
Market
Strengths
25
• Relatively long-established PE industry in Sweden
0
• Swedish companies tend to think globally from start up
Weaknesses Hum. & Soc.
Taxation
• Early stage financing less well established Environment
• Large public sector in Sweden can stifle entrepreneurship Sweden
Opportunities Inv. Prot. & Western Europe
Corp. Gov.
• Develop existing sectors where Sweden has a strong reputation United States = 100 Points
e.g., ICT, life sciences
• New sectors growing, such as cleantech Separate VC and PE Indices
Threats 8
• Shortage of leveraged financing for new investments 9
• Global economic downturn increases the risk of defaults among 10
VC/PE-backed companies
11
Index Rank
Outlook 12
• Sweden remains attractive to both local and overseas investors
13
David Ramm, Partner, Ernst & Young Sweden 14
15
16
2005/06 2006/07 2007/08 2008/09 2009/10
VC PE VCPE
Comparison within Peer Group
2005/06 2009/10 Quartile
Rank Value Rank 4th 1st
Germany 9 69,1 10
Sweden 13 69,0 11
Denmark 10 67,7 12
Finland 12 65,9 15
France 17 65,2 16
Belgium 19 61,1 17
Austria 20 58,6 19
Ireland 16 58,3 21
Greece 44 40,7 39
178 The Global Venture Capital and Private Equity Country Attractiveness Index - 2009/2010 annual](https://image.slidesharecdn.com/iesevcpeindexannual2009-110326195513-phpapp02/85/Iese-vcpe-index_annual_2009-177-320.jpg)

![Regional and country profiles
Switzerland
Capital: Bern ++ Official Language: German, French, Italian, Romansh ++ Currency: Swiss Franc
Basic Facts VCPE-Ranking
2005/06 2009/10 Quartile
Rank Value Rank 4th 1st
VCPE Ranking 8 76,3 8
Economic Activity 8 101,6 2
Depth of Cap. Market 13 28,3 11
Taxation 5 144,6 4
Inv. Prot. & Corp. Gov. 22 78,2 23
Hum. & Soc. Env. 4 119,0 3
Quartile
4th 1st
Entrepr. Culture & Opp. 4 96,5 5
GDP 491 [bn USD] IPO Volume
Population 8 [mn] M&A Volume
GDP Growth '02 '08 VC Activity
Pop. Growth '02 '08 PE Activity Key Factors Performance
Economic
Activity
150
125
SWOT Analysis 100
Entrepr. Culture Depth of Cap.
& Opp. 75 Market
Strengths 50
• Strong biotech, med-tech and pharmaceutical focus, in general: 25
0
innovative high-tech industries
• Research universities provide a flow of technology spin-offs
• Strong lobbying/support networks improve the VC/PE fiscal and Hum. & Soc.
Taxation
Environment
regulatory environment
Switzerland
• Plenty of business angels
• Liberal labor law Inv. Prot. & Western Europe
Corp. Gov.
• Excellent tax treaty network United States = 100 Points
Weaknesses
Separate VC and PE Indices
• Small market
• Average deals are small- or medium-sized and so below the radar 6
of major PE houses
7
Opportunities
8
• Presence of major multinationals leads to spin-off opportunities
Index Rank
• Large cash pools looking for opportunities 9
• Biotech opportunities resulting from depressed prices
10
Threats
• Increased regulation post financial crisis 11
• Fewer transactions as GPs focus on portfolio management
12
Outlook 2005/06 2006/07 2007/08 2008/09 2009/10
• Short-term outlook is still uncertain and will depend on the global VC PE VCPE
economy
• Expect to see a continuation of smaller and mid-size deals Comparison within Peer Group
resulting from forced divestments
2005/06 2009/10 Quartile
• Increasing focus on cleantech as a growth area
Rank Value Rank 4th 1st
Switzerland 8 76,3 8
Matthew Keson-Lee, Partner, Ernst & Young Switzerland
Germany 9 69,1 10
Denmark 10 67,7 12
Finland 12 65,9 15
France 17 65,2 16
Belgium 19 61,1 17
Austria 20 58,6 19
Ireland 16 58,3 21
Greece 44 40,7 39
180 The Global Venture Capital and Private Equity Country Attractiveness Index - 2009/2010 annual](https://image.slidesharecdn.com/iesevcpeindexannual2009-110326195513-phpapp02/85/Iese-vcpe-index_annual_2009-179-320.jpg)
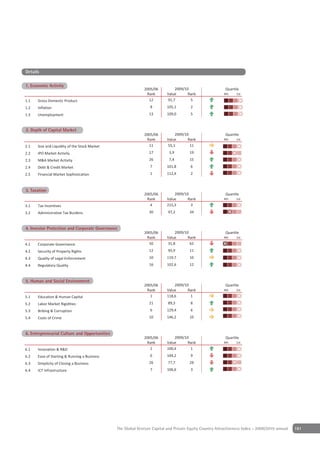
![Regional and country profiles
Taiwan
Capital: Taipei ++ O cial Language: Standard Mandarin ++ Currency: New Taiwan Dollar
Basic Facts VCPE-Ranking
2005/06 2009/10 Quar le
Rank Value Rank 4th 1st
VCPE Ranking 25 55,3 23
Econom c Ac t 21 82,2 30
Depth of Cap. Market 19 18,7 19
Taxa on 28 116,9 31
In . Prot. & Corp. Go . 37 75,8 25
Hum. & Soc. En . 28 73,2 31
4th
Quar le
1st
Entrepr. Culture & Opp. 26 59,9 24
GDP 406 [bn USD] IPO Volume
Popula on 23 [mn] M&A Volume
GDP Growth '02 '08 VC Ac t
Pop. Growth '02 '08 PE Ac t Key Factors Performance
Econom c
Ac t
125
100
SWOT Analysis
Entrepr. Culture 75 Depth of Cap.
& Opp. 50
Market
Strengths
25
• Strong global position in the manufacturing of semiconductors
0
and other high-tech products
• Abundance of well-educated workforce and skilled labors
• Robust infrastructure Hum. & Soc.
Taxa on
En ronment
Weaknesses
Ta wan
• As export-driven economy, Taiwan has suffered severely from the In . Prot. & As a
recession in the US and Europe Corp. Go .
United States = 100 Points
• Considerably high tax levels compared to regional peers
• Rising land and labor costs have forced manufacturers to move
Separate VC and PE Indices
plants to China or South East Asian countries
22
Opportunities
• Improved investment environment through normalization of the
cross-strait relationship with Mainland China 23
• Relaxation of restrictions on capital flows between Taiwan and
Index Rank
Mainland China 24
• Progressive tax reforms by the government with an aim to bolster
domestic demands and attract foreign investments
• Well-established ties to Silicon Valley and the global tech 25
investing community provide opportunities for Taiwanese VC/PE
to replicate successful business models 26
2005/06 2006/07 2007/08 2008/09 2009/10
Threats
VC PE VCPE
• Taiwan’s trade growth is increasingly dependent upon China
• If the current thawing of relations with Mainland China is
reversed, this has a negative impact on Taiwan’s growth Comparison within Peer Group
2005/06 2009/10 Quar le
Outlook
Rank Value Rank 4th 1st
• Continuing strong global position in high-tech sector
Hong Kong 4 79,5 5
• Continuing relaxation of restrictions of capital flows between
Taiwan and Mainland China would attract overseas Taiwanese Japan 7 76,5 7
enterprises to return to Taiwan to being listed Republ c of Korea 15 67,5 13
Ta wan 25 55,3 23
Audry Ho, Director, Ernst & Young Taiwan Mala s a 23 54,4 25
Ch na 42 48,5 28
In a 46 40,9 38
Indones a 60 30,7 54
Ph l pp nes 57 26,1 61
182 The Global Venture Capital and Private Equity Country Attractiveness Index - 2009/2010 annual](https://image.slidesharecdn.com/iesevcpeindexannual2009-110326195513-phpapp02/85/Iese-vcpe-index_annual_2009-181-320.jpg)
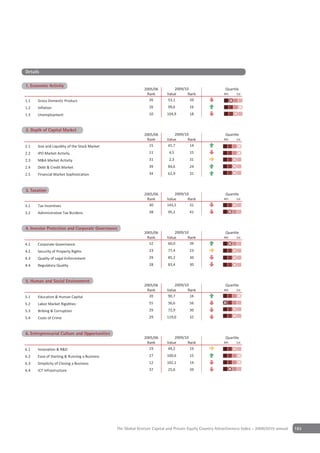
![Regional and country profiles
Thailand
Capital: Bangkok ++ Official Language: Thai ++ Currency: Baht
Basic Facts VCPE-Ranking
2005/06 2009/10 Quartile
Rank Value Rank 4th 1st
VCPE Ranking 35 41,4 36
Economic Activity 38 73,4 43
Depth of Cap. Market 21 15,6 25
Taxation 42 106,4 42
Inv. Prot. & Corp. Gov. 41 58,1 42
Hum. & Soc. Env. 36 62,8 41
Quartile
4th 1st
Entrepr. Culture & Opp. 53 26,6 52
GDP 277 [bn USD] IPO Volume
Population 64 [mn] M&A Volume
GDP Growth '02 '08 VC Activity
Pop. Growth '02 '08 PE Activity Key Factors Performance
Economic
Activity
125
SWOT Analysis 100
Entrepr. Culture 75 Depth of Cap.
& Opp. 50
Market
Strengths
25
• Well performing economy, despite the political uncertainty
0
• Substantial decrease in country’s vulnerability to capital outflows
• A "moderately free" economy
Hum. & Soc.
Taxation
Weaknesses Environment
• Dependence on exports and tourism Thailand
• Small size of the skilled workforce Inv. Prot. & Asia
• Poor protection of intellectual property Corp. Gov.
United States = 100 Points
• Domestic political woes
• Lack of investment incentives
Separate VC and PE Indices
Opportunities
30
• Government policy emphasizing on large scale infrastructure 31
projects and economic relief for rural communities 32
• Forceful effort to protect intellectual property rights 33
Index Rank
Threats 34
• Continued political turmoil risks damaging attractiveness to 35
foreign investors 36
• Unstable prices of key export commodities causing burdensome 37
38
subsidies to the government
39
• Dependence on exporting products to China
40
• Controversial privatization program of state-owned companies
2005/06 2006/07 2007/08 2008/09 2009/10
• Negative corruption perception
VC PE VCPE
Outlook
• Thailand has current account surpluses and the accumulation of a Comparison within Peer Group
sizeable foreign exchange reserve buffer
2005/06 2009/10 Quartile
• Political concerns over a deep divide between the rural poor
Rank Value Rank 4th 1st
population and the urban middle class/royalist elite, and
Hong Kong 4 79,5 5
separatism and terrorism in the South
Japan 7 76,5 7
Vorapoj Amnauypanit, Partner, Ernst & Young Thailand Republic of Korea 15 67,5 13
Malaysia 23 54,4 25
China 42 48,5 28
Thailand 35 41,4 36
India 46 40,9 38
Indonesia 60 30,7 54
Philippines 57 26,1 61
184 The Global Venture Capital and Private Equity Country Attractiveness Index - 2009/2010 annual](https://image.slidesharecdn.com/iesevcpeindexannual2009-110326195513-phpapp02/85/Iese-vcpe-index_annual_2009-183-320.jpg)
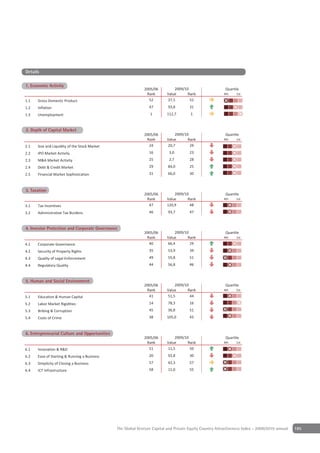
![Regional and country profiles
Turkey
Capital: Ankara ++ Official Language: Turkish ++ Currency: Turkish Lira
Basic Facts VCPE-Ranking
2005/06 2009/10 Quartile
Rank Value Rank 4th 1st
VCPE Ranking 45 39,1 44
Economic Activity 37 69,5 47
Depth of Cap. Market 33 12,5 36
Taxation 30 125,8 18
Inv. Prot. & Corp. Gov. 49 49,1 50
Hum. & Soc. Env. 45 54,3 46
Quartile
4th 1st
Entrepr. Culture & Opp. 44 33,9 44
GDP 808 [bn USD] IPO Volume
Population 76 [mn] M&A Volume
GDP Growth '02 '08 VC Activity
Pop. Growth '02 '08 PE Activity Key Factors Performance
Economic
Activity
150
125
SWOT Analysis 100
Entrepr. Culture Depth of Cap.
& Opp. 75 Market
Strengths 50
• Large economy with substantial young population and highly 25
0
skilled workforce
• High and sustainable growth potential along the economy with
increasing efficiency Hum. & Soc.
Taxation
Environment
• Local banking system healthy and liquid
Turkey
• Entrepreneurial skills highly developed
• High quality management despite being an emerging market Inv. Prot. & Eastern Europe
Corp. Gov.
United States = 100 Points
Weaknesses
• Low level of institutionalization where majority of the businesses
Separate VC and PE Indices
are family owned
• Legal and regulatory framework still converging to EU system 41
• Lack of robustness in financial statements and non compliance 42
with international standards for certain family owned businesses
43
Opportunities
Index Rank
44
• Positive outlook for nearly all industries, especially in consumer
related sectors 45
• Increasing understanding and acceptance of VC/PE 46
Threats 47
• Low protection of intellectual property rights
48
• Highly volatile market
2005/06 2006/07 2007/08 2008/09 2009/10
Outlook VC PE VCPE
• High potential growth market
Comparison within Peer Group
Musfik Cantekinler, Partner, Ernst & Young Turkey
2005/06 2009/10 Quartile
Rank Value Rank 4th 1st
Poland 41 45,8 31
Czech Republic 33 45,5 34
Estonia 30 44,5 35
Hungary 34 41,1 37
Lithuania 37 40,4 40
Turkey 45 39,1 44
Croatia 47 38,6 45
Latvia 39 35,6 50
Bulgaria 48 30,6 55
186 The Global Venture Capital and Private Equity Country Attractiveness Index - 2009/2010 annual](https://image.slidesharecdn.com/iesevcpeindexannual2009-110326195513-phpapp02/85/Iese-vcpe-index_annual_2009-185-320.jpg)

![Regional and country profiles
Ukraine
Capital: Kyiv ++ Official Language: Ukrainian ++ Currency: Hryvnia
Basic Facts VCPE-Ranking
2005/06 2009/10 Quartile
Rank Value Rank 4th 1st
VCPE Ranking 61 23,6 63
Economic Activity 63 42,1 63
Depth of Cap. Market 61 6,1 61
Taxation 63 35,8 66
Inv. Prot. & Corp. Gov. 54 41,2 56
Hum. & Soc. Env. 47 51,6 48
Quartile
4th 1st
Entrepr. Culture & Opp. 59 17,7 59
GDP 185 [bn USD] IPO Volume
Population 46 [mn] M&A Volume
GDP Growth '02 '08 VC Activity
Pop. Growth '02 '08 PE Activity Key Factors Performance
Economic
Activity
125
SWOT Analysis 100
Entrepr. Culture 75 Depth of Cap.
& Opp. 50
Market
Strengths
25
• Strong economic growth increased business opportunities in
0
many sectors
• Extension of a US$16.4bn emergency Stand-By Agreement from
the IMF significantly reduced the likelihood of a sovereign credit Hum. & Soc.
Taxation
Environment
default
Ukraine
• Decrease of inflation rate is expected in 2009 compared to 2008
Inv. Prot. & World
Weaknesses Corp. Gov.
United States = 100 Points
• Corruption remains a serious problem
• Ukraine's economy is poised for a significant slowdown due to
Separate VC and PE Indices
continuing deterioration in external credit conditions and the
ongoing low demand throughout Europe 57
• Absence of developed stock markets 58
• Production facilities are outdated and require significant capex
59
Opportunities
Index Rank
60
• Prospects of a more formal trade arrangement with the EU
• Financial pressure placed on business owners together with local 61
currency depreciation may lead to unexpected deal flow 62
• Liquidity problems of Ukrainian firms might lead to low valuations
• Low labor costs 63
• Euro-2012 championship hosted by Ukraine and Poland 64
2005/06 2006/07 2007/08 2008/09 2009/10
Threats
VC PE VCPE
• Economic policy is likely to remain politically motivated as
parliamentary fractions continue to compete for control and
influence. The unstable political situation will continue to hamper Comparison within Peer Group
the government's ability to respond to persistent macroeconomic 2005/06 2009/10 Quartile
challenges Rank Value Rank 4th 1st
• Economy highly depends on prices of natural gas imported from Poland 41 45,8 31
Russia Czech Republic 33 45,5 34
• Transparency, such as in the conduct of privatizations, will remain
Estonia 30 44,5 35
elusive
Hungary 34 41,1 37
Aaron Johnson, Partner, Ernst & Young Ukraine Lithuania 37 40,4 40
Croatia 47 38,6 45
Latvia 39 35,6 50
Bulgaria 48 30,6 55
Ukraine 61 23,6 63
188 The Global Venture Capital and Private Equity Country Attractiveness Index - 2009/2010 annual](https://image.slidesharecdn.com/iesevcpeindexannual2009-110326195513-phpapp02/85/Iese-vcpe-index_annual_2009-187-320.jpg)

![Regional and country profiles
United Arab Emirates
Capital: Abu Dhabi ++ Official Language: Arabic ++ Currency: UAE Dirham
Basic Facts VCPE-Ranking
2005/06 2009/10 Quartile
Rank Value Rank 4th 1st
VCPE Ranking 26 51,7 26
Economic Activity 11 88,8 20
Depth of Cap. Market 30 17,3 22
Taxation 1 145,5 3
Inv. Prot. & Corp. Gov. 39 63,3 38
Hum. & Soc. Env. 20 92,2 17
Quartile
4th 1st
Entrepr. Culture & Opp. 40 36,8 38
GDP 234 [bn USD] IPO Volume
Population 5 [mn] M&A Volume
GDP Growth '02 '08 VC Activity
Pop. Growth '02 '08 PE Activity Key Factors Performance
Economic
Activity
150
125
SWOT Analysis 100
Entrepr. Culture Depth of Cap.
& Opp. 75 Market
Strengths 50
• Expected GDP growth and increasing population expected to 25
0
sustain investment opportunities
Weaknesses Hum. & Soc.
Taxation
• Large amounts of businesses are owned by government or private Environment
family houses which are not willing to sell United Arab
Emirates
• Existing portfolio companies may face challenging market Inv. Prot. &
Middle East
conditions Corp. Gov.
United States = 100 Points
• Weak corporate governance
Opportunities Separate VC and PE Indices
• Availability of assets at attractive valuations 23
Threats 24
• Size and liquidity of stock markets may affect exits
25
• Lack of liquidity impacts setting up new funds
Index Rank
26
Outlook
• Given a significant accumulation of dry powder and reduced 27
valuation expectations, we could see increased VC/PE activity 28
• Availability of assets at attractive valuation
29
Andrew Brierly, Director, Ernst & Young United Arab Emirates 30
2005/06 2006/07 2007/08 2008/09 2009/10
VC PE VCPE
Comparison within Peer Group
2005/06 2009/10 Quartile
Rank Value Rank 4th 1st
Israel 21 55,8 22
United Arab Emirates 26 51,7 26
Saudi Arabia 36 46,4 30
Kuwait 29 40,1 42
Oman 38 38,1 46
Morocco 58 30,3 56
Egypt 53 30,1 57
Nigeria 64 24,4 62
Kenya 63 19,3 64
190 The Global Venture Capital and Private Equity Country Attractiveness Index - 2009/2010 annual](https://image.slidesharecdn.com/iesevcpeindexannual2009-110326195513-phpapp02/85/Iese-vcpe-index_annual_2009-189-320.jpg)

![Regional and country profiles
United Kingdom
Capital: London ++ Official Language: English ++ Currency: Pound Sterling
Basic Facts VCPE-Ranking
2005/06 2009/10 Quartile
Rank Value Rank 4th 1st
VCPE Ranking 3 84,3 3
Economic Activity 12 95,8 9
Depth of Cap. Market 2 49,9 2
Taxation 29 115,7 33
Inv. Prot. & Corp. Gov. 6 101,6 6
Hum. & Soc. Env. 15 97,9 14
Quartile
4th 1st
Entrepr. Culture & Opp. 10 90,0 11
GDP 2674 [bn USD] IPO Volume
Population 61 [mn] M&A Volume
GDP Growth '02 '08 VC Activity
Pop. Growth '02 '08 PE Activity Key Factors Performance
Economic
Activity
125
SWOT Analysis 100
Entrepr. Culture 75 Depth of Cap.
& Opp. 50
Market
Strengths
25
• Established key global VC/PE and financial centre
0
• Large numbers of assets currently under VC/PE ownership
• Asset class is recognized as a key element of the investment
landscape Hum. & Soc.
Taxation
Environment
Weaknesses United Kingdom
• Lack of leverage has stifled deal activity Inv. Prot. & Western Europe
• Existing portfolio facing challenging market conditions Corp. Gov.
United States = 100 Points
• Continuing significant economic uncertainty
Opportunities Separate VC and PE Indices
• Many unique investment opportunities at attractive valuations 0
• Pent up flow of exits due to transactions lull
• IPOs expected to be an increasingly common exit route 1
Threats
Index Rank
• Potential increasing regulatory burden placed upon Houses 2
• Re-financing challenges for investees over the next two years
• Fund raising difficulties due to liquidity issues and LPs becoming 3
more selective
4
Outlook
• Numerous assets exiting and therefore many opportunities for 5
selective acquisitions will exist. Deals are likely to be smaller as the 2005/06 2006/07 2007/08 2008/09 2009/10
case for leverage becomes tougher. Fund raising expected to be VC PE VCPE
much harder, with a “flight to quality” by investors
Comparison within Peer Group
Steve Ivermee, Partner, Ernst & Young United Kingdom
2005/06 2009/10 Quartile
Rank Value Rank 4th 1st
United Kingdom 3 84,3 3
Germany 9 69,1 10
Denmark 10 67,7 12
Finland 12 65,9 15
France 17 65,2 16
Belgium 19 61,1 17
Austria 20 58,6 19
Ireland 16 58,3 21
Greece 44 40,7 39
192 The Global Venture Capital and Private Equity Country Attractiveness Index - 2009/2010 annual](https://image.slidesharecdn.com/iesevcpeindexannual2009-110326195513-phpapp02/85/Iese-vcpe-index_annual_2009-191-320.jpg)
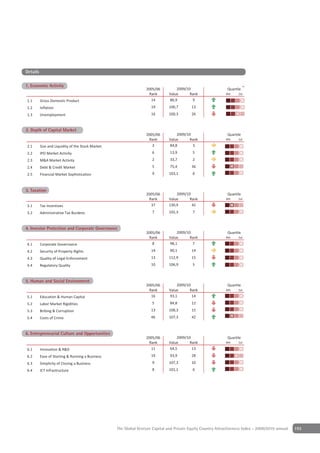
![Regional and country profiles
United States of America
Capital: Washington D.C. ++ Official Language: English ++ Currency: US Dollar
Basic Facts VCPE-Ranking
2005/06 2009/10 Quartile
Rank Value Rank 4th 1st
VCPE Ranking 1 100,0 1
Economic Activity 7 100,0 4
Depth of Cap. Market 1 100,0 1
Taxation 47 100,0 53
Inv. Prot. & Corp. Gov. 8 100,0 10
Hum. & Soc. Env. 14 100,0 12
Quartile
4th 1st
Entrepr. Culture & Opp. 1 100,0 3
GDP 14493 [bn USD] IPO Volume
Population 309 [mn] M&A Volume
GDP Growth '02 '08 VC Activity
Pop. Growth '02 '08 PE Activity Key Factors Performance
Economic
Activity
125
SWOT Analysis 100
Entrepr. Culture 75 Depth of Cap.
& Opp. 50
Market
Strengths
25
• Strong innovation and entrepreneurship culture
0
• Fully developed and robust “VC/PE eco-system”
Weaknesses Hum. & Soc.
Taxation
• Lack of VC/PE-backed exits, both IPOs and M&A Environment
• Limited partners face challenges United States
Opportunities Inv. Prot. & North America
Corp. Gov.
• New innovation and fast growth segments such as cleantech, United States = 100 Points
cloud computing, wireless and security
• Collaboration with China Separate VC and PE Indices
Threats 0
• Succession planning in some funds
• Impact of lack of exits on the ability to raise new or follow on
funds
Index Rank
Outlook 1
• Strong industry with new investment and growth opportunities
• The number of players will continue to shrink: less funds will be
able to raise follow-on funds
Gil Forer, Global Cleantech Leader, Ernst & Young 2
2005/06 2006/07 2007/08 2008/09 2009/10
VC PE VCPE
Comparison within Peer Group
2005/06 2009/10 Quartile
Rank Value Rank 4th 1st
United States 1 100,0 1
Canada 2 85,8 2
United Kingdom 3 84,3 3
Switzerland 8 76,3 8
Netherlands 14 70,1 9
Germany 9 69,1 10
Sweden 13 69,0 11
Denmark 10 67,7 12
Norway 11 66,3 14
194 The Global Venture Capital and Private Equity Country Attractiveness Index - 2009/2010 annual](https://image.slidesharecdn.com/iesevcpeindexannual2009-110326195513-phpapp02/85/Iese-vcpe-index_annual_2009-193-320.jpg)
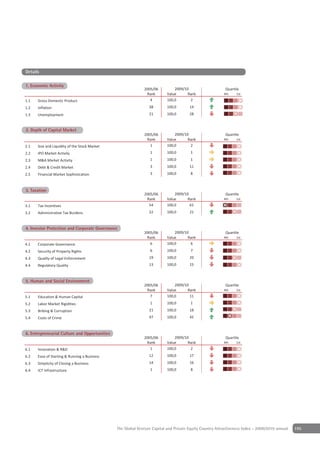
![Regional and country profiles
Urugay
Capital: Montevideo ++ Official Language: Spanish ++ Currency: Uruguayan Peso
Basic Facts VCPE-Ranking
2005/06 2009/10 Quartile
Rank Value Rank 4th 1st
VCPE Ranking 50 33,4 52
Economic Activity 52 65,4 50
Depth of Cap. Market 64 4,7 63
Taxation 45 97,7 56
Inv. Prot. & Corp. Gov. 42 55,3 43
Hum. & Soc. Env. 31 81,1 23
Quartile
4th 1st
Entrepr. Culture & Opp. 42 34,3 43
GDP 29 [bn USD] IPO Volume
Population 3 [mn] M&A Volume
GDP Growth '02 '08 VC Activity
Pop. Growth '02 '08 PE Activity Key Factors Performance
Economic
Activity
125
SWOT Analysis 100
Entrepr. Culture 75 Depth of Cap.
& Opp. 50
Market
Strengths
25
• Human and social environment is strong and improving
0
• Tax regulation, control of corruption, accounting standards, and
openness to inward portfolio investment are the major strengths.
Hum. & Soc.
Taxation
Weaknesses Environment
• A tax reform that became effective in July 2007 has a slightly Uruguay
negative impact on individual deals Latin America
Inv. Prot. &
• Minority rights protection is generally weak Corp. Gov.
United States = 100 Points
• Uruguay has practically no capital market
Opportunities Separate VC and PE Indices
• Public efforts to foster start-ups and innovation, such as a 47
small business loan guarantee programme or a new National
48
Association of Innovation are growing in strengths
49
• A new bankruptcy framework is still under consideration that
50
would facilitate the merger or sale of insolvent companies
Index Rank
51
Threats 52
• Minority rights are generally weak 53
• Uruguay has almost no capital markets, so IPOs are not a viable
54
exit option.
55
Outlook 56
• The country could make its PE/VC business environment more 2005/06 2006/07 2007/08 2008/09 2009/10
attractive by adopting a better legal framework for nationally VC PE VCPE
domiciled fund formation and operation
Comparison within Peer Group
2005/06 2009/10 Quartile
Rank Value Rank 4th 1st
Chile 27 45,8 32
Mexico 51 35,8 49
Brazil 56 34,6 51
Uruguay 50 33,4 52
Peru 54 32,4 53
Colombia 55 29,4 58
Argentina 59 29,1 59
Paraguay 66 14,9 65
Venezuela 65 8,9 66
196 The Global Venture Capital and Private Equity Country Attractiveness Index - 2009/2010 annual](https://image.slidesharecdn.com/iesevcpeindexannual2009-110326195513-phpapp02/85/Iese-vcpe-index_annual_2009-195-320.jpg)

![Regional and country profiles
Venezuela
Capital: Caracas ++ Official Language: Spanish ++ Currency: Bolívar Fuerte
Basic Facts VCPE-Ranking
2005/06 2009/10 Quartile
Rank Value Rank 4th 1st
VCPE Ranking 65 8,9 66
Economic Activity 62 18,1 65
Depth of Cap. Market 62 4,4 65
Taxation 57 95,2 61
Inv. Prot. & Corp. Gov. 66 3,0 66
Hum. & Soc. Env. 65 11,5 65
Quartile
4th 1st
Entrepr. Culture & Opp. 64 8,8 66
GDP 326 [bn USD] IPO Volume
Population 28 [mn] M&A Volume
GDP Growth '02 '08 VC Activity
Pop. Growth '02 '08 PE Activity Key Factors Performance
Economic
Activity
125
SWOT Analysis 100
Entrepr. Culture 75 Depth of Cap.
& Opp. 50
Market
Strengths
25
• Tax incentives for entrepreneurs and investors
0
Weaknesses
• Weak capital market Hum. & Soc.
Taxation
• Low investor protection and governance structures Environment
• Poor infrastructure Venezuela
Opportunities Inv. Prot. & Latin America
Corp. Gov.
• Arise with the establishment of a democratic government United States = 100 Points
Threats
Separate VC and PE Indices
• Strong decrease of GDP and productivity
64
Outlook
• The political situation renders the country not very attractive for
international investment
65
Index Rank
66
67
2005/06 2006/07 2007/08 2008/09 2009/10
VC PE VCPE
Comparison within Peer Group
2005/06 2009/10 Quartile
Rank Value Rank 4th 1st
Chile 27 45,8 32
Mexico 51 35,8 49
Brazil 56 34,6 51
Uruguay 50 33,4 52
Peru 54 32,4 53
Colombia 55 29,4 58
Argentina 59 29,1 59
Paraguay 66 14,9 65
Venezuela 65 8,9 66
198 The Global Venture Capital and Private Equity Country Attractiveness Index - 2009/2010 annual](https://image.slidesharecdn.com/iesevcpeindexannual2009-110326195513-phpapp02/85/Iese-vcpe-index_annual_2009-197-320.jpg)
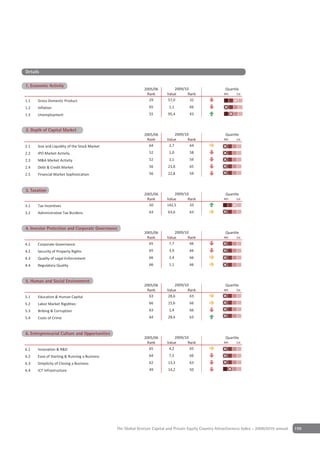
![Regional and country profiles
Vietnam
Capital: Hanoi ++ Official Language: Vietnamese ++ Currency: Dong
Basic Facts VCPE-Ranking
2005/06 2009/10 Quartile
Rank Value Rank 4th 1st
VCPE Ranking 62 27,1 60
Economic Activity 58 43,2 62
Depth of Cap. Market 65 7,6 55
Taxation 40 99,2 55
Inv. Prot. & Corp. Gov. 63 32,2 62
Hum. & Soc. Env. 56 46,5 52
Quartile
4th 1st Entrepr. Culture & Opp. 56 23,7 55
GDP 89 [bn USD] IPO Volume
Population 89 [mn] M&A Volume
GDP Growth '02 '08 VC Activity
Pop. Growth PE Activity
Key Factors Performance
'02 '08
Economic
Activity
125
SWOT Analysis 100
Entrepr. Culture 75 Depth of Cap.
& Opp. Market
Strengths 50
• Comparative advantages in terms of labor costs and productivity 25
• Abundance of natural resources 0
• Continuing progressive reforms of economic and tax regime
Hum. & Soc.
Weaknesses Taxation
Environment
• Deficient legal system
• Financial reporting not yet in line with international standards Vietnam
Inv. Prot. &
• Persistent administrative inefficiencies Corp. Gov.
Asia
United States = 100 Points
Opportunities
• Under-served demand for products and services among large and Separate VC and PE Indices
young population
58
• Opening of markets through WTO commitments
• Extensive room for financial and operational improvements within 59
local companies
60
Threats
Index Rank
• Inflation resulting from expansionary monetary policies 61
• Escalated non-performing loans through aggressive growth-
oriented lending practices 62
• Lack of long-term commitment to address infrastructure 63
shortcomings
64
Outlook 2005/06 2006/07 2007/08 2008/09 2009/10
• Continuing strong global position in commodities production VC PE VCPE
(rice, coffee and tea)
• Progress towards greater transparency and global economic Comparison within Peer Group
integration
• Comparatively attractive investment destination relative to 2005/06 2009/10 Quartile
regional peers due to political stability and increasingly favorable Rank Value Rank 4th 1st
investment policies Hong Kong 4 79,5 5
Japan 7 76,5 7
Tom Herron, Director, Ernst & Young Vietnam Republic of Korea 15 67,5 13
Malaysia 23 54,4 25
China 42 48,5 28
India 46 40,9 38
Indonesia 60 30,7 54
Vietnam 62 27,1 60
Philippines 57 26,1 61
200 The Global Venture Capital and Private Equity Country Attractiveness Index - 2009/2010 annual](https://image.slidesharecdn.com/iesevcpeindexannual2009-110326195513-phpapp02/85/Iese-vcpe-index_annual_2009-199-320.jpg)
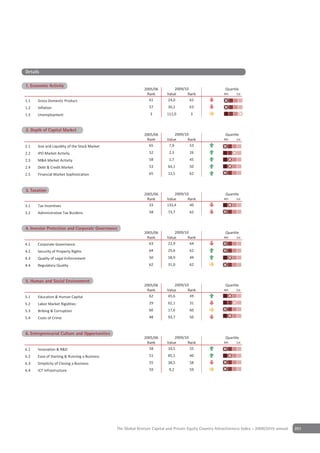


![Appendices
Computation of the index
Regional averages
The VCPE attractiveness of each of the co- The regional and world averages are calculated for each data
series. They are calculated either without weights or weighted by
vered countries is computed by calculating
GDP, or population.
a weighted average of country performance
scores in the before mentioned categories.
The scores within each category are derived
• xq,i = raw data value of category q and country i
from several raw data series. • vi = weight for country i
• i = country i
Some of the raw data series provide values
that are highly related to other country
characteristics (e.g., it is quite comprehen- Normalization
sible that a country with a high population In order to make the cross-sectional data series comparable, the
raw data has to be converted into a common range. The rescaling
has higher expenditures on educations than
method is used to normalize indicators to such a range by linear
a country with a lower population). The- transformation. Thereby, 100 represents the best score, while 1
the worst.
refore, all data series measuring efficiency
For every individual variable, we define whether high values
rather than absolute size are deflated by an influence the attractiveness for investors positively or negatively,
and hence, assign 100 points either to the highest score (e.g., in
appropriate measure. We use the GDP and
case of the GDP per capita) or to the lowest (e.g., in case of high
population to deflate those data series. hiring costs).
The sub-item points for every country are calculated accor-
ding to the following formula:
• yq,i = normalized value of category q and country i
• xq,i = raw data value of category q and country i
• min(xq)) = Minimum raw data value of category q
within the sample
• max(xq)) = Maximum raw data value of category q
within the sample
Example
Raw data value 1 12 20
[any unit] (lowest value in (highest value
sample) in sample)
Normalized value 99x[(1-1)/(20- 99x[(12-1)/(20- 99x[(20-1)/(20-
[1-100] 1)]+1=1 1)]+1=58 1)]+1=100
204 The Global Venture Capital and Private Equity Country Attractiveness Index - 2009/2010 annual](https://image.slidesharecdn.com/iesevcpeindexannual2009-110326195513-phpapp02/85/Iese-vcpe-index_annual_2009-203-320.jpg)
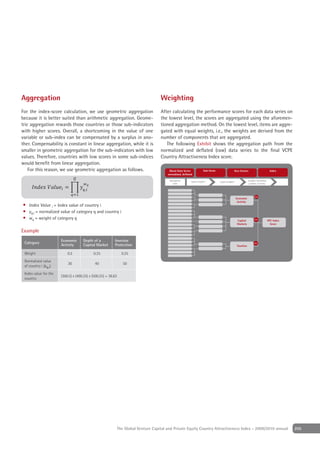
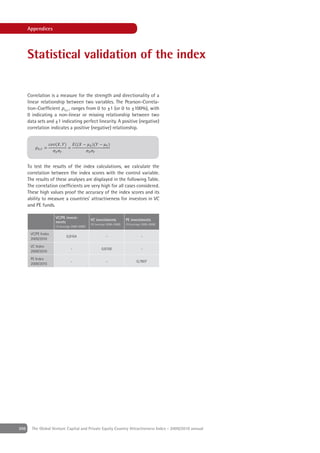
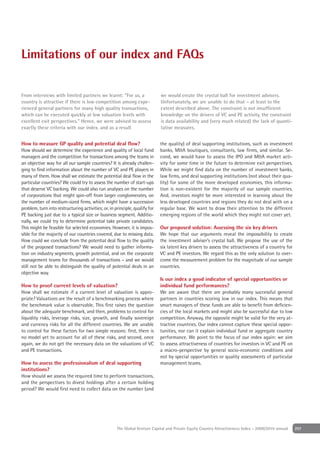
![Appendices
Table with sources and explanations
of the data series
Indicators Dimension Positive/ VC PE Explanation Source
for index negative
calculation impact
1 Economic Activity
1.1 Gross Domestic Product
1.1.1 Total Economic [LN GDP in USD] + X X The economic size of a country is measured by its GDP, which is the Euromonitor International
Size sum of gross value added by all resident producers in the economy from IMF (International
plus any product taxes and minus any subsidies not included in the Financial Statistics)
value of the products. It is calculated without making deductions for
depreciation of fabricated assets or for depletion and degradation of
natural resources.
1.1.2 GDP per Capita [‘000 USD per + X X Find definition above (Economic Size 1.1.1). “Per Capita” describes Euromonitor International
capita] the division of each data point by the corresponding size of the from IMF (International
country’s population (e.g. Finland’s GDP in 2004 divided by its size of Financial Statistics)
population in this year).
1.1.3 Real GDP year-on- [%] + X X Gross domestic product is the sum of gross value added by all Euromonitor International
year Growth resident producers in the economy plus any product taxes and from IMF (International
minus any subsidies not included in the value of the products. It is Financial Statistics and
calculated without making deductions for depreciation of fabricated World Economic Outlook/
assets or for depletion and degradation of natural resources. Real UN/national statistics)
GDP: the number reached by valuing all the productive activity
within the country at a specific year's prices. When economic activity
of two or more time periods is valued at the same year's prices, the
resulting figure allows comparison of purchasing power over time,
since the effects of inflation have been removed by maintaining
constant prices.
1.2 Inflation [%] - X X The annual average inflation rate indicates the average percentage IMF
increase in the price of goods and services comparing every month
of the year with corresponding month last year. Data are averages
for the year, not end-of-period data.
1.3 Unemployment [%] - X X Unemployment rate: the International Labor Organization (ILO) Euromonitor
Rate international standard definition of unemployment is based on the International from ILO
following three criteria which should be satisfied simultaneously:
"without work", "currently available for work" and "seeking work".
2 Depth of a Capital Market
2.1 Size and Liquidity of the Stock Market
2.1.1 Market [% of GDP] + X X Market capitalization is the share price times the number of shares World Bank (World
Capitalization of outstanding. Listed domestic companies are the domestically Development Indicator)
Listed Companies incorporated companies listed on the country's stock exchanges at
the end of the year. Listed companies do not include investment
companies, mutual funds, or other collective investment vehicles.
2.1.2 Stock Market Total [% of GDP] + X X “Stock Market Total Value Traded” refers to the total value of shares World Bank (World
Value Traded traded during the period. This indicator complements the market Development Indicator)
capitalization ratio by showing whether market size is matched by
trading.
2.1.3 Listed Domestic [% of total + X X Listed domestic companies are the domestically incorporated World Bank (World
Companies sample sum] companies listed on the country's stock exchanges at the end of the Development Indicator)
year. This indicator does not include investment companies, mutual
funds, or other collective investment vehicles.
208 The Global Venture Capital and Private Equity Country Attractiveness Index - 2009/2010 annual](https://image.slidesharecdn.com/iesevcpeindexannual2009-110326195513-phpapp02/85/Iese-vcpe-index_annual_2009-207-320.jpg)
![Indicators Dimension Positive/ VC PE Explanation Source
for index negative
calculation impact
2.2 IPO Market Activity
2.2.1 IPO Volume [% of total + X X Proceeds amount + overallotment sold in this market: Thomson One Banker
sample sum] This data series shows the proceeds amount of the issue in this
market plus the overallotment amount (a.k.a. green shoe) sold in this
market; i.e., number of shares in this market plus the overallotment
shares sold in this market multiplied by the offer price. A green shoe
clause in an underwriting agreement provides that, in the case of
excess demand, the issuer will authorize additional shares to be sold
through the existing syndicate.
2.2.2 Number of IPOs [% of total + X X Number of IPOs in a country. Thomson One Banker
sample sum]
2.3 M&A Market Activity
2.3.1 M&A Market [% of total + X X The data comprise M&A ranking value incl. net debt of target. Thomson One Banker
Volume sample sum] According to Thomson the ranking value is calculated as follows:
RANKVAL = VALNOLIA + straight debt + short-term debt + preferred
equity-cash; VALNOLIA = transaction value excluding liabilities
assumed; transaction value minus the value of any liabilities agreed
to be assumed in the transaction.
2.3.2 Number of M&A [% of total + X X Number of M&A deals in a country. Thomson One Banker
Deals sample sum]
2.4 Debt and Credit Market
2.4.1 Domestic Credit [% of GDP] + - X Domestic credit provided by the banking sector includes all credit World Bank (World
provided by to various sectors on a gross basis, with the exception of credit to Development Indicator)
Banking Sector the central government, which is net. The banking sector includes
monetary authorities and deposit money banks, as well as other banking
institutions where data are available (including institutions that do not
accept transferable deposits but do incur such liabilities as time and
savings deposits). Examples of other banking institutions are savings and
mortgage loan institutions and building and loan associations.
2.4.2 Ease of Access to [-] + - X This data series measures the perceived simplicity of obtaining a bank WEF
Loans loan in a country with only a good business plan and no collateral.
2.4.3 Credit Information [-] + - X The depth of credit information index measures rules affecting World Bank, Doing
Index the scope, accessibility and quality of credit information available Business
through either public or private credit registries. The index ranges
from 0 to 6, with higher values indicating the availability of more
credit information, from either a public registry or a private bureau,
to facilitate lending decisions. If the registry is not operational or has
coverage of less than 0.1% of the adult population, the score on the
depth of credit information index is 0.
2.4.4 Soundness of [-] + - X This data series measures the perceived “Soundness of Banks” in a WEF
Banks country. The index ranges from 1 to 7, with higher values indicating
that banks are generally healthy with sound balance sheets and low
values indicating that banks are in danger of insolvency and may
require a government bailout.
2.4.5 Interest Rate [%] - - X Interest rate spread is the interest rate charged by banks on loans International Monetary
Spread to prime customers minus the interest rate paid by commercial or Fund (IMF), World
similar banks for demand, time, or savings deposits. Development Indicators
(WDI)
2.4.6 Bank Non- [%] - - X Bank non-performing loans to total gross loans are the value of World Bank (World
performing Loans non-performing loans divided by the total value of the loan portfolio Development Indicator)
to Total Gross (including non-performing loans before the deduction of specific
Loans loan-loss provisions). The loan amount recorded as non-performing
should be the gross value of the loan as recorded on the balance
sheet, not just the amount that is overdue.
2.5 Financial Market [-] + X X This data series measures the perceived level of sophistication of WEF
Sophistication financial markets in a country. The index ranges 1 to 7, with higher
values indicating that financial market sophistication is excellent by
international standards and low values indicating that it is poor by
international standards.
The Global Venture Capital and Private Equity Country Attractiveness Index - 2009/2010 annual 209](https://image.slidesharecdn.com/iesevcpeindexannual2009-110326195513-phpapp02/85/Iese-vcpe-index_annual_2009-208-320.jpg)
![Appendices
Indicators Dimension Positive/ VC PE Explanation Source
for index negative
calculation impact
3 Taxation
3.1 Tax Incentives
3.1.1 Marginal [%] - X X Highest marginal tax rate (corporate rate) is the highest rate shown World Bank (World
Corporate Tax on the schedule of tax rates applied to the taxable income of Development Indicator);
Rate corporations. KPMG´s Corporate and
indirect tax rate survey
2008
3.1.2 Incentive for being [%] + X - Difference: income tax - corporate tax. The meaning of this driver is Please see 3.1.1, Fraser
an Entrepreneur based on the fact that an employee tends to become entrepreneur if Institute for Income Tax
the individual tax payment is significant higher than the corporate tax.
3.1.3 Labor Tax and [%] - X - Doing Business measures all taxes and contributions that are World Bank (Doing
Contributions government mandated (at any level - federal, state or local), apply Business)
to a medium-sized business and have an impact in its income
statements.
3.1.4 Profit and Capital [%] - X X Commercial profits are defined as sales minus cost of goods sold, World Bank (Doing
Gains Tax minus gross salaries, minus administrative expenses, minus other Business)
expenses, minus provisions, plus capital gains (from the property sale)
minus interest expense, plus interest income and minus commercial
depreciation. To compute the commercial depreciation, a straight-
line depreciation method is applied with the following rates: 0% for
the land, 5% for the building, 10% for the machinery, 33% for the
computers, 20% for the office equipment, 20% for the truck and
10% for business development expenses.
3.2 Administrative Tax Burdens
3.2.1 Number of [#] - X - The tax payments indicator reflects the total number of taxes World Bank (Doing
Payments and contributions paid, the method of payment, the frequency of Business)
payment and the number of agencies involved for this standardized
case during the second year of operation. It includes payments made
by the company on consumption taxes, such as sales tax or value
added tax. These taxes are traditionally withheld on behalf of the
consumer. Although they do not affect the income statements of the
company, they add to the administrative burden of complying with
the tax system and so are included in the tax payments measure.
3.2.2 Time spent on Tax [Hours per year] - X - Time is recorded in hours per year. The indicator measures the time World Bank (Doing
Issues to prepare, file and pay (or withhold) three major types of taxes and Business)
contributions: the corporate income tax, value added or sales tax
and labor taxes, including payroll taxes and social contributions.
Preparation time includes the time to collect all information
necessary to compute the tax payable. If separate accounting books
must be kept for tax purposes - or separate calculations made - the
time associated with these processes is included. This extra time is
included only if the regular accounting work is not enough to fulfill
the tax accounting requirements. Filing time includes the time to
complete all necessary tax forms and make all necessary calculations.
Payment time is the hours needed to make the payment online or at
the tax office. Where taxes and contributions are paid in person, the
time includes delays while waiting.
4 Investor Protection and Corporate Governance
4.1 Corporate Governance
4.1.1 Disclosure Index [-] + X X This index measures the extent to which transparency of enterprise World Bank (Doing
related party transactions exists. The index ranges from 0 to 10, with Business)
higher values indicating greater disclosure.
4.1.2 Director Liability [-] + X X This index measures the extent of liability for self-dealing. The index World Bank (Doing
Index ranges from 0 to 10, with higher values indicating greater liability of Business)
directors.
210 The Global Venture Capital and Private Equity Country Attractiveness Index - 2009/2010 annual](https://image.slidesharecdn.com/iesevcpeindexannual2009-110326195513-phpapp02/85/Iese-vcpe-index_annual_2009-209-320.jpg)
![Indicators Dimension Positive/ VC PE Explanation Source
for index negative
calculation impact
4.1.3 Shareholder Suits [-] + X X This index measures the extent of shareholders’ ability to sue officers World Bank (Doing
Index and directors for misconduct. The index ranges from 0 to 10, with Business)
higher values indicating greater powers of shareholders to challenge
the transaction.
4.1.4 Legal Rights Index [-] + X X The strength of legal rights index measures the degree to which World Bank (Doing
collateral and bankruptcy laws protect the rights of borrowers and Business)
lenders and thus facilitate lending. The index ranges from 0 to 10,
with higher scores indicating that collateral and bankruptcy laws are
better designed to expand access to credit.
4.1.5 Efficacy of [-] + X X Corporate governance by investors and boards of directors in WEF
Corporate Boards your country is characterized by (1 = management has little
accountability, 7 = investors and Boards exert strong supervision of
management decisions)
4.2 Security of Property Rights
4.2.1 Legal Enforcement [-] + X X This component is based on the World Bank’s Doing Business Fraser Institute
of Contracts estimates for the time and money required to collect a clear-cut
debt.
4.2.2 Property Rights [-] + X X “Property rights” is an assessment of the ability of individual to Heritage Foundation
accumulate private property, secured by clear laws that are fully
enforced by the state.
4.2.3 Intellectual [-] + X X This data series measures the perceived “Intellectual Property WEF (Executive Opinion
Property Protection” in a country. The index ranges from 1 to 7, with higher Survey 2007, 2008)
Protection values indicating that Intellectual property protection and anti-
counterfeiting measures in a country are strong and enforced
whereas low values indicate the opposite.
4.3 Quality of Legal Enforcement
4.3.1 Judicial [-] + X X This data series measures the perceived “Judicial Independence” in a Fraser Institute. WEF
Independence country. The index ranges from 0 to 7, with higher values indicating (Global Competitiveness
that the judiciary in a country is independent from political Report )
influences of members of government, citizens, or firms and lower
values indicating that it is heavily influenced.
4.3.2 Impartial Courts [-] + X X This data series measures the perceived quality of the legal Fraser Institute
framework in a country. The index ranges from 0 to 10, with
higher values indicating that the framework in a country for
private businesses to settle disputes and challenge the legality of
government actions and/or regulations follows a clear, neutral
process. Lower values indicate that the framework seems to be
inefficient and subject to manipulation.
4.3.3 Integrity of the [-] + X X This component is based on two sub-components. Each sub- Fraser Institute. PRS Group
Legal System component equals half of the total. The “law” sub-component (International Country
assesses the strength and impartiality of the legal system, and the Risk Guide)
“order” sub-component assesses popular observance of the law. The
index ranges from 0 to 10. High rating values indicate a sound legal
system.
4.3.4 Rule of Law [-] + X X “Rule of Law” measures the extent to which agents have confidence World Bank (Worldwide
in and abide by the rules of society, in particular the quality of Governance Indicator)
contract enforcement, the police, and the courts, as well as the
likelihood of crime and violence. The index ranges from 0 to 100.
4.4 Regulatory [-] + X X “Regulatory Quality” measures the ability of the government to World Bank (Worldwide
Quality formulate and implement sound policies and regulations that Governance Indicator)
permit and promote private sector development. The index ranges
from -2.5 to 2.5 with higher values corresponding to better
governance outcomes.
The Global Venture Capital and Private Equity Country Attractiveness Index - 2009/2010 annual 211](https://image.slidesharecdn.com/iesevcpeindexannual2009-110326195513-phpapp02/85/Iese-vcpe-index_annual_2009-210-320.jpg)
![Appendices
Indicators Dimension Positive/ VC PE Explanation Source
for index negative
calculation impact
5 Human and Social Environment
5.1 Education and Human Capital
5.1.1 Quality of the [-] + X X This data series measures the perceived “Quality of the Educational WEF
Educational System” in a country. The index ranges from 1 to 7, with higher
System values indicating that the educational system in a country meets the
needs of a competitive economy. Low values indicate that the system
does not meet the needs of a competitive economy.
5.1.2 Quality of [-] + X X This data series measures the perceived “Quality of Scientific WEF
Scientific Research Research Institutions” in a country. The index ranges from 1 to 7,
Institutions with higher values indicating that Scientific research institutions in
a country (e.g., university laboratories, government laboratories) are
the best in their fields internationally. Low values indicate that they
are not competitive or nonexistent.
5.2 Labor Market Rigidities
5.2.1 Difficulty of Hiring [-] - X X This Index measures the “Difficulty of hiring” regarding (i) whether World Bank (Doing
Index fixed term contracts are prohibited for permanent tasks; (ii) the Business)
maximum cumulative duration of fixed term contracts; and (iii) the
ratio of the minimum wage for a trainee or first time employee to
the average value added per worker. The index ranges from 0 to 100.
High scores are assigned to countries where fixed-term contracts are
prohibited for permanent tasks, the maximum cumulative duration
of fixed-term contracts is low, and if the ratio of the minimum wage
to the average value added per worker is high.
5.2.2 Rigidity of Hours [-] - X X This index measures the “Rigidity of hours index” regarding five World Bank (Doing
Index components: (i) whether night work is unrestricted; (ii) whether Business)
weekend work is unrestricted; (iii) whether the work week can
consist of 5.5 days; (iv) whether the workweek can extend to 50
hours or more (including overtime) for two months a year to respond
to a seasonal increase in production; and (v) whether paid annual
vacation is 21 working days or fewer. The index ranges from 0 to
100. High scores are assigned to countries where the five before
mentioned statements are not true.
5.2.3 Difficulty of Firing [-] - X X The “Difficulty of Firing Index” has eight components: (i) whether World Bank (Doing
Index redundancy is disallowed as a basis for terminating workers; (ii) Business)
whether the employer needs to notify a third party (such as a
government agency) to terminate one redundant worker; (iii)
whether the employer needs to notify a third party to terminate a
group of 25 redundant workers; (iv) whether the employer needs
approval from a third party to terminate one redundant worker; (v)
whether the employer needs approval from a third party to terminate
a group of 25 redundant workers; (vi) whether the law requires the
employer to reassign or retrain a worker before making the worker
redundant; (vii) whether priority rules apply for redundancies; and
(viii) whether priority rules apply for reemployment. For the first
question an answer of yes for workers of any income level gives a
score of 10 and means that the rest of the questions do not apply.
An answer of yes to question (iv) gives a score of 2. For every other
question, if the answer is yes, a score of 1 is assigned; otherwise
a score of 0 is given. Questions (i) and (iv), as the most restrictive
regulations, have greater weight in the construction of the index.
5.2.4 Firing Costs [Weeks of - X X The “Firing Cost indicator” measures the cost of advance notice World Bank (Doing
wages] requirements, severance payments and penalties due when Business)
terminating a redundant worker, expressed in weeks of salary. If the
firing cost adds up to eight or fewer weeks of salary, a score of 0 is
assigned. If the cost adds up to more than eight weeks of salary, the
score is the number of weeks. One month is recorded as four and
1/3 weeks.
212 The Global Venture Capital and Private Equity Country Attractiveness Index - 2009/2010 annual](https://image.slidesharecdn.com/iesevcpeindexannual2009-110326195513-phpapp02/85/Iese-vcpe-index_annual_2009-211-320.jpg)
![Indicators Dimension Positive/ VC PE Explanation Source
for index negative
calculation impact
5.3 Bribing and Corruption
5.3.1 Bribing and [-] + X X This index describes the overall extent of corruption (frequency and/ Transparency International
Corruption Index or size of bribes) in the public and political sectors. The index ranges
from 0 to 10. Countries where bribing and corruption cases are
frequent receive a low rating score.
5.3.2 Control of [-] + X X This data series measures the perception of the extent to which World Bank (Worldwide
Corruption public power is exercised for private gain, including both petty and Governance Indicator)
grand forms of corruption, as well as "capture" of the state by elites
and private interests. Countries in which seemingly public power
is frequently used for private gain a low rating score. The index
ranges from -2.5 to 2.5 with higher values corresponding to better
governance outcomes.
5.3.3 Extra Payments/ [-] + X X This index measures the frequency of extra payments and bribes Fraser Institute
Bribes firms pay in a country. The index ranges from 0 to 10 with higher
values corresponding to better governance outcomes. Countries
where these payments are frequent receive a low rating score.
5.4 Costs of Crime
5.4.1 Business Costs [-] + X X This data series measures the costs on businesses imposed by the WEF
of Crime and incidence of common crime and violence in a country. The index
Violence ranges from 1 to 7. High values are assigned to countries where
crime does not impose significant costs on businesses.
5.4.2 Cost of Organized [-] + X X This data series measures the perceived “Cost of Organized Crime” in WEF
Crime a country. The index ranges from 1 to 7 with higher values indicating
that organized crime (mafia-oriented racketeering, extortion) in
a country does not impose significant costs on businesses. Lower
values indicate that organized crime imposes significant costs on
businesses.
6 Entrepreneurial Opportunities
6.1 Innovation and R&D
6.1.1 General [-] + X - The framework groups the eight pillars of innovation into two INSEAD
Innovativeness categories: inputs and outputs. The five input pillars – institutions
Index and policies, human capacity, infrastructure, technological
sophistication and business markets and capital - represent aspects
which enhance the capacity of a nation to generate ideas and
leverage them for innovative products and services. The three
output pillars - knowledge, competitiveness, and wealth - represent
the ultimate benefits of innovation for a nation - more knowledge
creation, increased competitiveness and greater wealth generation.
Each pillar of the GII model is measured by a number of quantitative
and qualitative variables. The averaged scores for the input and
output pillars together give an overall score - the Global Innovation
Index. The values of each variable for the country are scaled on a
range of 1 to 7.
6.1.2 Capacity for [-] + X - This index measures the perceived “Capacity for Innovation” in a WEF
Innovation country. The index ranges from 1 to 7 with higher values indicating
that companies obtain technology by conducting formal research
and pioneering their own new products and processes. Low values
indicate that companies obtain technology exclusively from licensing
or imitating foreign companies.
6.1.3 Company [-] + X - This index measures the “Company Spending on R&D” in a country. WEF
Spending on R&D The index ranges from 1 to 7 with higher values indicating that
companies in a country spend heavily on research and development
relative to international peers. Low values indicate that companies do
not spend money on research and development.
The Global Venture Capital and Private Equity Country Attractiveness Index - 2009/2010 annual 213](https://image.slidesharecdn.com/iesevcpeindexannual2009-110326195513-phpapp02/85/Iese-vcpe-index_annual_2009-212-320.jpg)
![Appendices
Indicators Dimension Positive/ VC PE Explanation Source
for index negative
calculation impact
6.1.4 Utility Patents [# per mn + X - This data series provides the number of utility patents (i.e., patents WEF
population] for invention) granted between January 1 and December 31, 2007,
per million population.
6.1.5 Scientific and [# per capita] + X - The data series “Scientific and Technical Journal Articles” refer to World Bank (World
Technical Journal the number of scientific and engineering articles published in the Development Indicator)
Articles following fields: physics, biology, chemistry, mathematics, clinical
medicine, biomedical research, engineering and technology and
earth.
6.2 Ease of Starting and Running a Business
6.2.1 Number of [#] - X - This data series provides the average number of administrative World Bank (Doing
Procedures to procedures necessary to start a business in a country. A procedure Business)
start a Business is defined as any interaction of the company founder with external
parties (for example, government agencies, lawyers, auditors or
notaries). Interactions between company founders or company
officers and employees are not counted as procedures. Only
procedures required of all businesses are covered. Industry-specific
procedures are excluded. For example, procedures to comply with
environmental regulations are included only when they apply to all
businesses conducting general commercial or industrial activities.
Procedures that the company undergoes to connect to electricity,
water, gas and waste disposal services are not included.
6.2.2 Time needed to [Days] - X - This data series provides the average number of days necessary to World Bank (Doing
start a Business start a business in a country. Time is recorded in calendar days. The Business)
measure captures the median duration that incorporation lawyers
indicate is necessary to complete a procedure with minimum follow-
up with government agencies and no extra payments. It is assumed
that the minimum time required for each procedure is one day.
6.2.3 Cost of Business [% of income - X - This data series provides the average amount of money necessary to World Bank (Doing
Start-Up per capita] start a business in a country. Cost is recorded as a percentage of the Business)
Procedures country’s income per capita. It includes all official fees and fees for
legal or professional services if such services are required by law. Fees
for purchasing and legalizing company books are included if these
transactions are required by law. The cost excludes bribes.
6.2.4 Minimum Capital [% of income - X - The paid-in minimum capital requirement reflects the amount that World Bank (Doing
per capita] the entrepreneur needs to deposit in a bank or with a notary before Business)
registration and up to three months following incorporation and
is recorded as a percentage of the country’s income per capita. The
amount is typically specified in the commercial code or the company
law. Many countries have a minimum capital requirement but allow
businesses to pay only a part of it before registration, with the rest to
be paid after the first year of operation.
6.2.5 Administrative [-] + X - This data series measures the perceived “Administrative Fraser Institute
Requirements Requirements” in a country. The index ranges from 0 to10 with
higher values indicating that complying with administrative
requirements (permits, regulations, reporting) issued by the
government in a country is not burdensome. Lower values indicate
that the administrative requirements are perceived as burdensome.
6.3 Simplicity of Closing a Business
6.3.1 Time [Years] - X X This data series provides the average number of years necessary to World Bank (Doing
close a business in a country. Time is recorded in calendar years. Business)
Information is collected on the sequence of procedures and on
whether any procedures can be carried out simultaneously. Potential
delay tactics by the parties, such as the filing of dilatory appeals or
requests for extension, are taken into consideration.
214 The Global Venture Capital and Private Equity Country Attractiveness Index - 2009/2010 annual](https://image.slidesharecdn.com/iesevcpeindexannual2009-110326195513-phpapp02/85/Iese-vcpe-index_annual_2009-213-320.jpg)
![Indicators Dimension Positive/ VC PE Explanation Source
for index negative
calculation impact
6.3.2 Cost [% of estate] - X X This data series provides the average costs of closing a business in World Bank (Doing
a country. The cost of the proceedings is recorded as a percentage Business)
of the estate’s value. The cost is calculated on the basis of survey
responses by insolvency practitioners and includes court fees as well
as fees of insolvency practitioners, independent assessors, lawyers
and accountants. Respondents provide cost estimates from among
the following options: less than 2%, 2–5%, 5–8%, 8–11%, 11–18%,
18–25%, 25–33%, 33–50%, 50–75% and more than 75% of the
value of the business estate.
6.3.3 Recovery Rate [Cents on US$] + X X The recovery rate is recorded as cents on the dollar recouped by World Bank (Doing
[Cents on US$] creditors through the bankruptcy or insolvency proceedings. The Business)
calculation takes into account whether the business emerges from
the proceedings as a going concern as well as costs and the loss
in value due to the time spent closing down. If the business keeps
operating, no value is lost on the initial claim, set at 100 cents on the
dollar. If it does not, the initial 100 cents on the dollar are reduced
to 70 cents on the dollar. Then the official costs of the insolvency
procedure are deducted (one cent for each percentage of the initial
value). Finally, the value lost as a result of the time the money
remains tied up in insolvency proceedings is taken into account,
including the loss of value due to depreciation of the hotel furniture.
Consistent with international accounting practice, the depreciation
rate for furniture is taken to be 20%. The furniture is assumed to
account for a quarter of the total value of assets. The recovery rate
is the present value of the remaining proceeds, based on end-
2006 lending rates from the IMFs International Financial Statistics,
supplemented with data from central banks.
6.4 ICT Infrastructure (Information and Communications Technology)
6.4.1 Broadband [# per 100 + X - This data series provides the total number of broadband subscribers World Bank (World
Subscribers people] with a digital subscriber line, cable modem, or other high-speed Development Indicator)
technologies in a country.
6.4.2 Fixed Line and [# per 100 + X - Fixed lines are telephone mainlines connecting a customer's World Bank (World
Mobile Phone people] equipment to the public switched telephone network. Development Indicator)
Subscribers
6.4.3 Internet Users [# per 100 + X - Internet users are people with access to the worldwide network. World Bank (World
people] Development Indicator)
6.4.4 Secure Internet [# per mn + X - Secure servers are servers using encryption technology in Internet World Bank (World
Servers people] transactions. Development Indicator)
Correlation Data
Venture Capital LN [USD mn] X Amount of venture capital investments in a country per year. The Thomson One
Investments country is defined by fund location. Thomson Reuters uses the term
to describe the universe of venture investing. It does not include
buyout investing, mezzanine investing, fund of fund investing,
secondaries, etc.
Private Equity LN [USD mn] X Amount of private equity investments in a country per year. The Thomson One
Investments country is defined by fund location. Thomson Reuters uses the term
to describe the universe of all venture investing, buyout investing
and mezzanine investing.
Venture Capital LN [USD mn] X X The sum of venture capital and private equity investments in a Thomson One
and Private Equity country per year.
Investments
The Global Venture Capital and Private Equity Country Attractiveness Index - 2009/2010 annual 215](https://image.slidesharecdn.com/iesevcpeindexannual2009-110326195513-phpapp02/85/Iese-vcpe-index_annual_2009-214-320.jpg)
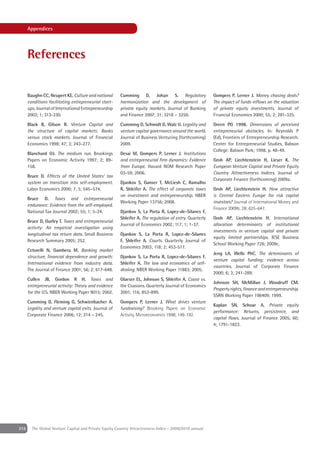
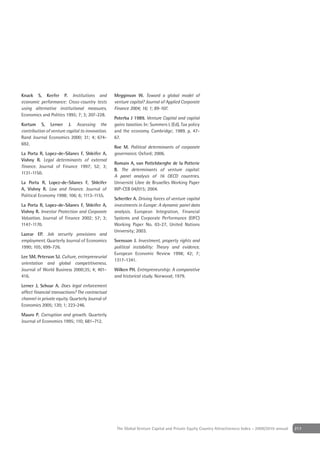
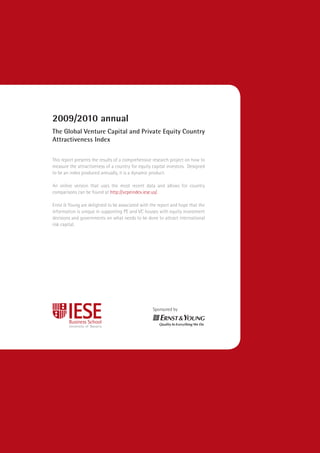

This document is the annual Global Venture Capital and Private Equity Country Attractiveness Index for 2009/2010 published by Alexander Groh and Heinrich Liechtenstein. It measures and ranks countries based on their attractiveness for venture capital and private equity investments. The index analyzes over 300 data points for many countries and calculates scores based on factors like market size, economic activity, capital market development, taxation, and legal protections. It finds the United States to be the most attractive country, followed by Canada, the UK, Israel, and India. The report also includes analysis of VC/PE activity and conditions in different global regions.


