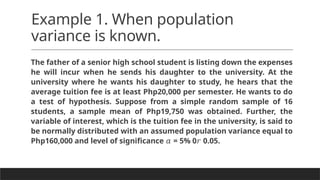
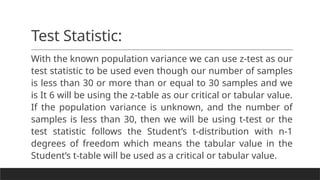
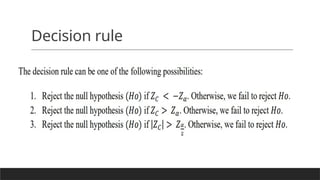
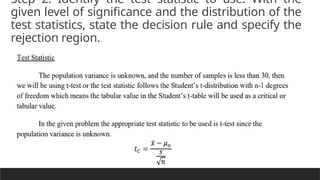
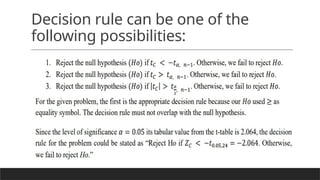
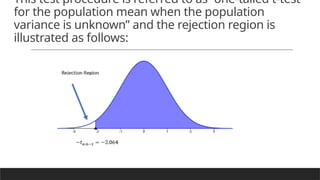
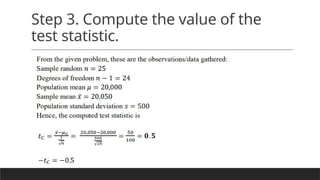
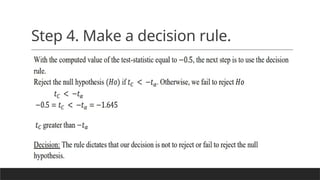
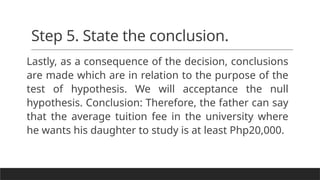
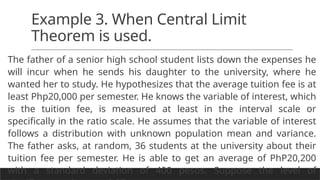
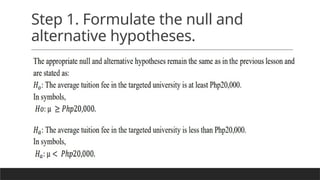
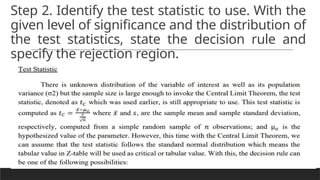
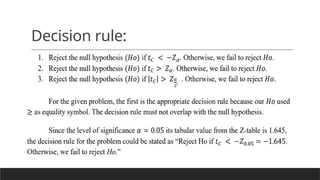
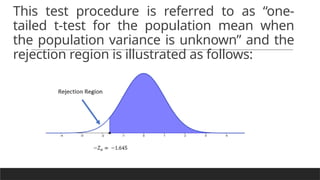
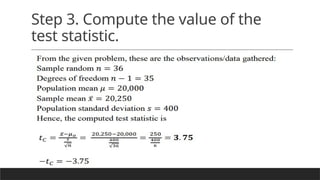
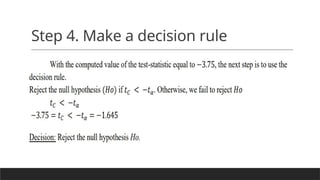
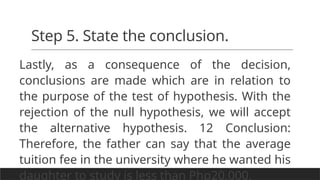
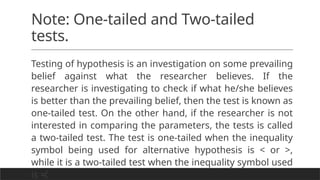
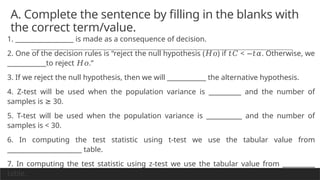
Rejection
Region and
Hypothesis
Testing on the
Population
Mean
Example 1. When population
variance is known.
The father of a senior high school student is listing down the expenses
he will incur when he sends his daughter to the university. At the
university where he wants his daughter to study, he hears that the
average tuition fee is at least Php20,000 per semester. He wants to do
a test of hypothesis. Suppose from a simple random sample of 16
students, a sample mean of Php19,750 was obtained. Further, the
variable of interest, which is the tuition fee in the university, is said to
be normally distributed with an assumed population variance equal to
Php160,000 and level of significance = 5% 0 0.05.
𝛼 𝑟
Test Statistic:
With the known population variance we can use z-test as our
test statistic to be used even though our number of samples
is less than 30 or more than or equal to 30 samples and we
is It 6 will be using the z-table as our critical or tabular value.
If the population variance is unknown, and the number of
samples is less than 30, then we will be using t-test or the
test statistic follows the Student’s t-distribution with n-1
degrees of freedom which means the tabular value in the
Student’s t-table will be used as a critical or tabular value.
Decision rule
For the given problem, the first is the
appropriate decision rule because our used
𝐻𝑜
as equality symbol. The decision rule must not
≥
overlap with the null hypothesis.
Since the level of significance = 0.05 its
𝛼
tabular value from the z-table is 1.645, the
decision rule for the problem could be stated
as “Reject Ho if < 0.05 = 1.645.
𝑍𝐶 −𝑍 −
Otherwise, we fail to reject Ho.”
This test procedure is referred to as “one-tail Z-test for the
population mean when the population variance is known”
and the rejection region is illustrated as follows:
Compute the value of the test
statistic.
Hence, the computed test statistic is.
Make a decision rule.
State the conclusion.
Example 2: When population
variance is unknown.
The father of a senior high school student lists down the expenses
he will incur when he sends his daughter to the university where
he wants her to study. He hypothesizes that the average tuition fee
is at least Php20,000 per semester. He knows the variable of
interest, which is the tuition fee, is measured at least in the interval
scale or specifically in the ratio scale. He assumes that the variable
of interest follows the normal distribution but both populations
mean, and variance are unknown. The father asks, at random, 25
students at the university about their tuition fee per semester. He
is able to get an average of Php20,050 with a standard deviation of
Step 1. Formulate the null and
alternative hypotheses.
Step 2. Identify the test statistic to use. With the
given level of significance and the distribution of the
test statistics, state the decision rule and specify the
rejection region.
Decision rule can be one of the
following possibilities:
This test procedure is referred to as “one-tailed t-test
for the population mean when the population
variance is unknown” and the rejection region is
illustrated as follows:
Step 3. Compute the value of the
test statistic.
Step 4. Make a decision rule.
Step 5. State the conclusion.
Lastly, as a consequence of the decision, conclusions
are made which are in relation to the purpose of the
test of hypothesis. We will acceptance the null
hypothesis. Conclusion: Therefore, the father can say
that the average tuition fee in the university where
he wants his daughter to study is at least Php20,000.
Example 3. When Central Limit
Theorem is used.
The father of a senior high school student lists down the expenses he
will incur when he sends his daughter to the university, where he
wanted her to study. He hypothesizes that the average tuition fee is at
least Php20,000 per semester. He knows the variable of interest, which
is the tuition fee, is measured at least in the interval scale or
specifically in the ratio scale. He assumes that the variable of interest
follows a distribution with unknown population mean and variance.
The father asks, at random, 36 students at the university about their
tuition fee per semester. He is able to get an average of PhP20,200
with a standard deviation of 400 pesos. Suppose the level of
Step 1. Formulate the null and
alternative hypotheses.
Step 2. Identify the test statistic to use. With the
given level of significance and the distribution of
the test statistics, state the decision rule and
specify the rejection region.
Decision rule:
This test procedure is referred to as “one-
tailed t-test for the population mean when
the population variance is unknown” and the
rejection region is illustrated as follows:
Step 3. Compute the value of the
test statistic.
Step 4. Make a decision rule
Step 5. State the conclusion.
Lastly, as a consequence of the decision,
conclusions are made which are in relation to
the purpose of the test of hypothesis. With the
rejection of the null hypothesis, we will accept
the alternative hypothesis. 12 Conclusion:
Therefore, the father can say that the average
tuition fee in the university where he wanted his
daughter to study is less than Php20,000.
Note: One-tailed and Two-tailed
tests.
Testing of hypothesis is an investigation on some prevailing
belief against what the researcher believes. If the
researcher is investigating to check if what he/she believes
is better than the prevailing belief, then the test is known as
one-tailed test. On the other hand, if the researcher is not
interested in comparing the parameters, the tests is called
a two-tailed test. The test is one-tailed when the inequality
symbol being used for alternative hypothesis is < or >,
while it is a two-tailed test when the inequality symbol used
is ≠.
A. Complete the sentence by filling in the blanks with
the correct term/value.
1. __________________ is made as a consequence of decision.
2. One of the decision rules is “reject the null hypothesis ( ) if < . Otherwise, we
𝐻𝑜 𝑡𝐶 −𝑡𝛼
____________to reject .”
𝐻𝑜
3. If we reject the null hypothesis, then we will ____________ the alternative hypothesis.
4. Z-test will be used when the population variance is __________ and the number of
samples is 30.
≥
5. T-test will be used when the population variance is ___________ and the number of
samples is < 30.
6. In computing the test statistic using t-test we use the tabular value from
_______________________ table.
7. In computing the test statistic using z-test we use the tabular value from __________
table.
Assignment: Conduct the test of hypothesis using
the appropriate components of the test procedure
of the given real-life problem.
The minimum wage earners of the National Capital Region are believed
to be receiving less than Php500 per day. The CEO of a large supermarket
chain in the region is claiming to be paying its contractual higher than the
minimum daily wage rate of Php500. To check on this claim, a labor union
leader obtained a random sample of 144 contractual employees from this
supermarket chain. The survey of their daily wage earnings resulted to an
average wage of Php510 per day with standard deviation of Php100. The
daily wage of the region is assumed to follow a distribution with an
unknown population variance. Perform a test of hypothesis at 5% level of
significance to help the labor union leader make an empirical based
conclusion on the CEO’s claim.

Identifying Rejection Region and Hypothesis Testing on the.pptx

  • 1.
  • 2.
    Example 1. Whenpopulation variance is known. The father of a senior high school student is listing down the expenses he will incur when he sends his daughter to the university. At the university where he wants his daughter to study, he hears that the average tuition fee is at least Php20,000 per semester. He wants to do a test of hypothesis. Suppose from a simple random sample of 16 students, a sample mean of Php19,750 was obtained. Further, the variable of interest, which is the tuition fee in the university, is said to be normally distributed with an assumed population variance equal to Php160,000 and level of significance = 5% 0 0.05. 𝛼 𝑟
  • 3.
    Test Statistic: With theknown population variance we can use z-test as our test statistic to be used even though our number of samples is less than 30 or more than or equal to 30 samples and we is It 6 will be using the z-table as our critical or tabular value. If the population variance is unknown, and the number of samples is less than 30, then we will be using t-test or the test statistic follows the Student’s t-distribution with n-1 degrees of freedom which means the tabular value in the Student’s t-table will be used as a critical or tabular value.
  • 4.
  • 5.
    For the givenproblem, the first is the appropriate decision rule because our used 𝐻𝑜 as equality symbol. The decision rule must not ≥ overlap with the null hypothesis. Since the level of significance = 0.05 its 𝛼 tabular value from the z-table is 1.645, the decision rule for the problem could be stated as “Reject Ho if < 0.05 = 1.645. 𝑍𝐶 −𝑍 − Otherwise, we fail to reject Ho.”
  • 6.
    This test procedureis referred to as “one-tail Z-test for the population mean when the population variance is known” and the rejection region is illustrated as follows:
  • 7.
    Compute the valueof the test statistic.
  • 8.
    Hence, the computedtest statistic is.
  • 9.
  • 10.
  • 11.
    Example 2: Whenpopulation variance is unknown. The father of a senior high school student lists down the expenses he will incur when he sends his daughter to the university where he wants her to study. He hypothesizes that the average tuition fee is at least Php20,000 per semester. He knows the variable of interest, which is the tuition fee, is measured at least in the interval scale or specifically in the ratio scale. He assumes that the variable of interest follows the normal distribution but both populations mean, and variance are unknown. The father asks, at random, 25 students at the university about their tuition fee per semester. He is able to get an average of Php20,050 with a standard deviation of
  • 12.
    Step 1. Formulatethe null and alternative hypotheses.
  • 13.
    Step 2. Identifythe test statistic to use. With the given level of significance and the distribution of the test statistics, state the decision rule and specify the rejection region.
  • 14.
    Decision rule canbe one of the following possibilities:
  • 15.
    This test procedureis referred to as “one-tailed t-test for the population mean when the population variance is unknown” and the rejection region is illustrated as follows:
  • 16.
    Step 3. Computethe value of the test statistic.
  • 17.
    Step 4. Makea decision rule.
  • 18.
    Step 5. Statethe conclusion. Lastly, as a consequence of the decision, conclusions are made which are in relation to the purpose of the test of hypothesis. We will acceptance the null hypothesis. Conclusion: Therefore, the father can say that the average tuition fee in the university where he wants his daughter to study is at least Php20,000.
  • 19.
    Example 3. WhenCentral Limit Theorem is used. The father of a senior high school student lists down the expenses he will incur when he sends his daughter to the university, where he wanted her to study. He hypothesizes that the average tuition fee is at least Php20,000 per semester. He knows the variable of interest, which is the tuition fee, is measured at least in the interval scale or specifically in the ratio scale. He assumes that the variable of interest follows a distribution with unknown population mean and variance. The father asks, at random, 36 students at the university about their tuition fee per semester. He is able to get an average of PhP20,200 with a standard deviation of 400 pesos. Suppose the level of
  • 20.
    Step 1. Formulatethe null and alternative hypotheses.
  • 21.
    Step 2. Identifythe test statistic to use. With the given level of significance and the distribution of the test statistics, state the decision rule and specify the rejection region.
  • 22.
  • 23.
    This test procedureis referred to as “one- tailed t-test for the population mean when the population variance is unknown” and the rejection region is illustrated as follows:
  • 24.
    Step 3. Computethe value of the test statistic.
  • 25.
    Step 4. Makea decision rule
  • 26.
    Step 5. Statethe conclusion. Lastly, as a consequence of the decision, conclusions are made which are in relation to the purpose of the test of hypothesis. With the rejection of the null hypothesis, we will accept the alternative hypothesis. 12 Conclusion: Therefore, the father can say that the average tuition fee in the university where he wanted his daughter to study is less than Php20,000.
  • 27.
    Note: One-tailed andTwo-tailed tests. Testing of hypothesis is an investigation on some prevailing belief against what the researcher believes. If the researcher is investigating to check if what he/she believes is better than the prevailing belief, then the test is known as one-tailed test. On the other hand, if the researcher is not interested in comparing the parameters, the tests is called a two-tailed test. The test is one-tailed when the inequality symbol being used for alternative hypothesis is < or >, while it is a two-tailed test when the inequality symbol used is ≠.
  • 28.
    A. Complete thesentence by filling in the blanks with the correct term/value. 1. __________________ is made as a consequence of decision. 2. One of the decision rules is “reject the null hypothesis ( ) if < . Otherwise, we 𝐻𝑜 𝑡𝐶 −𝑡𝛼 ____________to reject .” 𝐻𝑜 3. If we reject the null hypothesis, then we will ____________ the alternative hypothesis. 4. Z-test will be used when the population variance is __________ and the number of samples is 30. ≥ 5. T-test will be used when the population variance is ___________ and the number of samples is < 30. 6. In computing the test statistic using t-test we use the tabular value from _______________________ table. 7. In computing the test statistic using z-test we use the tabular value from __________ table.
  • 29.
    Assignment: Conduct thetest of hypothesis using the appropriate components of the test procedure of the given real-life problem. The minimum wage earners of the National Capital Region are believed to be receiving less than Php500 per day. The CEO of a large supermarket chain in the region is claiming to be paying its contractual higher than the minimum daily wage rate of Php500. To check on this claim, a labor union leader obtained a random sample of 144 contractual employees from this supermarket chain. The survey of their daily wage earnings resulted to an average wage of Php510 per day with standard deviation of Php100. The daily wage of the region is assumed to follow a distribution with an unknown population variance. Perform a test of hypothesis at 5% level of significance to help the labor union leader make an empirical based conclusion on the CEO’s claim.