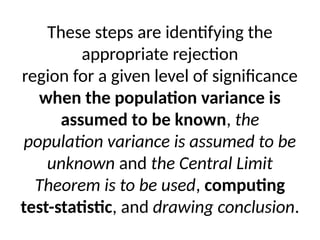
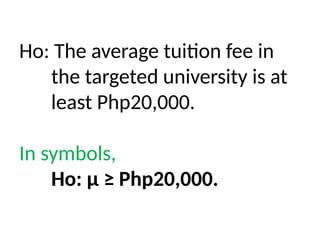
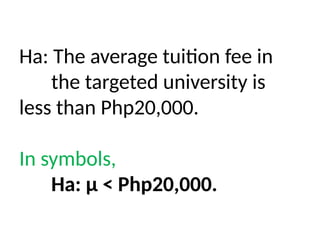
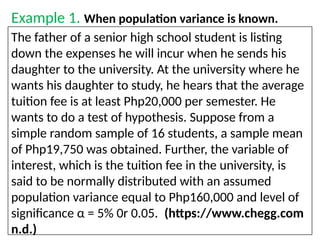
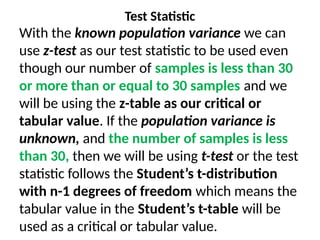
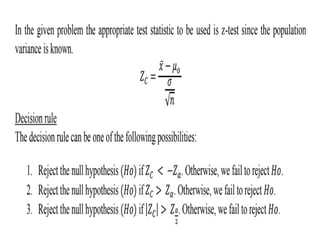
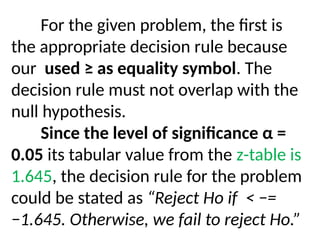
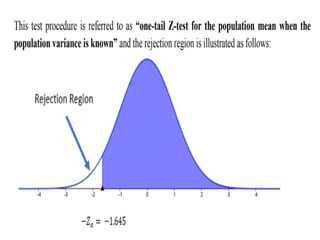
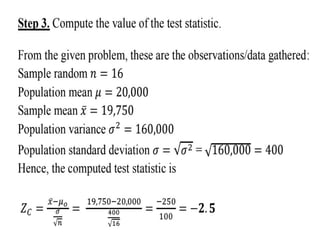
Identifying
Rejection Region
and
Hypothesis Testing
on Population Mean
REVIEW
Recall the steps of hypothesis testing
procedure in the previous lesson.
List the steps of hypothesis testing.
LEARNING TASK 1:
Given the real-life problem, formulate the
appropriate null and alternative
hypotheses.
The father of a senior high school student is
listing down the expenses he will incur when
he sends his daughter to the university. At
the university where he wants his daughter
to study, he hears that the average tuition
fee is at least Php20,000 per semester. He
wants to do a test of hypothesis.
LEARNING TASK 2:
In this lesson, you will continue to
learn about hypothesis testing. You
will learn the remaining steps in
hypothesis testing.
These steps are identifying the
appropriate rejection
region for a given level of significance
when the population variance is
assumed to be known, the
population variance is assumed to be
unknown and the Central Limit
Theorem is to be used, computing
test-statistic, and drawing conclusion.
Let us consider the situation in
Learning Task 2.
Check your formulated hypotheses
and compare whether they are the
same or not.
Ho: The average tuition fee in
the targeted university is at
least Php20,000.
In symbols,
Ho: μ ≥ Php20,000.
Ha: The average tuition fee in
the targeted university is
less than Php20,000.
In symbols,
Ha: μ < Php20,000.
Example 1. When population variance is known.
The father of a senior high school student is listing
down the expenses he will incur when he sends his
daughter to the university. At the university where he
wants his daughter to study, he hears that the average
tuition fee is at least Php20,000 per semester. He
wants to do a test of hypothesis. Suppose from a
simple random sample of 16 students, a sample mean
of Php19,750 was obtained. Further, the variable of
interest, which is the tuition fee in the university, is
said to be normally distributed with an assumed
population variance equal to Php160,000 and level of
significance α = 5% 0r 0.05. (https://www.chegg.com
n.d.)
Step 1. We are done formulating
the null and alternative
hypotheses.
Step 2. Identify the test statistic to
use. With the given level of
significance and the distribution of
the test statistics, state the
decision rule and specify the
rejection region.
What will be the
appropriate test statistic
to be used?
Test Statistic
With the known population variance we can
use z-test as our test statistic to be used even
though our number of samples is less than 30
or more than or equal to 30 samples and we
will be using the z-table as our critical or
tabular value. If the population variance is
unknown, and the number of samples is less
than 30, then we will be using t-test or the test
statistic follows the Student’s t-distribution
with n-1 degrees of freedom which means the
tabular value in the Student’s t-table will be
used as a critical or tabular value.
For the given problem, the first is
the appropriate decision rule because
our used ≥ as equality symbol. The
decision rule must not overlap with the
null hypothesis.
Since the level of significance α =
0.05 its tabular value from the z-table is
1.645, the decision rule for the problem
could be stated as “Reject Ho if < −=
−1.645. Otherwise, we fail to reject Ho.”
statitics-Identifying rejection region.pptx

statitics-Identifying rejection region.pptx

  • 1.
  • 2.
    REVIEW Recall the stepsof hypothesis testing procedure in the previous lesson. List the steps of hypothesis testing. LEARNING TASK 1:
  • 3.
    Given the real-lifeproblem, formulate the appropriate null and alternative hypotheses. The father of a senior high school student is listing down the expenses he will incur when he sends his daughter to the university. At the university where he wants his daughter to study, he hears that the average tuition fee is at least Php20,000 per semester. He wants to do a test of hypothesis. LEARNING TASK 2:
  • 4.
    In this lesson,you will continue to learn about hypothesis testing. You will learn the remaining steps in hypothesis testing.
  • 5.
    These steps areidentifying the appropriate rejection region for a given level of significance when the population variance is assumed to be known, the population variance is assumed to be unknown and the Central Limit Theorem is to be used, computing test-statistic, and drawing conclusion.
  • 6.
    Let us considerthe situation in Learning Task 2. Check your formulated hypotheses and compare whether they are the same or not.
  • 7.
    Ho: The averagetuition fee in the targeted university is at least Php20,000. In symbols, Ho: μ ≥ Php20,000.
  • 8.
    Ha: The averagetuition fee in the targeted university is less than Php20,000. In symbols, Ha: μ < Php20,000.
  • 9.
    Example 1. Whenpopulation variance is known. The father of a senior high school student is listing down the expenses he will incur when he sends his daughter to the university. At the university where he wants his daughter to study, he hears that the average tuition fee is at least Php20,000 per semester. He wants to do a test of hypothesis. Suppose from a simple random sample of 16 students, a sample mean of Php19,750 was obtained. Further, the variable of interest, which is the tuition fee in the university, is said to be normally distributed with an assumed population variance equal to Php160,000 and level of significance α = 5% 0r 0.05. (https://www.chegg.com n.d.)
  • 10.
    Step 1. Weare done formulating the null and alternative hypotheses. Step 2. Identify the test statistic to use. With the given level of significance and the distribution of the test statistics, state the decision rule and specify the rejection region.
  • 11.
    What will bethe appropriate test statistic to be used?
  • 12.
    Test Statistic With theknown population variance we can use z-test as our test statistic to be used even though our number of samples is less than 30 or more than or equal to 30 samples and we will be using the z-table as our critical or tabular value. If the population variance is unknown, and the number of samples is less than 30, then we will be using t-test or the test statistic follows the Student’s t-distribution with n-1 degrees of freedom which means the tabular value in the Student’s t-table will be used as a critical or tabular value.
  • 14.
    For the givenproblem, the first is the appropriate decision rule because our used ≥ as equality symbol. The decision rule must not overlap with the null hypothesis. Since the level of significance α = 0.05 its tabular value from the z-table is 1.645, the decision rule for the problem could be stated as “Reject Ho if < −= −1.645. Otherwise, we fail to reject Ho.”