Downloaded 331 times


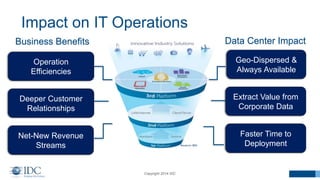

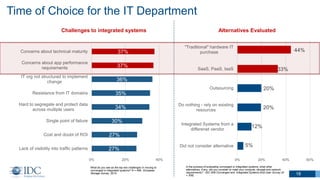
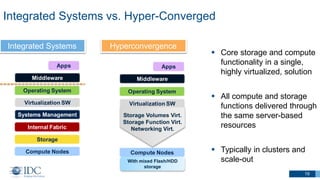

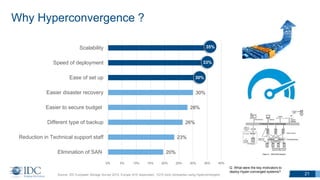
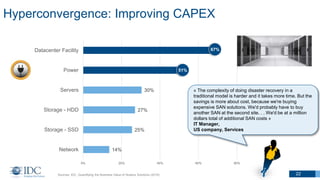


The document discusses the evolving state of datacenters, emphasizing the impact of hyperconvergence on operational efficiency and the growing importance of integrated systems. Key drivers for change include the increasing demand for scalability, reduced costs, and simplified deployment processes, as well as evolving data management practices. It highlights customer experiences, market trends, and the necessity for IT departments to adapt to this new wave of technological convergence.


