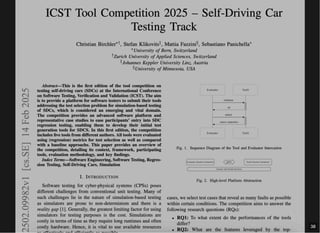
ICST Tool Competition 2025 Self-driving Car Testing Track
1.
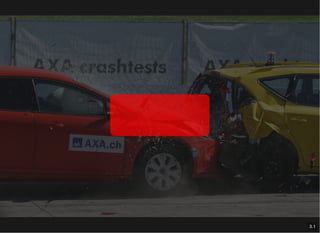
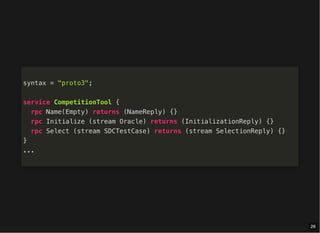
ICST TOOL COMPETITION:SELF-DRIVING
CAR TESTING
Christian Birchler
University of Bern
Zurich University of Applied Sciences
Switzerland
Stefan Klikovits
Johannes Keppler University Linz
Austria
Mattia Fazzini
University of Minnesota
USA
Sebastiano Panichella
University of Bern
Switzerland
1
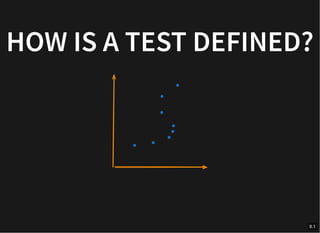
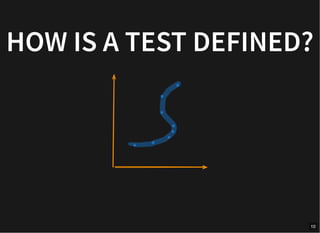
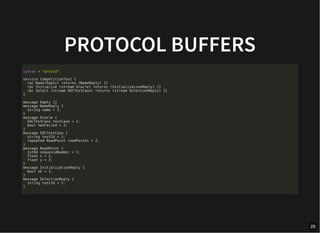
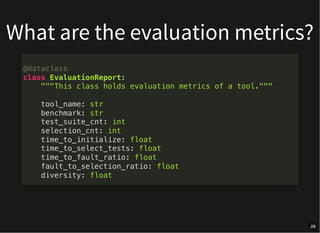
What are theevaluation metrics?
@dataclass
class EvaluationReport:
"""This class holds evaluation metrics of a tool."""
tool_name: str
benchmark: str
test_suite_cnt: int
selection_cnt: int
time_to_initialize: float
time_to_select_tests: float
time_to_fault_ratio: float
fault_to_selection_ratio: float
diversity: float
28
EXPERIMENTS
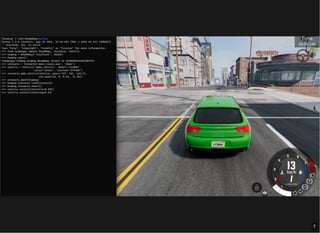
The experiments areconducted on an Open Stack
virtual machine (VM) with 16GB of RAM, eight virtual
CPUs, and an Nvidia Tesla T4 GPU.
30
47.
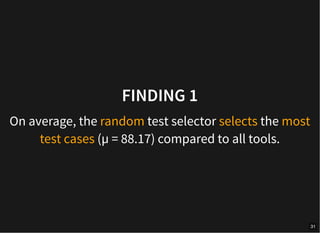
FINDING 1
On average,the random test selector selects the most
test cases (µ = 88.17) compared to all tools.
31
48.
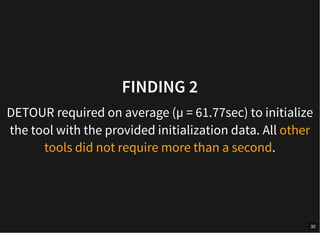
FINDING 2
DETOUR requiredon average (µ = 61.77sec) to initialize
the tool with the provided initialization data. All other
tools did not require more than a second.
32
49.
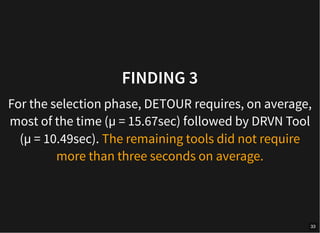
FINDING 3
For theselection phase, DETOUR requires, on average,
most of the time (µ = 15.67sec) followed by DRVN Tool
(µ = 10.49sec). The remaining tools did not require
more than three seconds on average.
33
50.
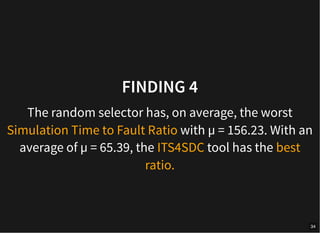
FINDING 4
The randomselector has, on average, the worst
Simulation Time to Fault Ratio with µ = 156.23. With an
average of µ = 65.39, the ITS4SDC tool has the best
ratio.
34
51.
FINDING 5
The ITS4SDCtool has, on average, the best Fault to
Selection Ratio (µ = 0.8) and the random baseline the
worst with µ = 0.38.
35
52.
FINDING 6
There isno clear indication that the diversity metric
differs among all tools.
36