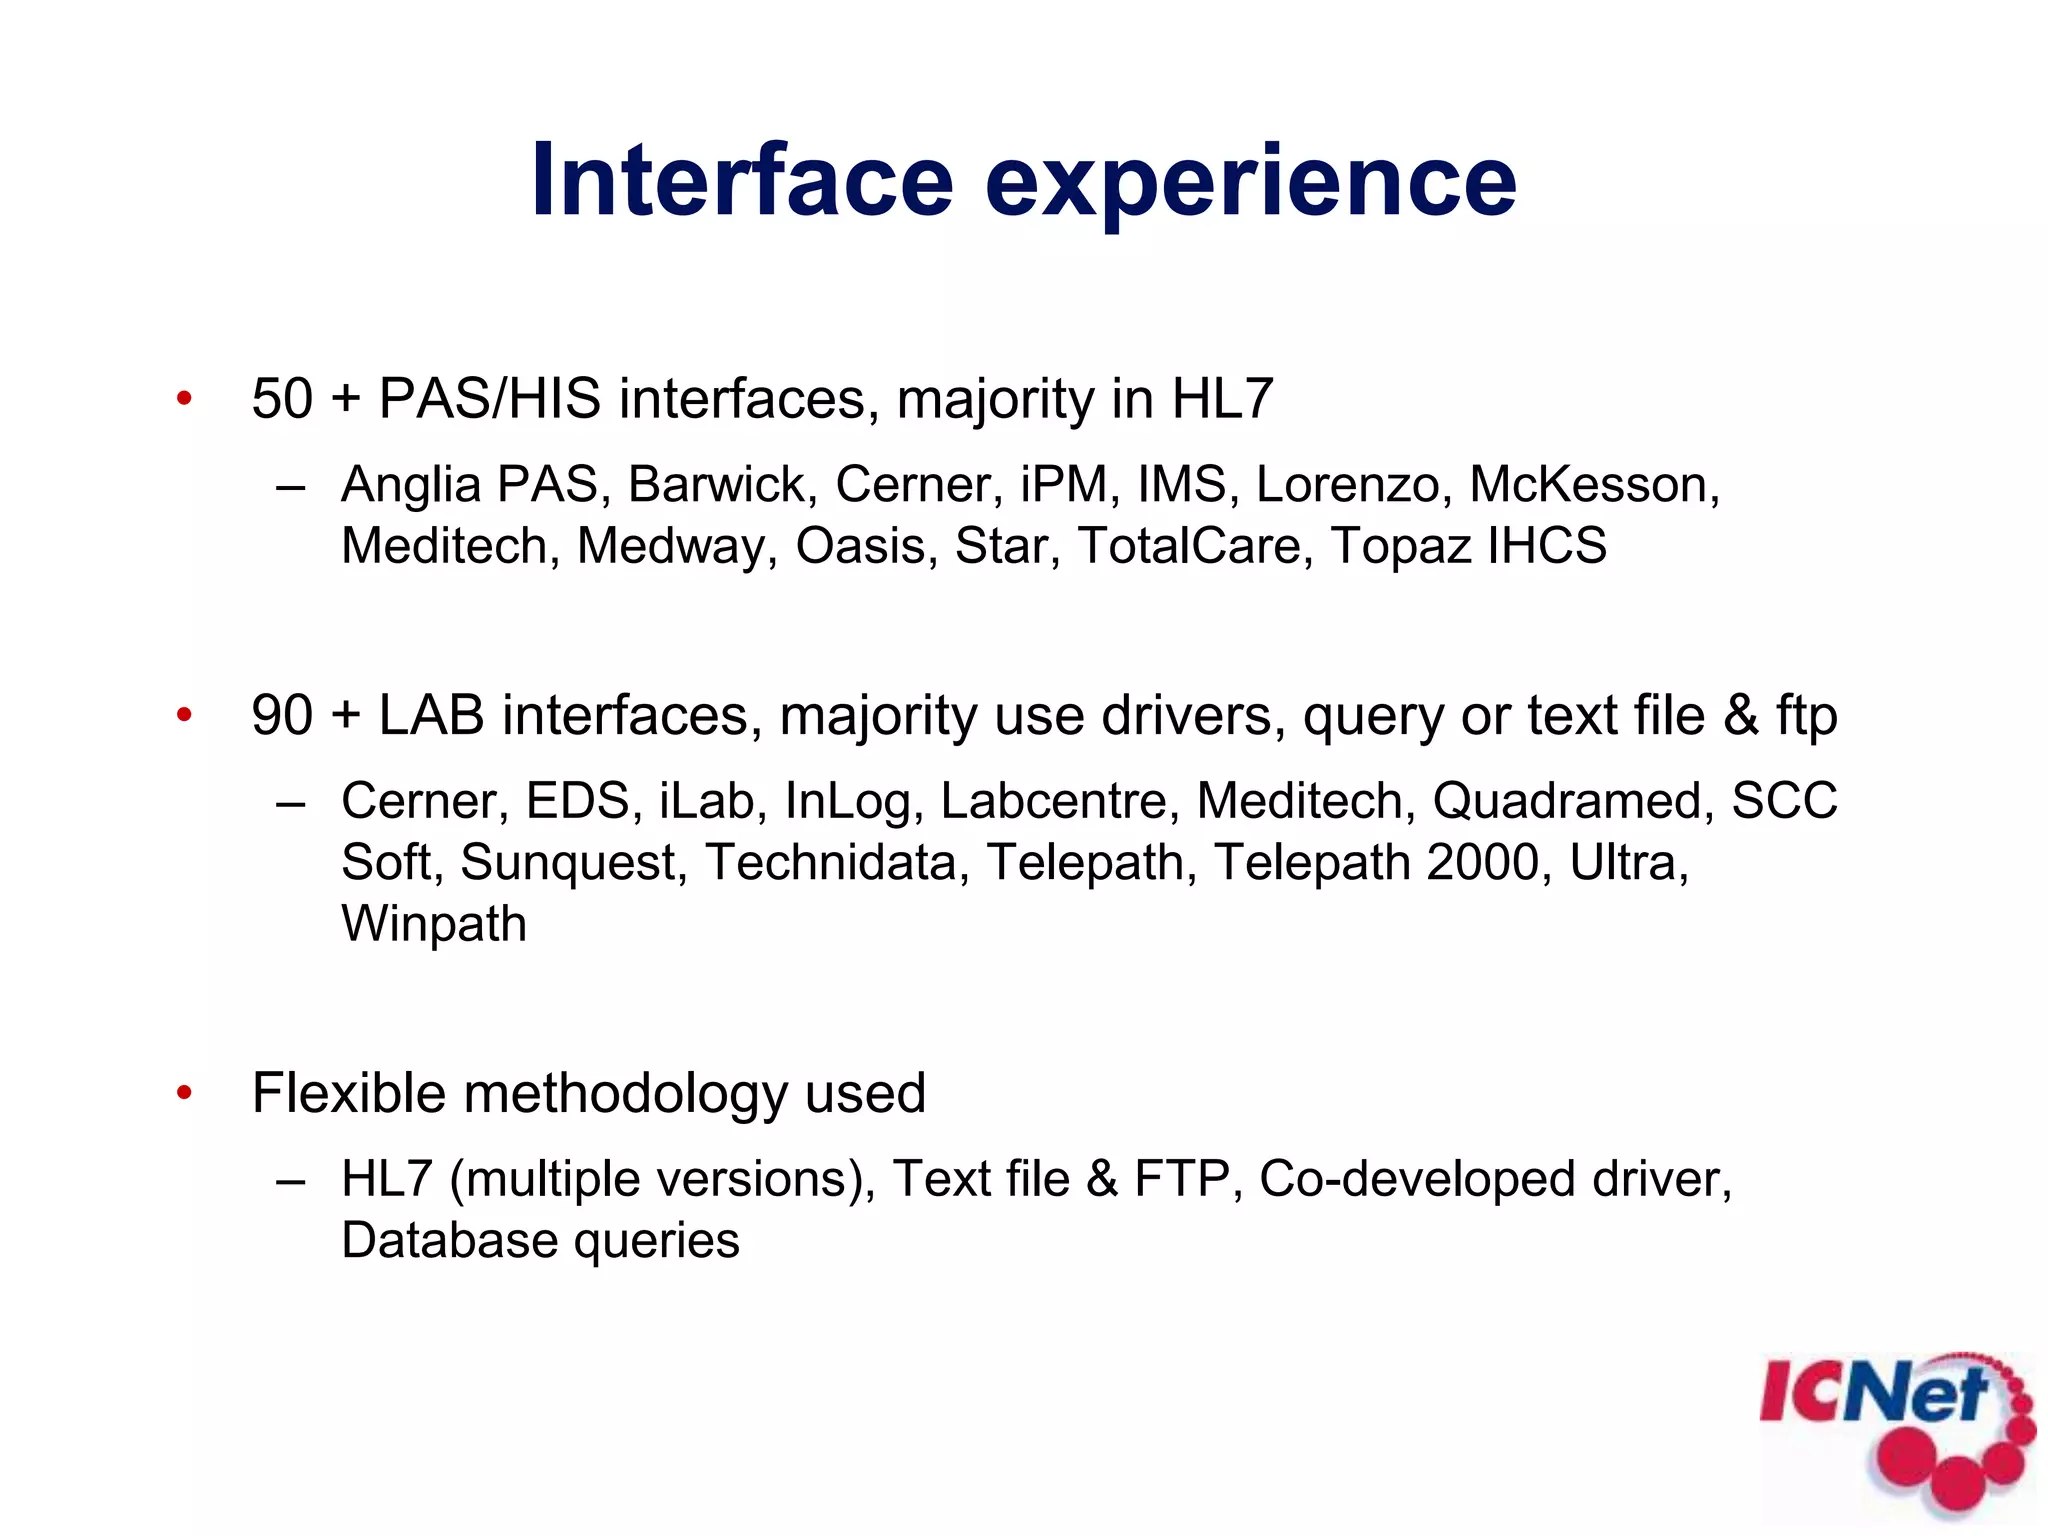
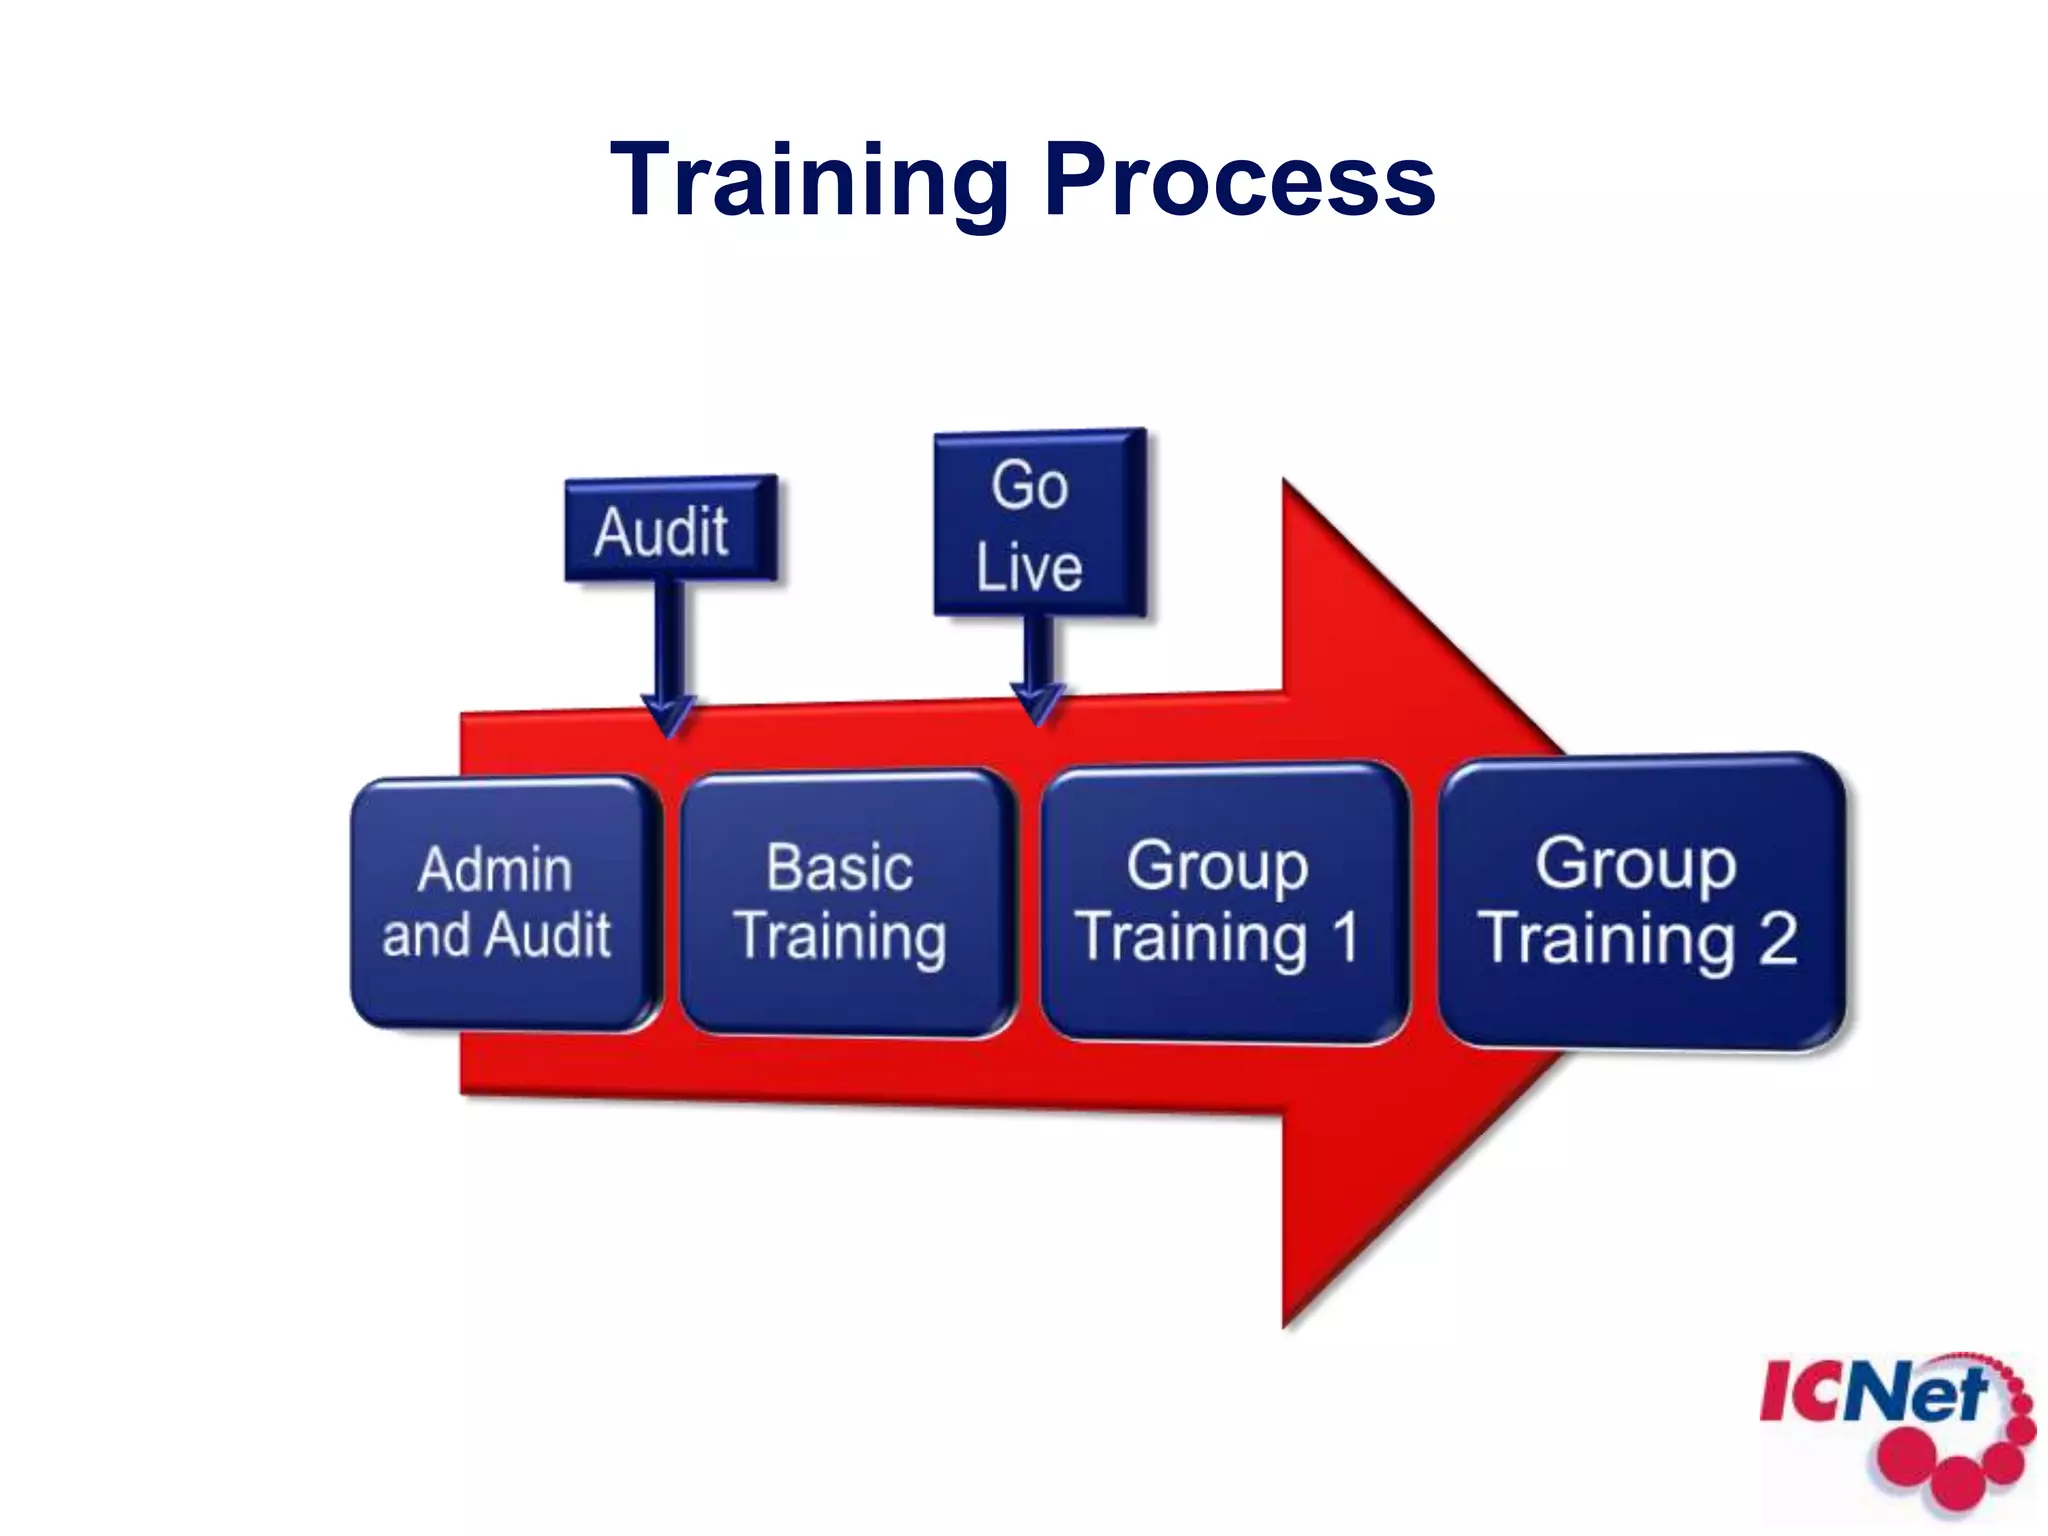
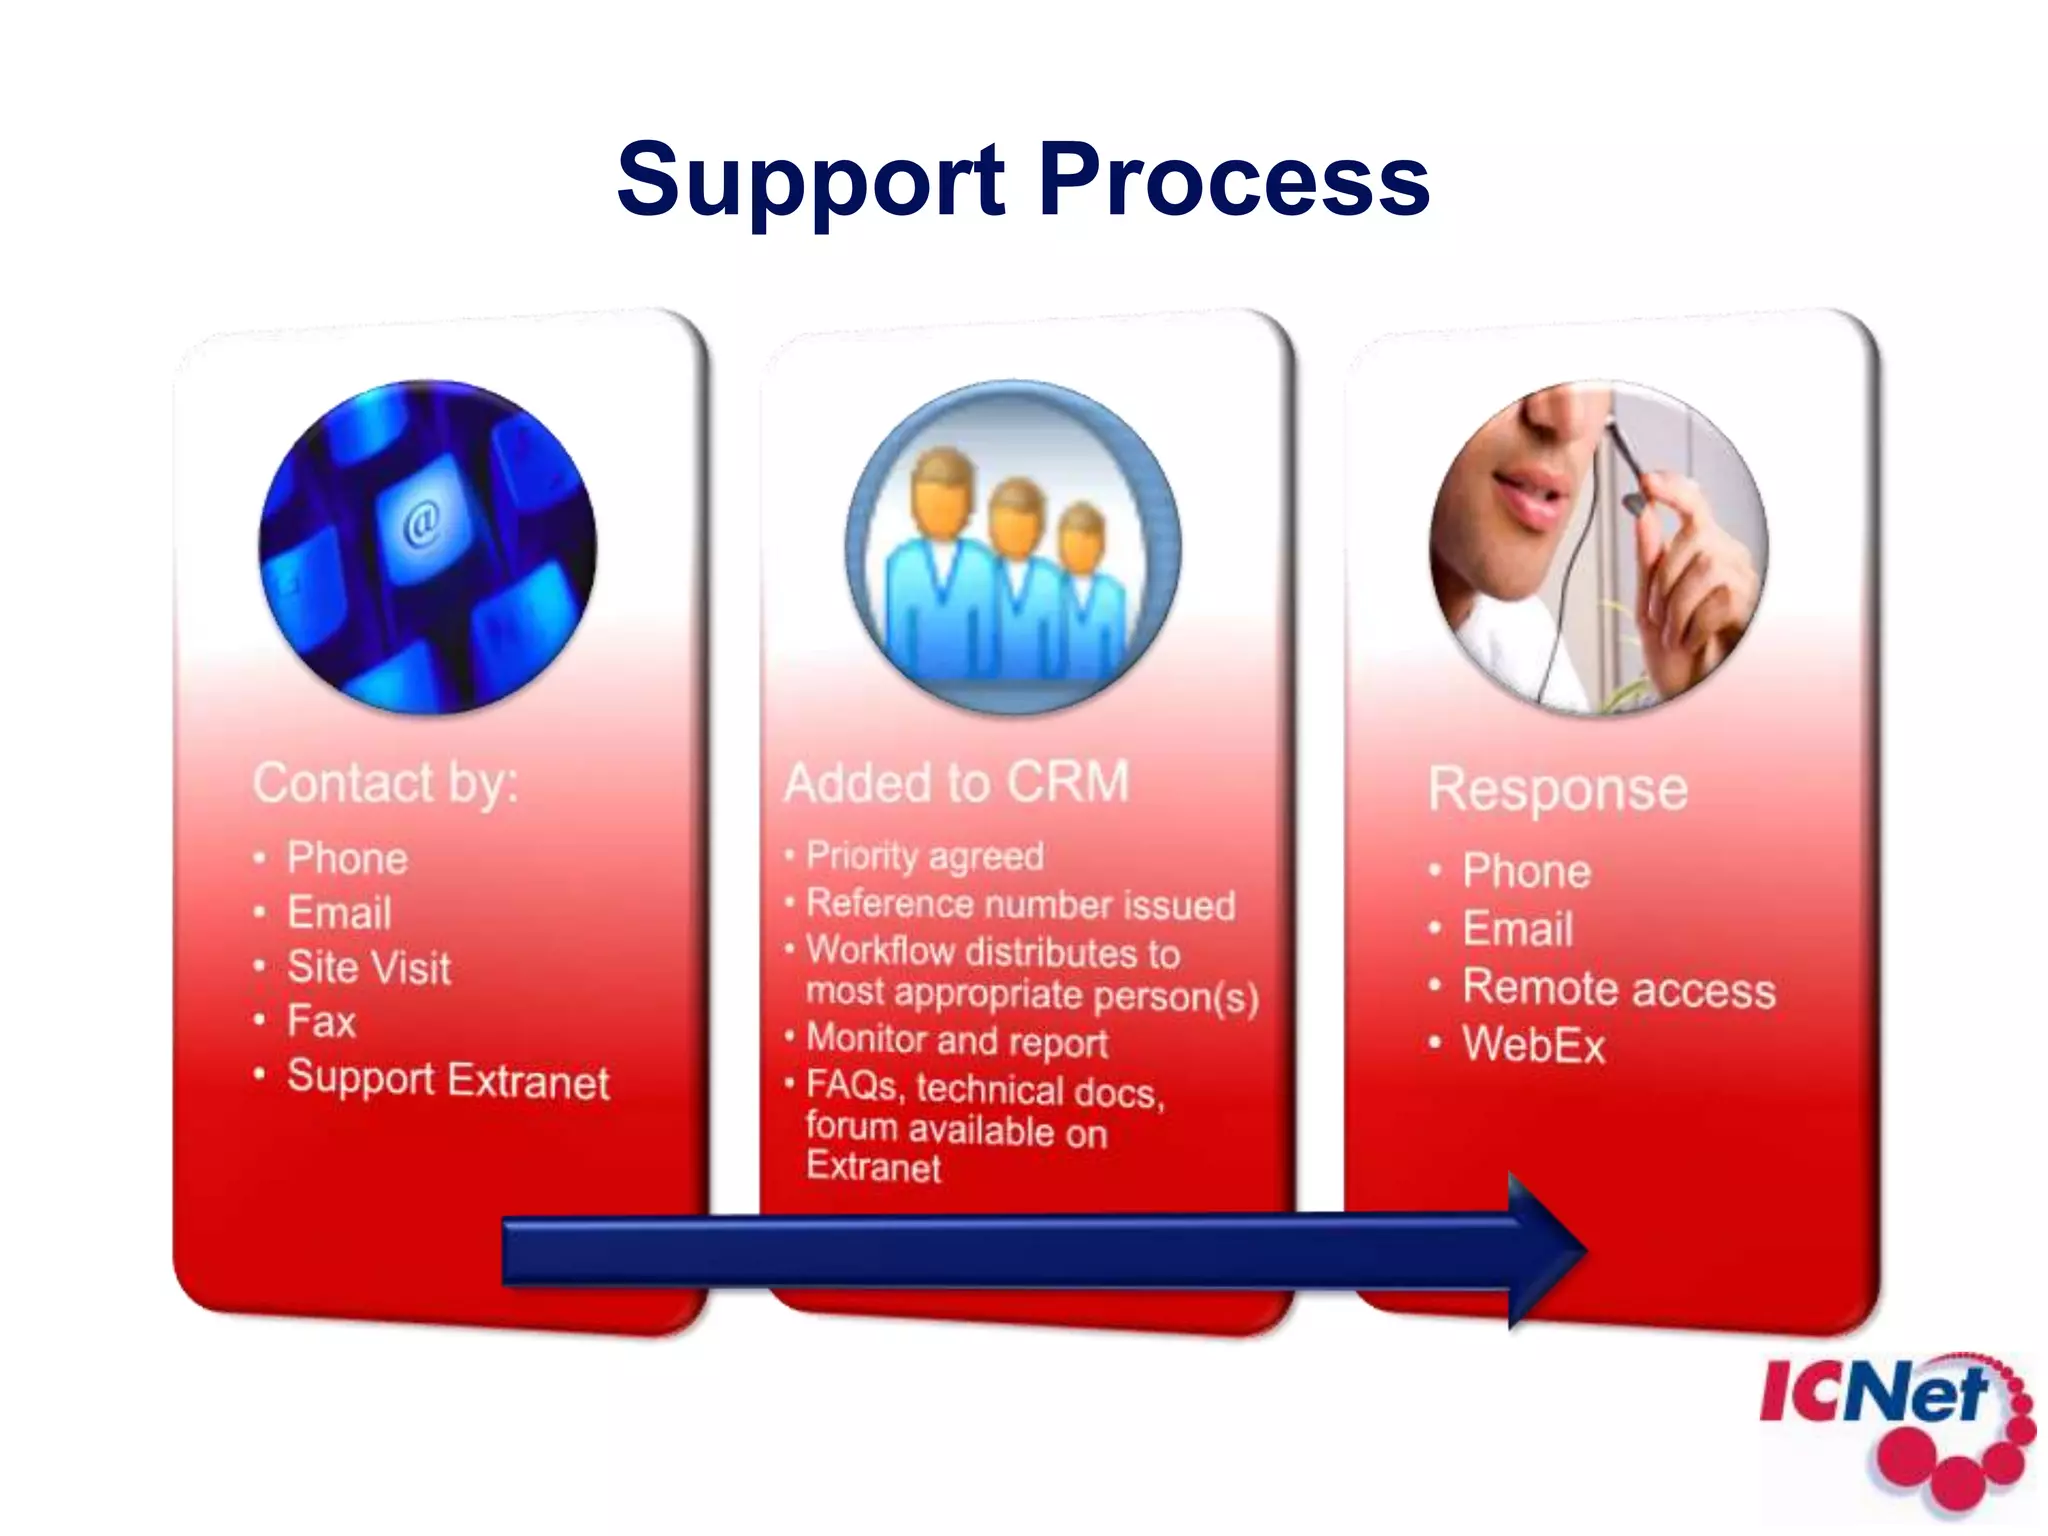
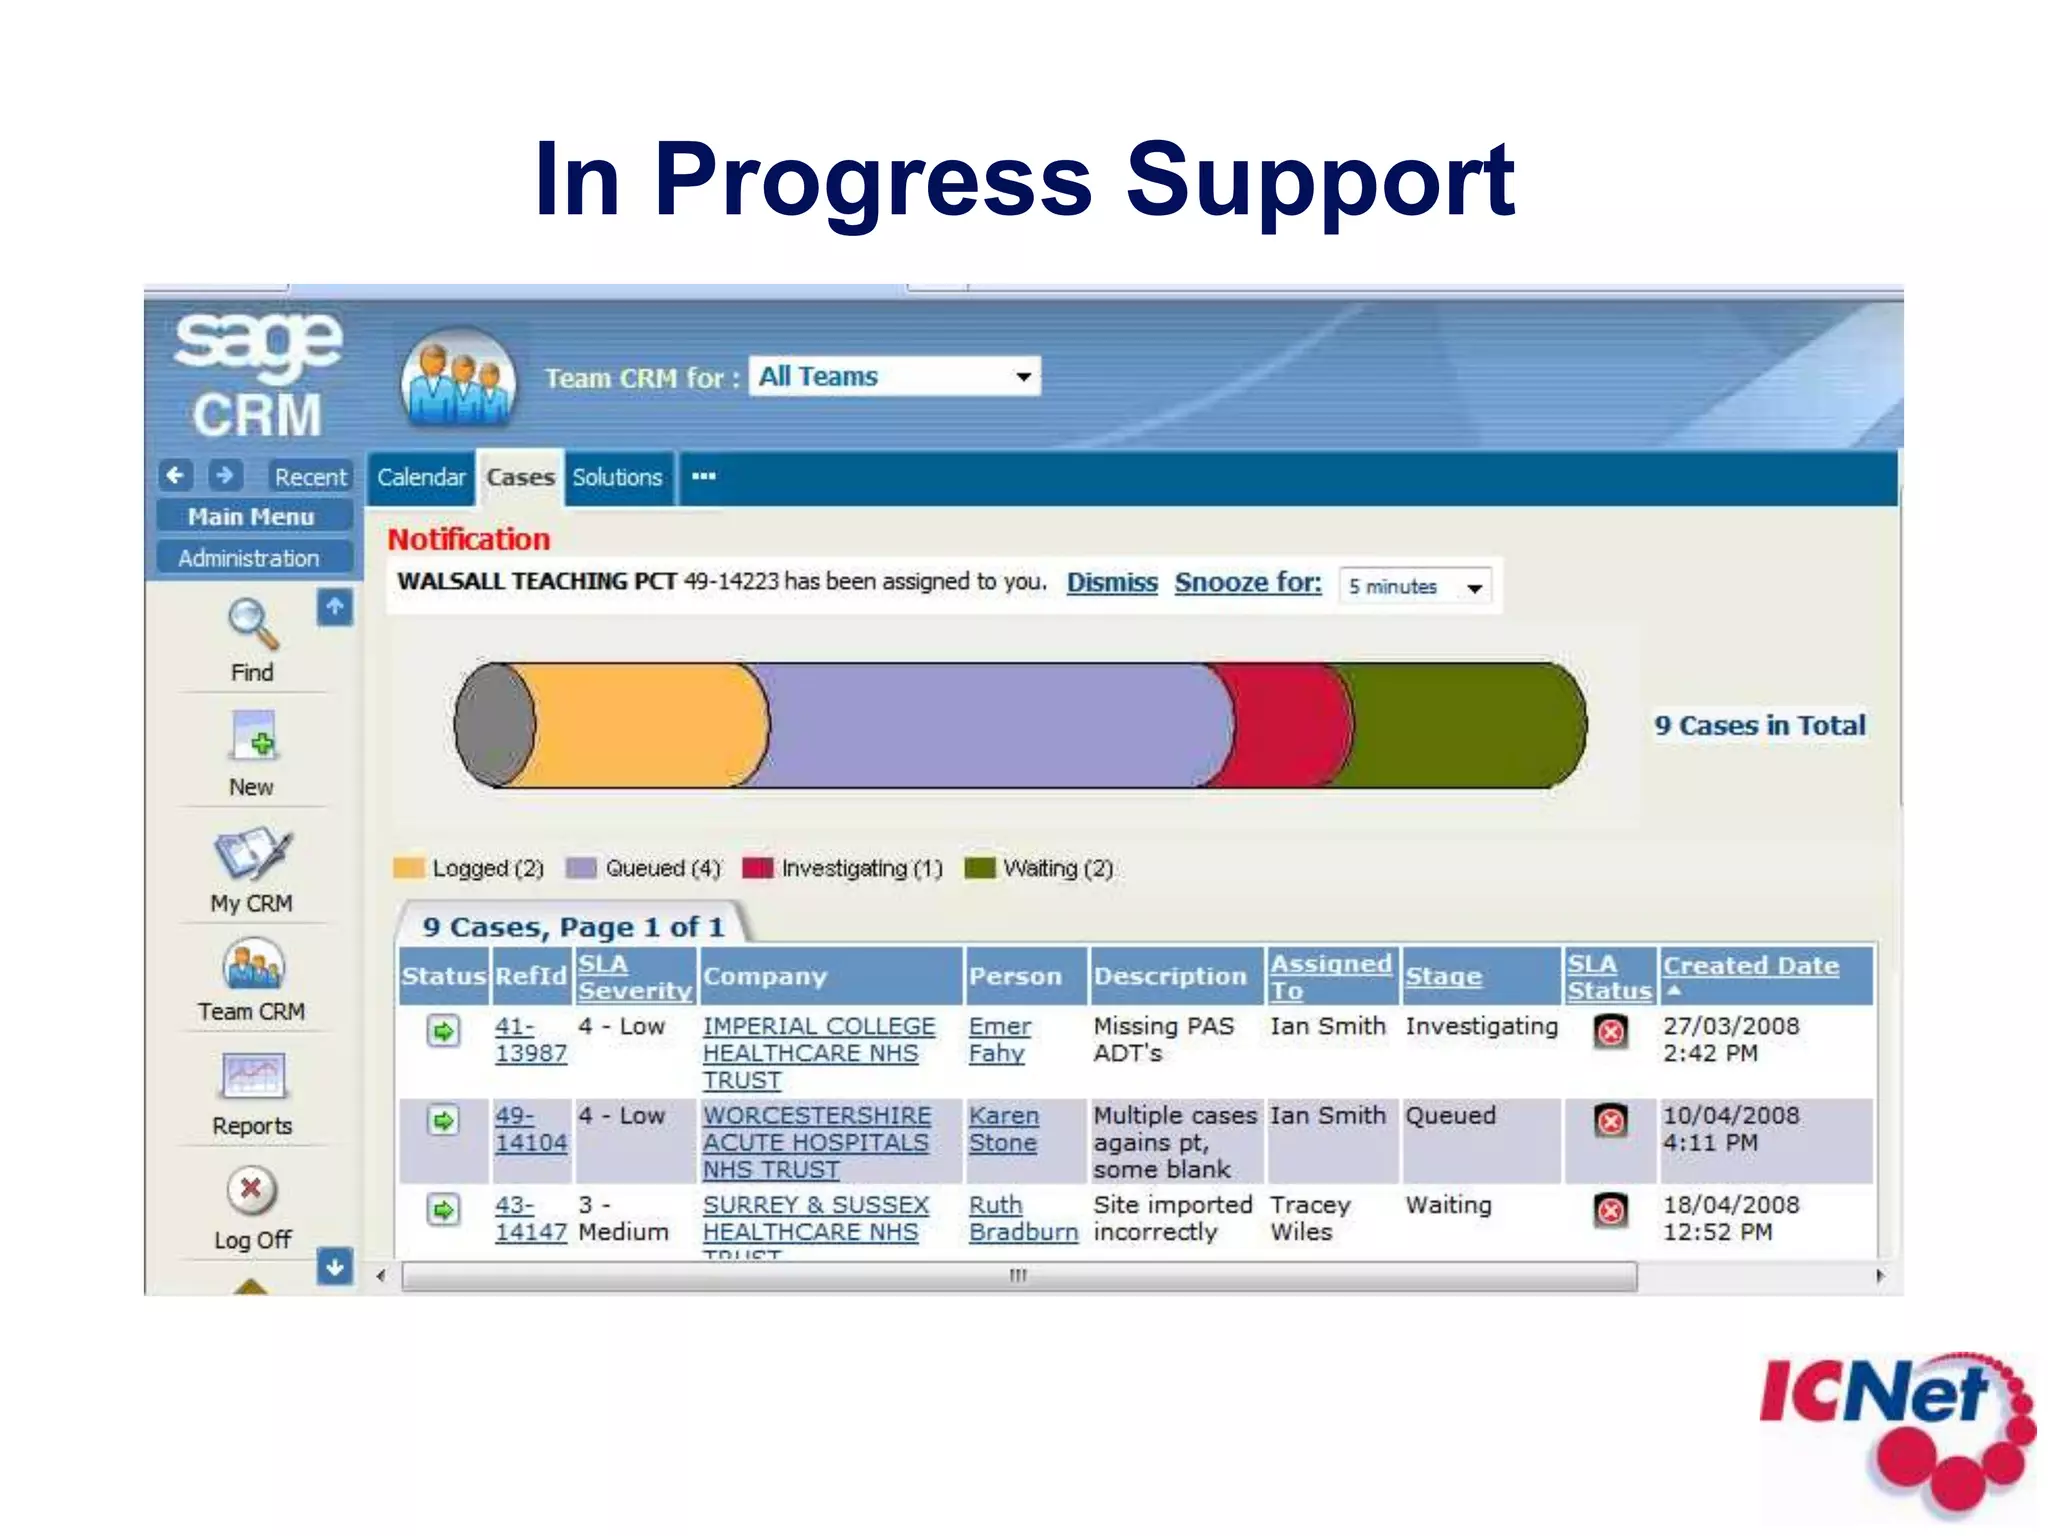
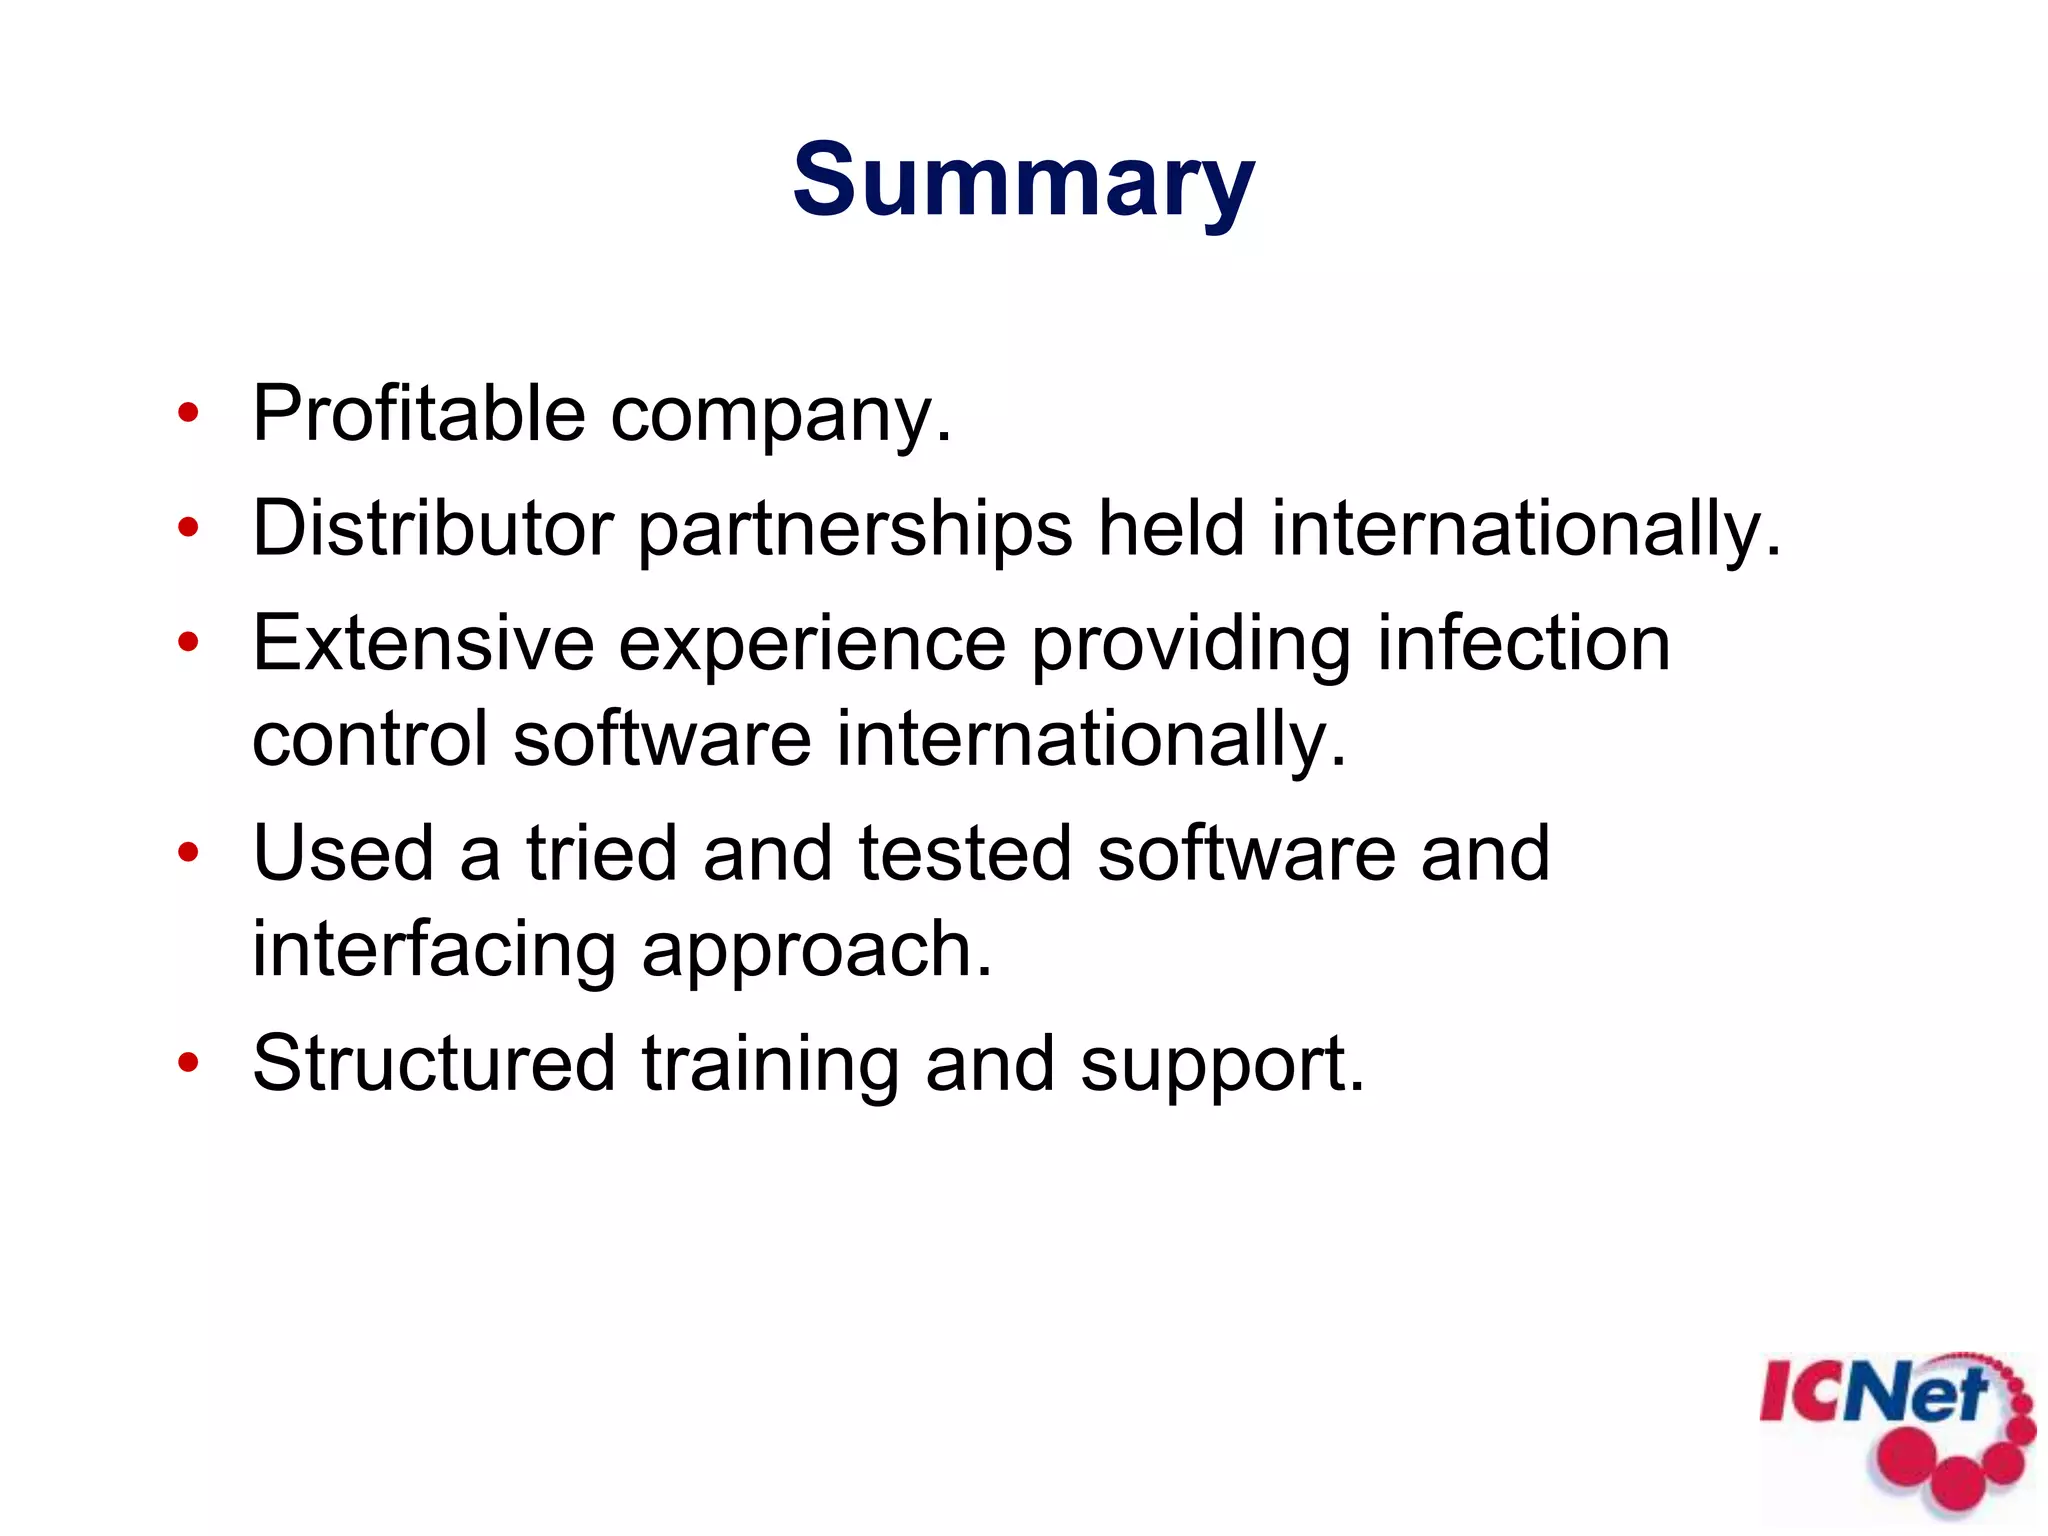
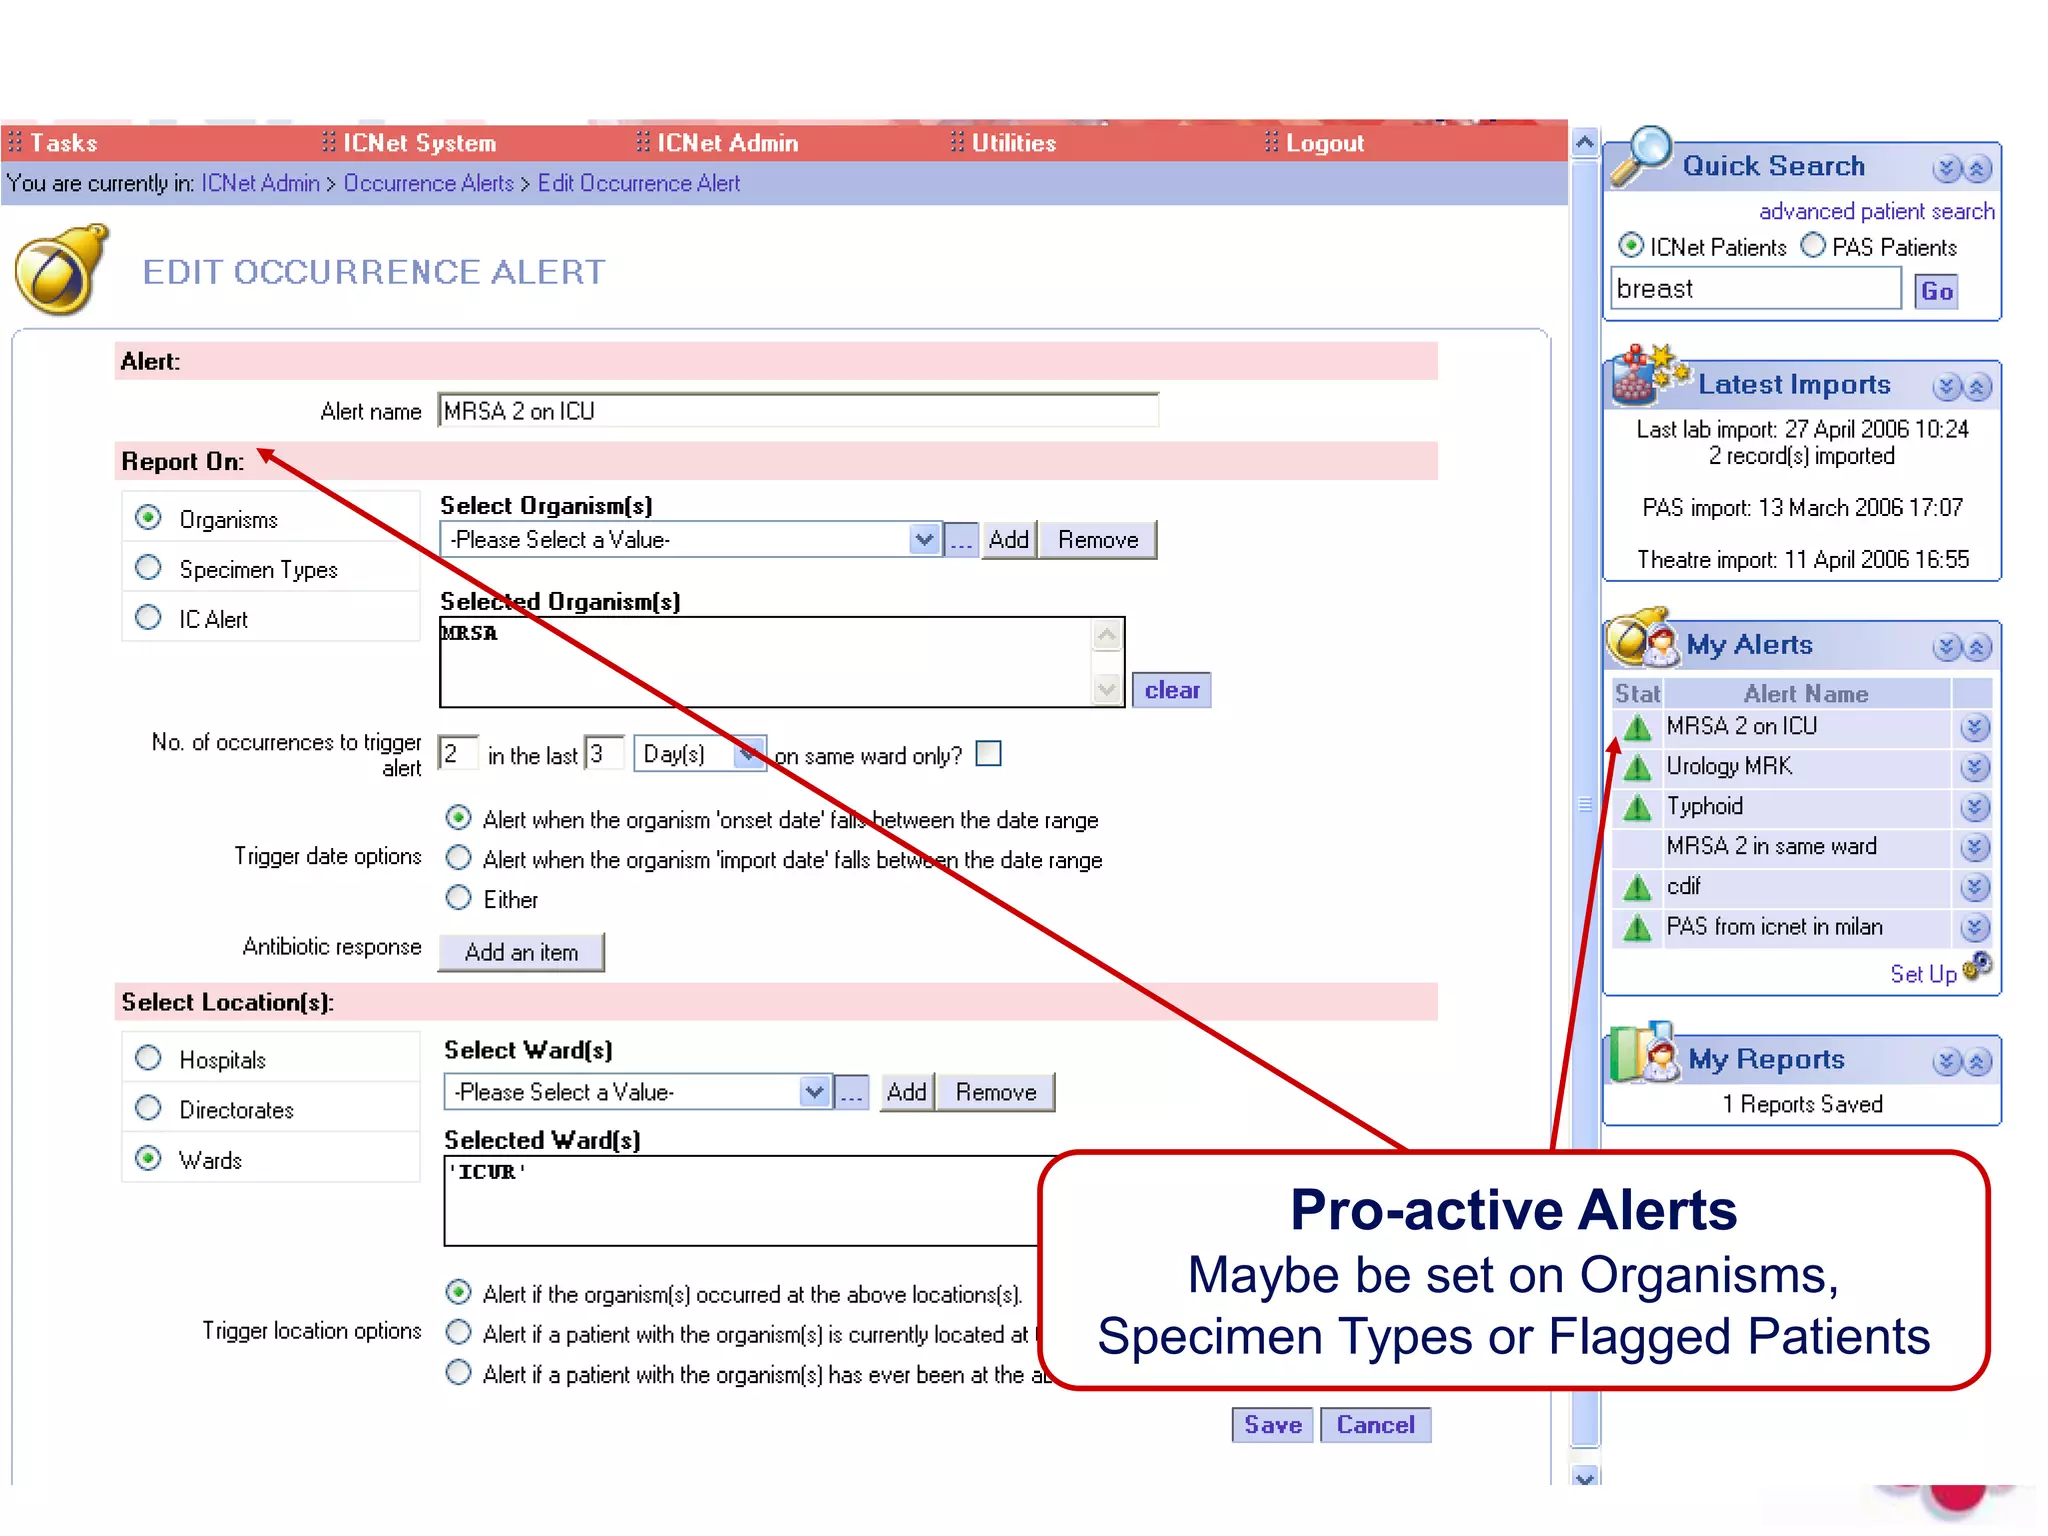
ICNet Infection Case Management & Surveillance Software
AgendaCompany Overview.Why have automated HAI surveillance?Key ICNet features.Clients and references.Technical (interfacing) Experience.Helpdesk, Support and Maintenance.
ICNet Company OverviewInternational HQ in UK, USA HQ in Nashville, TN.Strong financials: UK £1.6m turnover & highly profitable.Leading provider of Infection control software.Privately owned, with 20 staff.Over 90 UK NHS Trust clients.International clients: USA, France, South Africa, Malaysia and Thailand.Overseas distributors, including bioMérieux Inc. for USA.
Why have ICNet & AbxAlert?Assists in pro-active identification of potential CMS payment denial cases. Proactive versus reactive approach.Statistical process charts measure success of process change initiatives designed to reduce HAI’s.Efficiently addresses mandatory reporting.Meaningful feedback to clinicians / administration.Functionally rich Antibiotic Stewardship.More efficient use of Infection Preventionist time.Configurable for early and complete detection of HAI’s and untoward incidents.
Key ICNet FeaturesWeb-based.Real-time surveillance.Proactive alerts and functionally rich.Doesn’t require end-user IT expertise.Easy to navigate and simple to use.Hospital controlled data – data never goes outside hospital firewall.Robust, customizable reporting.
ICNet Product StrengthsDesigned to meet International requirements: NHSN, SSISS & HPA reporting, terminology, date formats.Ad-hoc infection reporting including:institutional anti-biogramcontact tracingstatistical process chartsDrug utilisationInternational implementation and support team.Real time interfacing for location tracking and antibiotic stewardship.Web based using intranet technology.Tried and tested international solution.
North Middlesex University Hospital NHS Trust Plymouth Hospitals NHS Trust Royal Liverpool & Broadgreen University Hospitals NHST Royal Devon & Exeter NHS Foundation Trust Royal Brompton & Harefield NHS TrustUniversity Health System University Hospital of North Staffordshire NHS Trust University Hospital of South Manchester NHS Foundation Trust University Hospitals Bristol NHS Foundation Trust University Hospitals Coventry & Warwickshire NHS Trust West Middlesex University Hospital NHS Trust Whipps Cross University Hospital NHS Trust Extract from UK Teaching Hospital Client List
Extract from UK Teaching Hospital Client ListBradford Teaching Hospitals NHS Foundation TrustCentral Manchester & Manchester Childs University Hospital NHSFT Christie Hospital NHS Foundation Trust Derby Hospitals NHS Foundation Trust Homerton University Hospital NHS Foundation Trust Imperial College Healthcare NHS Trust Lancashire Teaching Hospital NHS foundation Trust Leeds Teaching Hospitals NHS Trust NHS Lothian (Edinburgh)NHS Grampian (Aberdeen)NHS Tayside (Dundee)Norfolk & Norwich University Hospital NHSFT
International ClientsMediclinic Group (50 hospitals), South AfricaUniversity Health System, San Antonio, TexasSelayang University Hospital, Selangor, MalaysiaMontsouris Hospital, Paris, France
Interface experience50 + PAS/HIS interfaces, majority in HL7Anglia PAS, Barwick, Cerner, iPM, IMS, Lorenzo, McKesson, Meditech, Medway, Oasis, Star, TotalCare, Topaz IHCS 90 + LAB interfaces, majority use drivers, query or text file & ftpCerner, EDS, iLab, InLog, Labcentre, Meditech, Quadramed, SCC Soft, Sunquest, Technidata, Telepath, Telepath 2000, Ultra, Winpath Flexible methodology usedHL7 (multiple versions), Text file & FTP, Co-developed driver, Database queries
Training ProcessGo LiveAudit
Support Process
In Progress Support
SummaryProfitable company.Distributor partnerships held internationally.Extensive experience providing infection control software internationally.Used a tried and tested software and interfacing approach.Structured training and support.
Presented by:Katie HoughtonManaging Director, ICNet Limited Email: katie.hougton@icnetplc.comWebsite: www.icnetplc.com
Additional ICNet Screenshots
Main ICNet Log-in Screen
Main ICNet Screen OverviewMain Navigation BarPatient DemographicsPatient Record: Case Details, Alert Organism, Alert Condition, Notes, ADT HistoryPatient Search Simple & AdvancedImported DataUser Defined AlertsUser Defined Reports
Case overview in the CenterLaboratory Latest import list, Alerts and Reports to the right.
Organism Screen:  Alert Organisms, Organism Antibiotic Sensitivity & Specimen DetailsAlert OrganismsOrganism Antibiotic SensitivitySpecimen Details
Alert Conditions & Associated FeaturesRecord of Alert ConditionsRecord of Associated Features
Case Note & Patient Note FieldsCase Note FieldPatient Note Field
Alert Set Up ScreenPro-active AlertsMaybe be set on Organisms, Specimen Types or Flagged Patients
Bacteremia ReportLine based report which may be viewed on screen or printedSearches on organism, associated features / antibiotic sensitivities, specimen typesCounts based on specimen, patients or specimens separated by a user definable number of daysData can be reviewed from a specific hospital, directorate, unit, consultant or specialitySearches done between dates
Bacteremia Report
Organism / Condition Comparison GraphBar graph report, comparing different organism, associated features / antibiotic sensitivities, specimen types or comparing conditions.
Counts based on specimen, patients or  specimens separated by a user definable number of days.
All comparisons are based on data from a single hospital, directorate, unit, consultant or speciality.Searches are based on data between set dates.Graphs are summarized into days, weeks, months, quarters or years or a total over the time period.
Comparing Organisms from a specific location
Location Comparison GraphBar graph report, viewing a specific organism or condition over multiple locations.Searches on:organism, associated features / antibiotic sensitivities, specimen typesconditionsCounts based on specimen, patients or  specimens separated by a user definable number of days.Comparisons can be based on hospital, directorate, unit, consultant or speciality.Searchers done between dates.Graphs are summarized into days, weeks, months, quarters or years or a total over the time period.Should denominator data be provided, rate reports can be created.
Organism Occurrences Graph Compares Directorates over Date Range
Statistical Process Charts (SPC)Searches on organism, associated features / antibiotic sensitivities, specimen typesConditionsCounts based on specimen, patients or  specimens separated by a user definable number of daysData can be reviewed from a specific hospital, directorate, unit, consultant or specialitySearches done between dates and are summarized by weeks or monthsGraphs are line graphs.Central line, upper control limit (set at 2 deviations above the mean), lower control limit (set at 3 deviations above the mean) are all automatically calculated.Should denominator data be provided, rate reports can be created
Statistical Process Control (SPC)Statistical Process Chart  for Clostridium difficileDemonstrates when upper control limits for the hospital are exceeded
Census ReportReviews all patients who have resided on a specific location during a set time periodIndicates which organisms patients have acquiredEnables review to be filtered to specific locations and specific organisms
Census ReportCensus ReportShows all patients at a location between date range and any infections that occurred thus highlighting potential cross infections
Cross Infection ReportReview the organism or associated feature between a specific time.Review a location where the organism or associated feature occurred.The report will indicate all patients who share a location with the ‘infected’ patient as ‘at risk’. If a patient picks up the same ‘infection’ within x days of another patient, this is highlighted as a possible cross infection.
Cross Infection Matrix
Outbreak ReportList organism or condition outbreaks.Summarized between specific dates.Summarized by specific outbreaks.
Outbreak Report (not a complete report)
Contact Tracing ReportLine based report.Searches on a specific patient between dates.Details other patients who have shared a location with the patient between these dates, bearing in mind the locations of the searched for patient. Patients may be added into ICNet as a case from this report.
Contact Tracing ReportContact Tracing ReportShows all patients who have been in contact with a specified patient over a defined time period.
Patient Details ReportProvides all relevant data regarding a specific patient.
Patient Details Report (not a complete report)
Open Cases ReportLine based report which may be viewed on screen, or may be printed.Indicates all patients who are currently being monitored.Locations may be summarized by hospital, directorate (a group of units) or unit.The results may be sorted by unit, organism, condition or consultant.Additional data may be reported out including:1) bed & bay, 2) specimen information.
Open Case (current work-list) Reportsorted by unit
Open Case (current work-list) Reportincluding detailed documentation on patient
Multi-close Case ReportLine based report which may be viewed on screen, or may be printed.Produces the same report as a detailed open case report, although allows users to quickly close the case through the report.Report may be filtered to show only open cases with:Specimen collected from a specific place.Specific organism/antibiotic sensitivity.A discharge date registered post the specimen collection date.
Multi-close Case Reportfor patients with a specific organism
Antibiogram ReportIndicates in a grid the % susceptibility for organisms.Enables view via a grid or graph.Provides detailed susceptibility information to the patient level if required.Enables the antibiogram to be split by different locations, e.g. Hospital, directorate, unit.
AntibiogramANTIBIOGRAM
Patient Susceptibility
Organism Antibiotic Susceptibility
Comparing organisms from a specific location
Statistical Process Chart indicates when occurrences cross the 2&3 standard deviations from the mean
List of organisms / conditions over time from a specific location
Cross Infection Report
ABXALERTAntimicrobial StewardshipInfection Indicators Graphically displayedCustomised alerts to inappropriate prescriptionsReal time medication trackingMIC values and sensitivity creepIntervention documentation and reporting   Extensive Reporting including:Active AntimicrobialDrug UtilisationIntervention History Indicator overlay Empiric Overlay

ICNet Global Slides

  • 1.
    ICNet Infection CaseManagement & Surveillance Software
  • 2.
    AgendaCompany Overview.Why haveautomated HAI surveillance?Key ICNet features.Clients and references.Technical (interfacing) Experience.Helpdesk, Support and Maintenance.
  • 3.
    ICNet Company OverviewInternationalHQ in UK, USA HQ in Nashville, TN.Strong financials: UK £1.6m turnover & highly profitable.Leading provider of Infection control software.Privately owned, with 20 staff.Over 90 UK NHS Trust clients.International clients: USA, France, South Africa, Malaysia and Thailand.Overseas distributors, including bioMérieux Inc. for USA.
  • 4.
    Why have ICNet& AbxAlert?Assists in pro-active identification of potential CMS payment denial cases. Proactive versus reactive approach.Statistical process charts measure success of process change initiatives designed to reduce HAI’s.Efficiently addresses mandatory reporting.Meaningful feedback to clinicians / administration.Functionally rich Antibiotic Stewardship.More efficient use of Infection Preventionist time.Configurable for early and complete detection of HAI’s and untoward incidents.
  • 5.
    Key ICNet FeaturesWeb-based.Real-timesurveillance.Proactive alerts and functionally rich.Doesn’t require end-user IT expertise.Easy to navigate and simple to use.Hospital controlled data – data never goes outside hospital firewall.Robust, customizable reporting.
  • 6.
    ICNet Product StrengthsDesignedto meet International requirements: NHSN, SSISS & HPA reporting, terminology, date formats.Ad-hoc infection reporting including:institutional anti-biogramcontact tracingstatistical process chartsDrug utilisationInternational implementation and support team.Real time interfacing for location tracking and antibiotic stewardship.Web based using intranet technology.Tried and tested international solution.
  • 7.
    North Middlesex UniversityHospital NHS Trust Plymouth Hospitals NHS Trust Royal Liverpool & Broadgreen University Hospitals NHST Royal Devon & Exeter NHS Foundation Trust Royal Brompton & Harefield NHS TrustUniversity Health System University Hospital of North Staffordshire NHS Trust University Hospital of South Manchester NHS Foundation Trust University Hospitals Bristol NHS Foundation Trust University Hospitals Coventry & Warwickshire NHS Trust West Middlesex University Hospital NHS Trust Whipps Cross University Hospital NHS Trust Extract from UK Teaching Hospital Client List
  • 8.
    Extract from UKTeaching Hospital Client ListBradford Teaching Hospitals NHS Foundation TrustCentral Manchester & Manchester Childs University Hospital NHSFT Christie Hospital NHS Foundation Trust Derby Hospitals NHS Foundation Trust Homerton University Hospital NHS Foundation Trust Imperial College Healthcare NHS Trust Lancashire Teaching Hospital NHS foundation Trust Leeds Teaching Hospitals NHS Trust NHS Lothian (Edinburgh)NHS Grampian (Aberdeen)NHS Tayside (Dundee)Norfolk & Norwich University Hospital NHSFT
  • 9.
    International ClientsMediclinic Group(50 hospitals), South AfricaUniversity Health System, San Antonio, TexasSelayang University Hospital, Selangor, MalaysiaMontsouris Hospital, Paris, France
  • 10.
    Interface experience50 +PAS/HIS interfaces, majority in HL7Anglia PAS, Barwick, Cerner, iPM, IMS, Lorenzo, McKesson, Meditech, Medway, Oasis, Star, TotalCare, Topaz IHCS 90 + LAB interfaces, majority use drivers, query or text file & ftpCerner, EDS, iLab, InLog, Labcentre, Meditech, Quadramed, SCC Soft, Sunquest, Technidata, Telepath, Telepath 2000, Ultra, Winpath Flexible methodology usedHL7 (multiple versions), Text file & FTP, Co-developed driver, Database queries
  • 11.
  • 12.
  • 13.
  • 14.
    SummaryProfitable company.Distributor partnershipsheld internationally.Extensive experience providing infection control software internationally.Used a tried and tested software and interfacing approach.Structured training and support.
  • 15.
    Presented by:Katie HoughtonManagingDirector, ICNet Limited Email: katie.hougton@icnetplc.comWebsite: www.icnetplc.com
  • 16.
  • 17.
  • 18.
    Main ICNet ScreenOverviewMain Navigation BarPatient DemographicsPatient Record: Case Details, Alert Organism, Alert Condition, Notes, ADT HistoryPatient Search Simple & AdvancedImported DataUser Defined AlertsUser Defined Reports
  • 19.
    Case overview inthe CenterLaboratory Latest import list, Alerts and Reports to the right.
  • 20.
    Organism Screen: Alert Organisms, Organism Antibiotic Sensitivity & Specimen DetailsAlert OrganismsOrganism Antibiotic SensitivitySpecimen Details
  • 21.
    Alert Conditions &Associated FeaturesRecord of Alert ConditionsRecord of Associated Features
  • 22.
    Case Note &Patient Note FieldsCase Note FieldPatient Note Field
  • 23.
    Alert Set UpScreenPro-active AlertsMaybe be set on Organisms, Specimen Types or Flagged Patients
  • 24.
    Bacteremia ReportLine basedreport which may be viewed on screen or printedSearches on organism, associated features / antibiotic sensitivities, specimen typesCounts based on specimen, patients or specimens separated by a user definable number of daysData can be reviewed from a specific hospital, directorate, unit, consultant or specialitySearches done between dates
  • 25.
  • 26.
    Organism / ConditionComparison GraphBar graph report, comparing different organism, associated features / antibiotic sensitivities, specimen types or comparing conditions.
  • 27.
    Counts based onspecimen, patients or specimens separated by a user definable number of days.
  • 28.
    All comparisons arebased on data from a single hospital, directorate, unit, consultant or speciality.Searches are based on data between set dates.Graphs are summarized into days, weeks, months, quarters or years or a total over the time period.
  • 29.
    Comparing Organisms froma specific location
  • 30.
    Location Comparison GraphBargraph report, viewing a specific organism or condition over multiple locations.Searches on:organism, associated features / antibiotic sensitivities, specimen typesconditionsCounts based on specimen, patients or specimens separated by a user definable number of days.Comparisons can be based on hospital, directorate, unit, consultant or speciality.Searchers done between dates.Graphs are summarized into days, weeks, months, quarters or years or a total over the time period.Should denominator data be provided, rate reports can be created.
  • 31.
    Organism Occurrences GraphCompares Directorates over Date Range
  • 32.
    Statistical Process Charts(SPC)Searches on organism, associated features / antibiotic sensitivities, specimen typesConditionsCounts based on specimen, patients or specimens separated by a user definable number of daysData can be reviewed from a specific hospital, directorate, unit, consultant or specialitySearches done between dates and are summarized by weeks or monthsGraphs are line graphs.Central line, upper control limit (set at 2 deviations above the mean), lower control limit (set at 3 deviations above the mean) are all automatically calculated.Should denominator data be provided, rate reports can be created
  • 33.
    Statistical Process Control(SPC)Statistical Process Chart for Clostridium difficileDemonstrates when upper control limits for the hospital are exceeded
  • 34.
    Census ReportReviews allpatients who have resided on a specific location during a set time periodIndicates which organisms patients have acquiredEnables review to be filtered to specific locations and specific organisms
  • 35.
    Census ReportCensus ReportShowsall patients at a location between date range and any infections that occurred thus highlighting potential cross infections
  • 36.
    Cross Infection ReportReviewthe organism or associated feature between a specific time.Review a location where the organism or associated feature occurred.The report will indicate all patients who share a location with the ‘infected’ patient as ‘at risk’. If a patient picks up the same ‘infection’ within x days of another patient, this is highlighted as a possible cross infection.
  • 37.
  • 38.
    Outbreak ReportList organismor condition outbreaks.Summarized between specific dates.Summarized by specific outbreaks.
  • 39.
    Outbreak Report (nota complete report)
  • 40.
    Contact Tracing ReportLinebased report.Searches on a specific patient between dates.Details other patients who have shared a location with the patient between these dates, bearing in mind the locations of the searched for patient. Patients may be added into ICNet as a case from this report.
  • 41.
    Contact Tracing ReportContactTracing ReportShows all patients who have been in contact with a specified patient over a defined time period.
  • 42.
    Patient Details ReportProvidesall relevant data regarding a specific patient.
  • 43.
    Patient Details Report(not a complete report)
  • 44.
    Open Cases ReportLinebased report which may be viewed on screen, or may be printed.Indicates all patients who are currently being monitored.Locations may be summarized by hospital, directorate (a group of units) or unit.The results may be sorted by unit, organism, condition or consultant.Additional data may be reported out including:1) bed & bay, 2) specimen information.
  • 45.
    Open Case (currentwork-list) Reportsorted by unit
  • 46.
    Open Case (currentwork-list) Reportincluding detailed documentation on patient
  • 47.
    Multi-close Case ReportLinebased report which may be viewed on screen, or may be printed.Produces the same report as a detailed open case report, although allows users to quickly close the case through the report.Report may be filtered to show only open cases with:Specimen collected from a specific place.Specific organism/antibiotic sensitivity.A discharge date registered post the specimen collection date.
  • 48.
    Multi-close Case Reportforpatients with a specific organism
  • 49.
    Antibiogram ReportIndicates ina grid the % susceptibility for organisms.Enables view via a grid or graph.Provides detailed susceptibility information to the patient level if required.Enables the antibiogram to be split by different locations, e.g. Hospital, directorate, unit.
  • 50.
  • 51.
  • 52.
  • 53.
    Comparing organisms froma specific location
  • 54.
    Statistical Process Chartindicates when occurrences cross the 2&3 standard deviations from the mean
  • 55.
    List of organisms/ conditions over time from a specific location
  • 56.
  • 57.
    ABXALERTAntimicrobial StewardshipInfection IndicatorsGraphically displayedCustomised alerts to inappropriate prescriptionsReal time medication trackingMIC values and sensitivity creepIntervention documentation and reporting Extensive Reporting including:Active AntimicrobialDrug UtilisationIntervention History Indicator overlay Empiric Overlay
  • 58.
    Patient AntibioticsPatient InfectionIndicatorsMIC / Sensitivity Creep
  • 59.