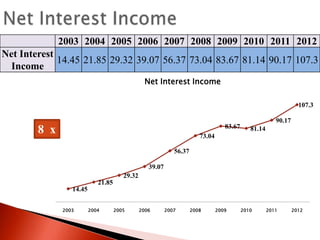
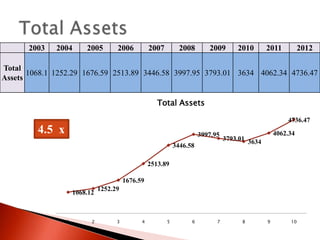
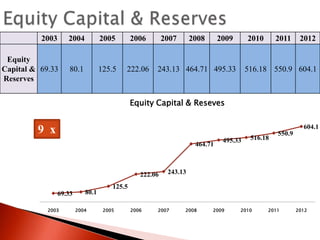
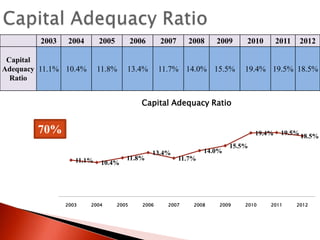
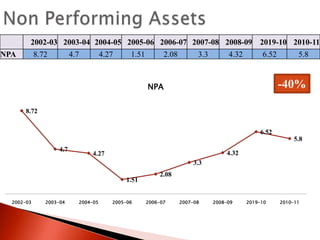
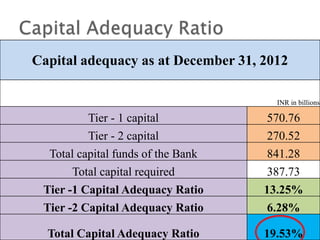
Presented By:
Arpan Shah
Chanda Kochhar
MD & CEO

K V Kamath
Chairman


It is the second largest bank in India by assets and third
largest by market capitalization.



The Bank has a network of 2,883 branches and 10,021
ATM's in India



Presence in 19 countries, including India.United
Kingdom, Russia, and Canada etc.



Currently Market Price around 1170 Rs on BSE


1955
The Industrial Credit and Investment Corporation of India
Limited (ICICI) was incorporated at the initiative of World
Bank, the Government of India and representatives of Indian
industry, with the objective of creating a development
financial institution for providing medium-term and long-term
project financing to Indian businesses.



1994
ICICI established Banking Corporation as a banking
subsidiary.
Later, ICICI Banking Corporation was renamed as 'ICICI
Bank Limited'.


1997
The bank introduced electronic funds transfer facility.
The Bank offered 150,00,000 No. of equity shares of Rs 10
each a premium of Rs 25 per share to ICICI.

The Bank offered for sale 412,50,200 No. of equity shares
of Rs 10 each at a price of Rs 35 per share


1998
- ICICI Bank, introduced Internet banking in India.


2000
ICICI Bank became the first Indian bank to list on the New
York Stock Exchange with its $175-million American
depository shares issue .

The Bank of Madura (BOM) got merged with ICICI Bank.

ICICI Bank has become one of the largest private sector banks
in India.
Historic Data
5 x
5 x
5 x
2003 2004 2005 2006 2007 2008 2009 2010 2011 2012
Net Interest
14.45 21.85 29.32 39.07 56.37 73.04 83.67 81.14 90.17 107.3
Income
Net Interest Income
107.3
83.67

8 x

90.17
81.14

73.04
56.37
39.07
29.32
21.85
14.45
2003

2004

2005

2006

2007

2008

2009

2010

2011

2012
2003 2004 2005 2006 2007 2008 2009 2010 2011 2012
Earnings
19.7 26.7 27.6 32.5 34.8 39.4 33.8 36.1 45.3 56.1
Per Share
Earnings Per Share
56.1

3 x

45.3
39.4
32.5
26.7

34.8

33.8

36.1

27.6

19.7

2003

2004

2005

2006

2007

2008

2009

2010

2011

2012
2003

2004

2005

2006

2007

2008

2009

2010

2011

2012

Total
1068.1 1252.29 1676.59 2513.89 3446.58 3997.95 3793.01 3634 4062.34 4736.47
Assets
Total Assets
4736.47

4.5 x

3997.95
3446.58

4062.34

3793.01 3634

2513.89
1676.59
1068.12

1

2

1252.29

3

4

5

6

7

8

9

10
2003

2004

2005

2006

Equity
Capital & 69.33
Reserves

80.1

125.5

222.06

2007

2008

2009

2010

243.13 464.71 495.33

2011

2012

516.18 550.9 604.1

Equity Capital & Reseves
604.1

9 x
464.71

222.06
69.33
2003

80.1
2004

495.33

516.18

550.9

243.13

125.5

2005

2006

2007

2008

2009

2010

2011

2012
2003

2004

2005

2007

11.8%

Capital
Adequacy 11.1% 10.4%
Ratio

2006

2008

2009

13.4%

11.7% 14.0% 15.5%

2010

2011

2012

19.4% 19.5% 18.5%

Capital Adequacy Ratio

70%

19.4%

11.1%

2003

10.4%

2004

11.8%

2005

13.4%

2006

14.0%

19.5% 18.5%

15.5%

11.7%

2007

2008

2009

2010

2011

2012
2002-03 2003-04 2004-05 2005-06 2006-07 2007-08 2008-09 2019-10 2010-11
NPA

8.72

4.7

4.27

1.51

2.08

3.3

4.32

6.52

5.8

-40%

NPA
8.72
6.52

5.8
4.7

4.32

4.27

3.3
1.51
2002-03

2003-04

2004-05

2005-06

2.08

2006-07

2007-08

2008-09

2019-10

2010-11






MARKET CAP
P/E
Net worth
DIV (%)
EPS

129,527.06 Cr
16.35
60,405.25 Cr
165.00%
68.68



Net profit for 3rd quarter 2012 rose to Rs. 2,250 crore
against Rs. 1,728 crore in the corresponding quarter a
year ago



30% increase


Advances increased by 16%



From 2,46,157 crore to 2,86,766 crore



The year-on-year growth in retail advances was 17%




The Bank maintained its current and savings account
(CASA) ratio at 40.9% as compared to 40.7% of
previous quarter.
Savings account deposits were 81,463 crore



Current account deposits were 35,674 crore



CASA deposits increased by 2,718 crore
Treasury

1QY13
-21

4QY12
158

Advances
Deposits
Credit-to-Deposit Ratio(%)

268,430
267,794
100.2

253,728
255,500
99.3

Current deposits (cr)
Saving deposits (cr)
CASA deposits
CASA Ratio(%)

30,754
77,923
1,08,677
40.6

34,973
76,046
1,11,019
43.5

Gross NPAs(Cr)
(%)

9,817
3.5

9,475
3.6
Under Under Basel
Basel II
III

Capital Adequacy Ratio Requirement

8%

10.50%
Capital adequacy as at December 31, 2012
INR in billions

Tier - 1 capital
Tier - 2 capital
Total capital funds of the Bank
Total capital required
Tier -1 Capital Adequacy Ratio
Tier -2 Capital Adequacy Ratio

570.76
270.52
841.28
387.73
13.25%
6.28%

Total Capital Adequacy Ratio

19.53%


ICICI Venture is asset management Company



The firm is a wholly owned subsidiary of ICICI Bank



The largest private sector financial services group in India


ICICI Lombard GIC Ltd. is a joint venture between ICICI
Bank and Fairfax Financial Holdings Limited, a Canada
financial services company



Engaged in general insurance, reinsurance, insurance claims
management and investment management.


ICICI Securities Ltd is an integrated securities firm



Offers investment banking, institutional broking, retail
broking, private wealth management, and financial
product distribution.


ICICI Prudential Life Insurance between ICICI Bank
and Prudential plc, a leading international financial
services group headquartered in the United Kingdom.


ICICI Direct



ICICI Foundation



Disha Financial Counseling



ICICI Prudential AMC & Trust
Projection
FY12

FY13E

FY14E

Growth(%)

17.1

16.6

19.2

EPS

56.1

68.7

82

Total Asset
Total Liabilities

473647
437647

551148
551,148

655427
655427

Deposits

255500
13.30%

296380
16%

364547
23%

Net Interest Income

10734
19%

13706
27.70%

16635
21.40%

Credit Growth

20%

23%

Deposit Growth

16%

23%

CASA Ratio

43.40%

43.30%

7915
22.40%

9451
19.40%

Net Profit

6465
25.50%


Exceeding Requirement of Basel 3



Very Aggressive



Growth Oriented



Able to Digest huge Loss & NPAs
Thank You

ICICI Bank Projections

  • 1.
  • 2.
    Chanda Kochhar MD &CEO K V Kamath Chairman
  • 3.
     It is thesecond largest bank in India by assets and third largest by market capitalization.  The Bank has a network of 2,883 branches and 10,021 ATM's in India  Presence in 19 countries, including India.United Kingdom, Russia, and Canada etc.  Currently Market Price around 1170 Rs on BSE
  • 4.
     1955 The Industrial Creditand Investment Corporation of India Limited (ICICI) was incorporated at the initiative of World Bank, the Government of India and representatives of Indian industry, with the objective of creating a development financial institution for providing medium-term and long-term project financing to Indian businesses.  1994 ICICI established Banking Corporation as a banking subsidiary. Later, ICICI Banking Corporation was renamed as 'ICICI Bank Limited'.
  • 5.
     1997 The bank introducedelectronic funds transfer facility. The Bank offered 150,00,000 No. of equity shares of Rs 10 each a premium of Rs 25 per share to ICICI. The Bank offered for sale 412,50,200 No. of equity shares of Rs 10 each at a price of Rs 35 per share  1998 - ICICI Bank, introduced Internet banking in India.
  • 6.
     2000 ICICI Bank becamethe first Indian bank to list on the New York Stock Exchange with its $175-million American depository shares issue . The Bank of Madura (BOM) got merged with ICICI Bank. ICICI Bank has become one of the largest private sector banks in India.
  • 7.
  • 9.
  • 10.
  • 11.
  • 12.
    2003 2004 20052006 2007 2008 2009 2010 2011 2012 Net Interest 14.45 21.85 29.32 39.07 56.37 73.04 83.67 81.14 90.17 107.3 Income Net Interest Income 107.3 83.67 8 x 90.17 81.14 73.04 56.37 39.07 29.32 21.85 14.45 2003 2004 2005 2006 2007 2008 2009 2010 2011 2012
  • 13.
    2003 2004 20052006 2007 2008 2009 2010 2011 2012 Earnings 19.7 26.7 27.6 32.5 34.8 39.4 33.8 36.1 45.3 56.1 Per Share Earnings Per Share 56.1 3 x 45.3 39.4 32.5 26.7 34.8 33.8 36.1 27.6 19.7 2003 2004 2005 2006 2007 2008 2009 2010 2011 2012
  • 14.
    2003 2004 2005 2006 2007 2008 2009 2010 2011 2012 Total 1068.1 1252.29 1676.592513.89 3446.58 3997.95 3793.01 3634 4062.34 4736.47 Assets Total Assets 4736.47 4.5 x 3997.95 3446.58 4062.34 3793.01 3634 2513.89 1676.59 1068.12 1 2 1252.29 3 4 5 6 7 8 9 10
  • 15.
    2003 2004 2005 2006 Equity Capital & 69.33 Reserves 80.1 125.5 222.06 2007 2008 2009 2010 243.13464.71 495.33 2011 2012 516.18 550.9 604.1 Equity Capital & Reseves 604.1 9 x 464.71 222.06 69.33 2003 80.1 2004 495.33 516.18 550.9 243.13 125.5 2005 2006 2007 2008 2009 2010 2011 2012
  • 16.
    2003 2004 2005 2007 11.8% Capital Adequacy 11.1% 10.4% Ratio 2006 2008 2009 13.4% 11.7%14.0% 15.5% 2010 2011 2012 19.4% 19.5% 18.5% Capital Adequacy Ratio 70% 19.4% 11.1% 2003 10.4% 2004 11.8% 2005 13.4% 2006 14.0% 19.5% 18.5% 15.5% 11.7% 2007 2008 2009 2010 2011 2012
  • 17.
    2002-03 2003-04 2004-052005-06 2006-07 2007-08 2008-09 2019-10 2010-11 NPA 8.72 4.7 4.27 1.51 2.08 3.3 4.32 6.52 5.8 -40% NPA 8.72 6.52 5.8 4.7 4.32 4.27 3.3 1.51 2002-03 2003-04 2004-05 2005-06 2.08 2006-07 2007-08 2008-09 2019-10 2010-11
  • 18.
         MARKET CAP P/E Net worth DIV(%) EPS 129,527.06 Cr 16.35 60,405.25 Cr 165.00% 68.68  Net profit for 3rd quarter 2012 rose to Rs. 2,250 crore against Rs. 1,728 crore in the corresponding quarter a year ago  30% increase
  • 19.
     Advances increased by16%  From 2,46,157 crore to 2,86,766 crore  The year-on-year growth in retail advances was 17%
  • 20.
      The Bank maintainedits current and savings account (CASA) ratio at 40.9% as compared to 40.7% of previous quarter. Savings account deposits were 81,463 crore  Current account deposits were 35,674 crore  CASA deposits increased by 2,718 crore
  • 21.
    Treasury 1QY13 -21 4QY12 158 Advances Deposits Credit-to-Deposit Ratio(%) 268,430 267,794 100.2 253,728 255,500 99.3 Current deposits(cr) Saving deposits (cr) CASA deposits CASA Ratio(%) 30,754 77,923 1,08,677 40.6 34,973 76,046 1,11,019 43.5 Gross NPAs(Cr) (%) 9,817 3.5 9,475 3.6
  • 22.
    Under Under Basel BaselII III Capital Adequacy Ratio Requirement 8% 10.50%
  • 23.
    Capital adequacy asat December 31, 2012 INR in billions Tier - 1 capital Tier - 2 capital Total capital funds of the Bank Total capital required Tier -1 Capital Adequacy Ratio Tier -2 Capital Adequacy Ratio 570.76 270.52 841.28 387.73 13.25% 6.28% Total Capital Adequacy Ratio 19.53%
  • 24.
     ICICI Venture isasset management Company  The firm is a wholly owned subsidiary of ICICI Bank  The largest private sector financial services group in India
  • 25.
     ICICI Lombard GICLtd. is a joint venture between ICICI Bank and Fairfax Financial Holdings Limited, a Canada financial services company  Engaged in general insurance, reinsurance, insurance claims management and investment management.
  • 26.
     ICICI Securities Ltdis an integrated securities firm  Offers investment banking, institutional broking, retail broking, private wealth management, and financial product distribution.
  • 27.
     ICICI Prudential LifeInsurance between ICICI Bank and Prudential plc, a leading international financial services group headquartered in the United Kingdom.
  • 28.
     ICICI Direct  ICICI Foundation  DishaFinancial Counseling  ICICI Prudential AMC & Trust
  • 29.
  • 30.
    FY12 FY13E FY14E Growth(%) 17.1 16.6 19.2 EPS 56.1 68.7 82 Total Asset Total Liabilities 473647 437647 551148 551,148 655427 655427 Deposits 255500 13.30% 296380 16% 364547 23% NetInterest Income 10734 19% 13706 27.70% 16635 21.40% Credit Growth 20% 23% Deposit Growth 16% 23% CASA Ratio 43.40% 43.30% 7915 22.40% 9451 19.40% Net Profit 6465 25.50%
  • 31.
     Exceeding Requirement ofBasel 3  Very Aggressive  Growth Oriented  Able to Digest huge Loss & NPAs
  • 32.

Editor's Notes

  • #4 Many foreign banks learnig retail banking from india and ICICI has played huge role in that.