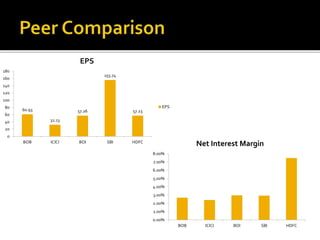
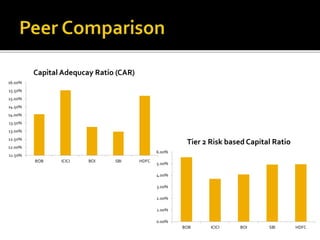
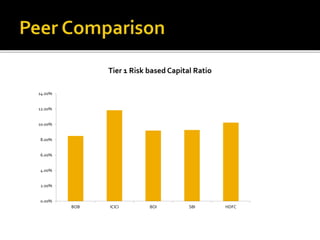
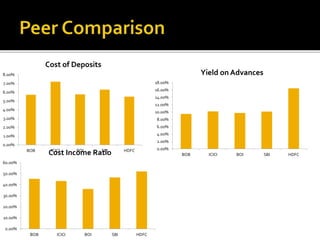
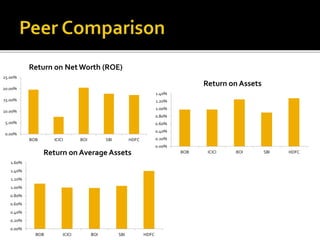
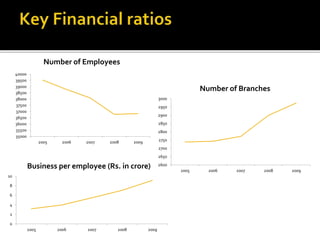
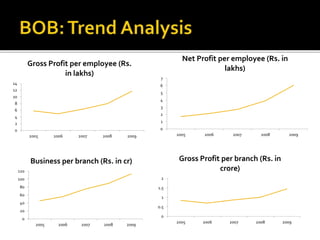
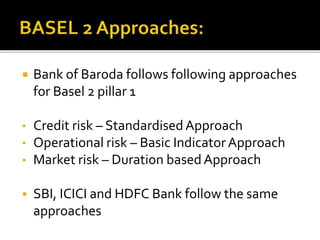
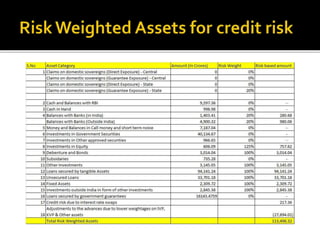
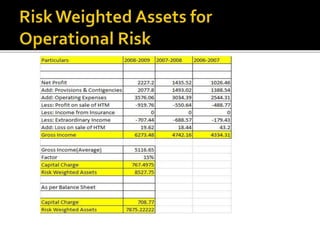
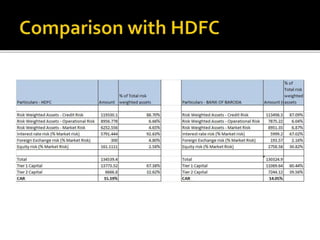
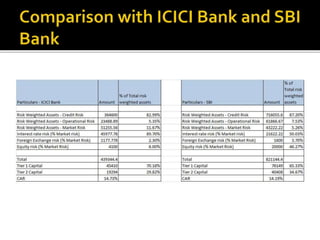
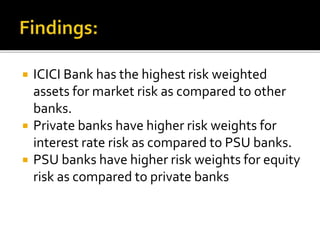
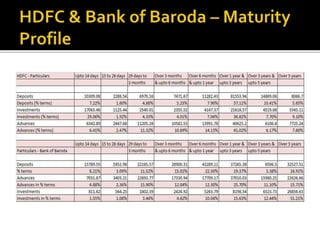
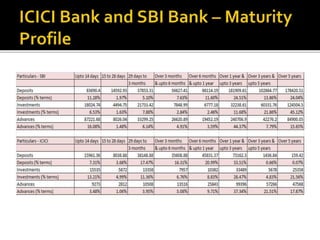
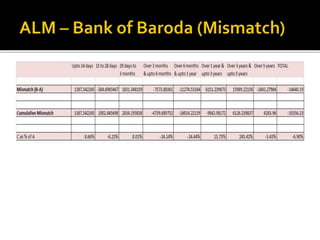
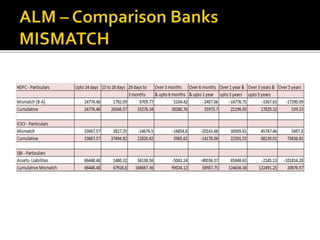
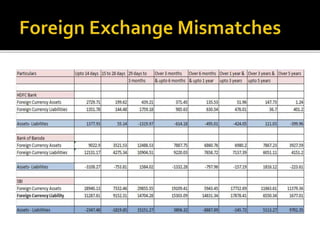
 Industry Overview 
 Company Over view 
 SWOT Analysis 
 Financial Analysis 
 Basel 2 and Implications 
 ALM Implementation and Comparison 
 Valuation
 Sustainable growth momentum 
 Under penetration of financial products 
 Retail credit on the rise 
Agri credit 
12% 
Industries 
41% 
Others 
17% 
Retail 
22% 
Real Estate 
4% 
NBFC's 
4% 
Loans
Taiwan 
Korea 
Malaysia 
Phillipines 
Thailand 
Singapore 
HK 
Indonesia 
China 
India 
Loan CAGR 2003 - 2008 
0.0% 5.0% 10.0% 15.0% 20.0% 25.0% 
Loan CAGR
0% 50% 100% 150% 200% 250% 
Indonesia 
Phillipines 
India 
Thailand 
Korea 
Malaysia 
China 
Singapore 
Taiwan 
HK 
Credit/GDP Ratio 
Credit/GDP
0% 10% 20% 30% 40% 50% 
Canara 
BOI 
PNB 
Union 
Sector 
SBI 
Corp Bank 
ICICI 
OBC 
BOB 
HDFC 
Credit CAGR, FY 04-09 
Credit CAGR
0% 10% 20% 30% 40% 50% 60% 
Others 
Agri Credit 
Industries 
Non Food Credit 
Retail 
Bank-credit CAGR, FY 04-09 
Bank-credit CAGR
 Target market expanding 
 New players a threat to banks (Insurance 
companies, Mutual Fund etc) 
29.1 
31.2 
23.9 
26.1 
20.6 
21.4 
17.7 
14.4 
0.0 5.0 10.0 15.0 20.0 25.0 30.0 35.0 
Germany 
UK 
US 
China 
Thailand 
Brazil 
Indonesia 
India 
Percentage Population below 15
0 0.5 1 1.5 2 
Old Private Banks 
PSU Banks 
Sector 
New Private Banks 
Deposit per branch (Rsbn) 
Deposit per branch
0 0.2 0.4 0.6 
Old Private Banks 
PSU Banks 
Sector 
New Private Banks 
CASA deposit per branch (Rsbn) 
CASA deposit per branch
0 0.1 0.2 0.3 0.4 0.5 0.6 
Old Private Banks 
PSU Banks 
Sector 
New Private Banks 
Advances per branch (Rsbn) 
Advances per branch
Old Private Banks 
PSU Banks 
Sector 
New Private Banks 
Fee generation as a share of assets 
0.00% 0.50% 1.00% 1.50% 
Fee generation as a share 
of assets
 GDP dip to reduce Deposit growth 
 Rising competition 
 Lower Long term resources 
>5 years 
15% 
Up to 1 year 
48% 
3-5 years 
1-3 years 
29% 
8% 
Maturity of Deposits
 Traditional lending to be commoditised 
 Basel II Norms 
 Banks service to be a differentiator
 Superior soft skills 
 Higher Fees 
 Technological gap reducing 
 Innovative products 
 Better non-branch distribution model
 Globalization 
 Need for a single system 
 From 8 systems to Finacle – One solution, 
One stategy 
 Time, Cost & Risk minimization 
 MIS Reporting 
 Cross country product introduction 
 Direct India Remittance
 Founded in 1908, Bank of Baroda is the 3rd 
largest public sector bank in India 
 Holds total assets in excess of Rs 2.27 lakh cr 
 Network of over 3000 branches and offices 
 Offers a wide range of banking products and 
financial services 
 Government holds approximately 54% stake 
 7 International subsidiaries
PERSONAL 
• Deposits 
• Retail Loans 
• Credit cards 
• Debit Cards 
• Services 
BUSINESS/ 
CORPORATES 
• Deposits 
• Loans and Advances 
• Services 
• Lockers 
• Wholesale Banking 
INTERNATIONAL 
• NRI services 
• ECB 
• FCNR(B) Loans 
• Offshore Banking 
• Export Finance 
• Import Finance 
• Trade Finance 
• International Treasury 
TREASURY 
• Domestic Operations 
• ForexOperations
• Wholesale 
Banking 
• SME Banking 
• Retail Banking 
• Rural/Agri Banking 
• Wealth 
Management 
• Demat 
• Product Enquiry 
• Deposit Products 
• Loan Products 
• ATM/ Debit cards 
• Internet Banking 
• NRI remittances 
• Baroda e-trading 
• Interest Rates
25% 
29% 
30% 
16% 
Revene Earnings 2008-09 
Treasury Operations 
Corporate/Wholesale Banking 
Retail Banking 
Banking Operations 
26% 
30% 
28% 
16% 
Revenue Earnings 2007-08 
Treasury Operations 
Corporate/Wholesale Banking 
Retail Banking 
Banking Operations
18000 
16000 
14000 
12000 
10000 
8000 
6000 
4000 
2000 
0 
Geographic Revenue 
2002-03 2003-04 2004-05 2005-06 2006-07 2007-08 2008-09 
Domestic 
International
Financial Analysis
60.93 
32.13 
EPS 
57.26 
155.74 
57.23 
180 
160 
140 
120 
100 
80 
60 
40 
20 
0 
BOB ICICI BOI SBI HDFC 
EPS 
8.00% 
7.00% 
6.00% 
5.00% 
4.00% 
3.00% 
2.00% 
1.00% 
0.00% 
Net Interest Margin 
BOB ICICI BOI SBI HDFC
6.00% 
5.00% 
4.00% 
3.00% 
2.00% 
1.00% 
0.00% 
Tier 2 Risk based Capital Ratio 
BOB ICICI BOI SBI HDFC 
16.00% 
15.50% 
15.00% 
14.50% 
14.00% 
13.50% 
13.00% 
12.50% 
12.00% 
11.50% 
Capital Adequcay Ratio (CAR) 
BOB ICICI BOI SBI HDFC
14.00% 
12.00% 
10.00% 
8.00% 
6.00% 
4.00% 
2.00% 
0.00% 
Tier 1 Risk based Capital Ratio 
BOB ICICI BOI SBI HDFC
8.00% 
7.00% 
6.00% 
5.00% 
4.00% 
3.00% 
2.00% 
1.00% 
0.00% 
Cost of Deposits 
BOB ICICI BOI SBI HDFC 
18.00% 
16.00% 
14.00% 
12.00% 
10.00% 
8.00% 
6.00% 
4.00% 
2.00% 
0.00% 
Yield on Advances 
BOB ICICI BOI SBI HDFC 
60.00% 
50.00% 
40.00% 
30.00% 
20.00% 
10.00% 
0.00% 
Cost Income Ratio 
BOB ICICI BOI SBI HDFC
25.00% 
20.00% 
15.00% 
10.00% 
5.00% 
0.00% 
Return on Net Worth (ROE) 
BOB ICICI BOI SBI HDFC 
1.40% 
1.20% 
1.00% 
0.80% 
0.60% 
0.40% 
0.20% 
0.00% 
Return on Assets 
BOB ICICI BOI SBI HDFC 
1.60% 
1.40% 
1.20% 
1.00% 
0.80% 
0.60% 
0.40% 
0.20% 
0.00% 
Return on Average Assets 
BOB ICICI BOI SBI HDFC
40000 
39500 
39000 
38500 
38000 
37500 
37000 
36500 
36000 
35500 
35000 
Number of Employees 
2005 2006 2007 2008 2009 
3000 
2950 
2900 
2850 
2800 
2750 
2700 
2650 
2600 
Number of Branches 
2005 2006 2007 2008 2009 
10 
8 
6 
4 
2 
0 
Business per employee (Rs. in crore) 
2005 2006 2007 2008 2009
14 
12 
10 
8 
6 
4 
2 
0 
Gross Profit per employee (Rs. 
in lakhs) 
2005 2006 2007 2008 2009 
7 
6 
5 
4 
3 
2 
1 
0 
Net Profit per employee (Rs. in 
lakhs) 
2005 2006 2007 2008 2009 
120 
100 
80 
60 
40 
20 
0 
Business per branch (Rs. in cr) 
2005 2006 2007 2008 2009 
2 
1.5 
1 
0.5 
0 
Gross Profit per branch (Rs. in 
crore) 
2005 2006 2007 2008 2009
0.8 
0.7 
0.6 
0.5 
0.4 
0.3 
0.2 
0.1 
0 
Net Profit per branch (Rs. in crore) 
2005 2006 2007 2008 2009 
350 
300 
250 
200 
150 
100 
50 
0 
2005 2006 2007 2008 2009 
Earnings per share (Rupees) 
Book Value per share (Rupees)
 Gross NPA to gross advances – 1.27% 
 Net NPA to net advances – 0.31% 
 Net NPA of 451.15 crores 
 One of the lowest gross NPA levels in the 
industry. 
• HDFC – 2% 
• ICICI Bank – 4.4% 
• SBI -2.8% 
• BOI – 1.7%
90 
80 
70 
60 
50 
40 
30 
20 
10 
0 
2007 2008 2009 
Non Interest Income/ Total Income 
Net Interest Income/ Total Income
 Well diversified branch distribution 
 Strong concentration in the western region 
makes sure that it is CASA rich 
 Better focus on international market 
 Improvement on the ROE margins in the last 
fiscal year 
 Strong asset quality with healthy coverage 
ratio
 Inadequate talent pool to compete with 
strong private banks 
 Not very strong on technology front 
 Lesser expansion of branches in past few 
years. 
 Lesser strategic initiatives as compared to 
larger private banks 
 Late on introducing latest products in the 
market
 Cost to Income could improve in coming 
years 
 Scope to improve non interest income 
 Focus more aggressively on retail banking
 Contribution from the foreign business of the 
bank is around 25% on the bottom line 
 NPA levels could rise as there is over reliance 
on corporate and SME’s. 
 Continued slow down in the economy could 
slow down credit growth
BASEL -2 Approaches and 
Comparison
 Bank of Baroda follows following approaches 
for Basel 2 pillar 1 
• Credit risk – Standardised Approach 
• Operational risk – Basic Indicator Approach 
• Market risk – Duration based Approach 
 SBI, ICICI and HDFC Bank follow the same 
approaches
 We were not able to find out risk weighted 
assets due to market risk as there is no data 
available regarding exact investments. 
 From Annual report – 8951.35 crores
 ICICI Bank has the highest risk weighted 
assets for market risk as compared to other 
banks. 
 Private banks have higher risk weights for 
interest rate risk as compared to PSU banks. 
 PSU banks have higher risk weights for equity 
risk as compared to private banks
Asset and Liability 
Management Implementation 
and Comparison
 On the foreign exchange front BOB and SBI 
have done better than HDFC. 
 HDFC has the best ALM followed by SBI and 
ICICI. BOB needs to improve on ALM. 
 BOB needs to improve on reporting for Basel 
2 disclosures of ALM
Bob

Bob

  • 2.
     Industry Overview  Company Over view  SWOT Analysis  Financial Analysis  Basel 2 and Implications  ALM Implementation and Comparison  Valuation
  • 3.
     Sustainable growthmomentum  Under penetration of financial products  Retail credit on the rise Agri credit 12% Industries 41% Others 17% Retail 22% Real Estate 4% NBFC's 4% Loans
  • 4.
    Taiwan Korea Malaysia Phillipines Thailand Singapore HK Indonesia China India Loan CAGR 2003 - 2008 0.0% 5.0% 10.0% 15.0% 20.0% 25.0% Loan CAGR
  • 5.
    0% 50% 100%150% 200% 250% Indonesia Phillipines India Thailand Korea Malaysia China Singapore Taiwan HK Credit/GDP Ratio Credit/GDP
  • 6.
    0% 10% 20%30% 40% 50% Canara BOI PNB Union Sector SBI Corp Bank ICICI OBC BOB HDFC Credit CAGR, FY 04-09 Credit CAGR
  • 7.
    0% 10% 20%30% 40% 50% 60% Others Agri Credit Industries Non Food Credit Retail Bank-credit CAGR, FY 04-09 Bank-credit CAGR
  • 8.
     Target marketexpanding  New players a threat to banks (Insurance companies, Mutual Fund etc) 29.1 31.2 23.9 26.1 20.6 21.4 17.7 14.4 0.0 5.0 10.0 15.0 20.0 25.0 30.0 35.0 Germany UK US China Thailand Brazil Indonesia India Percentage Population below 15
  • 9.
    0 0.5 11.5 2 Old Private Banks PSU Banks Sector New Private Banks Deposit per branch (Rsbn) Deposit per branch
  • 10.
    0 0.2 0.40.6 Old Private Banks PSU Banks Sector New Private Banks CASA deposit per branch (Rsbn) CASA deposit per branch
  • 11.
    0 0.1 0.20.3 0.4 0.5 0.6 Old Private Banks PSU Banks Sector New Private Banks Advances per branch (Rsbn) Advances per branch
  • 12.
    Old Private Banks PSU Banks Sector New Private Banks Fee generation as a share of assets 0.00% 0.50% 1.00% 1.50% Fee generation as a share of assets
  • 13.
     GDP dipto reduce Deposit growth  Rising competition  Lower Long term resources >5 years 15% Up to 1 year 48% 3-5 years 1-3 years 29% 8% Maturity of Deposits
  • 14.
     Traditional lendingto be commoditised  Basel II Norms  Banks service to be a differentiator
  • 15.
     Superior softskills  Higher Fees  Technological gap reducing  Innovative products  Better non-branch distribution model
  • 16.
     Globalization Need for a single system  From 8 systems to Finacle – One solution, One stategy  Time, Cost & Risk minimization  MIS Reporting  Cross country product introduction  Direct India Remittance
  • 17.
     Founded in1908, Bank of Baroda is the 3rd largest public sector bank in India  Holds total assets in excess of Rs 2.27 lakh cr  Network of over 3000 branches and offices  Offers a wide range of banking products and financial services  Government holds approximately 54% stake  7 International subsidiaries
  • 18.
    PERSONAL • Deposits • Retail Loans • Credit cards • Debit Cards • Services BUSINESS/ CORPORATES • Deposits • Loans and Advances • Services • Lockers • Wholesale Banking INTERNATIONAL • NRI services • ECB • FCNR(B) Loans • Offshore Banking • Export Finance • Import Finance • Trade Finance • International Treasury TREASURY • Domestic Operations • ForexOperations
  • 21.
    PERSONAL • Deposits • Retail Loans • Credit cards • Debit Cards • Services BUSINESS/ CORPORATES • Deposits • Loans and Advances • Services • Lockers • Wholesale Banking INTERNATIONAL • NRI services • ECB • FCNR(B) Loans • Offshore Banking • Export Finance • Import Finance • Trade Finance • International Treasury TREASURY • Domestic Operations • ForexOperations
  • 22.
    • Wholesale Banking • SME Banking • Retail Banking • Rural/Agri Banking • Wealth Management • Demat • Product Enquiry • Deposit Products • Loan Products • ATM/ Debit cards • Internet Banking • NRI remittances • Baroda e-trading • Interest Rates
  • 23.
    25% 29% 30% 16% Revene Earnings 2008-09 Treasury Operations Corporate/Wholesale Banking Retail Banking Banking Operations 26% 30% 28% 16% Revenue Earnings 2007-08 Treasury Operations Corporate/Wholesale Banking Retail Banking Banking Operations
  • 24.
    18000 16000 14000 12000 10000 8000 6000 4000 2000 0 Geographic Revenue 2002-03 2003-04 2004-05 2005-06 2006-07 2007-08 2008-09 Domestic International
  • 25.
  • 26.
    60.93 32.13 EPS 57.26 155.74 57.23 180 160 140 120 100 80 60 40 20 0 BOB ICICI BOI SBI HDFC EPS 8.00% 7.00% 6.00% 5.00% 4.00% 3.00% 2.00% 1.00% 0.00% Net Interest Margin BOB ICICI BOI SBI HDFC
  • 27.
    6.00% 5.00% 4.00% 3.00% 2.00% 1.00% 0.00% Tier 2 Risk based Capital Ratio BOB ICICI BOI SBI HDFC 16.00% 15.50% 15.00% 14.50% 14.00% 13.50% 13.00% 12.50% 12.00% 11.50% Capital Adequcay Ratio (CAR) BOB ICICI BOI SBI HDFC
  • 28.
    14.00% 12.00% 10.00% 8.00% 6.00% 4.00% 2.00% 0.00% Tier 1 Risk based Capital Ratio BOB ICICI BOI SBI HDFC
  • 29.
    8.00% 7.00% 6.00% 5.00% 4.00% 3.00% 2.00% 1.00% 0.00% Cost of Deposits BOB ICICI BOI SBI HDFC 18.00% 16.00% 14.00% 12.00% 10.00% 8.00% 6.00% 4.00% 2.00% 0.00% Yield on Advances BOB ICICI BOI SBI HDFC 60.00% 50.00% 40.00% 30.00% 20.00% 10.00% 0.00% Cost Income Ratio BOB ICICI BOI SBI HDFC
  • 30.
    25.00% 20.00% 15.00% 10.00% 5.00% 0.00% Return on Net Worth (ROE) BOB ICICI BOI SBI HDFC 1.40% 1.20% 1.00% 0.80% 0.60% 0.40% 0.20% 0.00% Return on Assets BOB ICICI BOI SBI HDFC 1.60% 1.40% 1.20% 1.00% 0.80% 0.60% 0.40% 0.20% 0.00% Return on Average Assets BOB ICICI BOI SBI HDFC
  • 31.
    40000 39500 39000 38500 38000 37500 37000 36500 36000 35500 35000 Number of Employees 2005 2006 2007 2008 2009 3000 2950 2900 2850 2800 2750 2700 2650 2600 Number of Branches 2005 2006 2007 2008 2009 10 8 6 4 2 0 Business per employee (Rs. in crore) 2005 2006 2007 2008 2009
  • 32.
    14 12 10 8 6 4 2 0 Gross Profit per employee (Rs. in lakhs) 2005 2006 2007 2008 2009 7 6 5 4 3 2 1 0 Net Profit per employee (Rs. in lakhs) 2005 2006 2007 2008 2009 120 100 80 60 40 20 0 Business per branch (Rs. in cr) 2005 2006 2007 2008 2009 2 1.5 1 0.5 0 Gross Profit per branch (Rs. in crore) 2005 2006 2007 2008 2009
  • 33.
    0.8 0.7 0.6 0.5 0.4 0.3 0.2 0.1 0 Net Profit per branch (Rs. in crore) 2005 2006 2007 2008 2009 350 300 250 200 150 100 50 0 2005 2006 2007 2008 2009 Earnings per share (Rupees) Book Value per share (Rupees)
  • 34.
     Gross NPAto gross advances – 1.27%  Net NPA to net advances – 0.31%  Net NPA of 451.15 crores  One of the lowest gross NPA levels in the industry. • HDFC – 2% • ICICI Bank – 4.4% • SBI -2.8% • BOI – 1.7%
  • 35.
    90 80 70 60 50 40 30 20 10 0 2007 2008 2009 Non Interest Income/ Total Income Net Interest Income/ Total Income
  • 37.
     Well diversifiedbranch distribution  Strong concentration in the western region makes sure that it is CASA rich  Better focus on international market  Improvement on the ROE margins in the last fiscal year  Strong asset quality with healthy coverage ratio
  • 38.
     Inadequate talentpool to compete with strong private banks  Not very strong on technology front  Lesser expansion of branches in past few years.  Lesser strategic initiatives as compared to larger private banks  Late on introducing latest products in the market
  • 39.
     Cost toIncome could improve in coming years  Scope to improve non interest income  Focus more aggressively on retail banking
  • 40.
     Contribution fromthe foreign business of the bank is around 25% on the bottom line  NPA levels could rise as there is over reliance on corporate and SME’s.  Continued slow down in the economy could slow down credit growth
  • 41.
    BASEL -2 Approachesand Comparison
  • 42.
     Bank ofBaroda follows following approaches for Basel 2 pillar 1 • Credit risk – Standardised Approach • Operational risk – Basic Indicator Approach • Market risk – Duration based Approach  SBI, ICICI and HDFC Bank follow the same approaches
  • 45.
     We werenot able to find out risk weighted assets due to market risk as there is no data available regarding exact investments.  From Annual report – 8951.35 crores
  • 50.
     ICICI Bankhas the highest risk weighted assets for market risk as compared to other banks.  Private banks have higher risk weights for interest rate risk as compared to PSU banks.  PSU banks have higher risk weights for equity risk as compared to private banks
  • 51.
    Asset and Liability Management Implementation and Comparison
  • 57.
     On theforeign exchange front BOB and SBI have done better than HDFC.  HDFC has the best ALM followed by SBI and ICICI. BOB needs to improve on ALM.  BOB needs to improve on reporting for Basel 2 disclosures of ALM