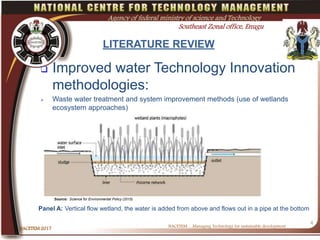
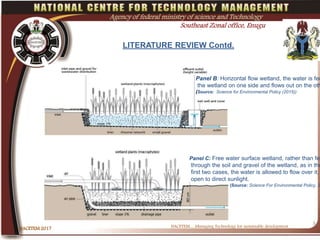
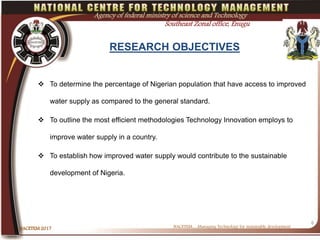
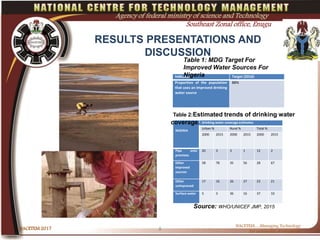
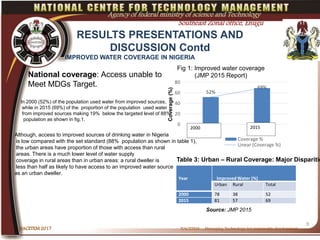
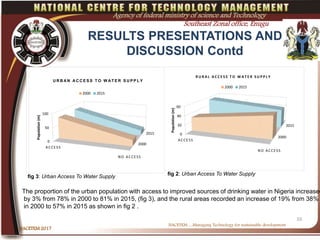
Chime .R.C*., Onyia C. J., Chime R.O
NACETEM 2017
NACETEM….Managing Technology for sustainable development
NACETEM, South East Zonal Office
4, Coal City Gardens, Okpara Avenue,
Enugu.
1
Agency of federal ministry of science and Technology
Southeast Zonal office, Enugu
INTERVENTION OF TECHNOLOGY INNOVATION
FOR SUSTAINABLE WATER DEVELOPMENT IN
NIGERIA.
NACETEM….Managing Technology for sustainable development
NACETEM 2017
2
Agency of federal ministry of science and Technology
Southeast Zonal office, Enugu
 Introduction
 Literature Review
 Research objectives
 Methodology
 Research Results
 Discussion
 Policy Requirements
 Conclusion
INTRODUCTION
 Access to safe and improved water (piped household water connection located inside the
user’s dwelling, plot or yard; and other improved drinking water sources : public taps or
standpipes, tube wells or boreholes, protected dug wells, protected springs, and rainwater
collection) which refers to the percentage of the population using an improved drinking water
source is a major challenge in Nigeria.
 Lack of access to adequate water is responsible for significant outbreaks of diseases such as
cholera and typhoid and include diarrhea, viral hepatitis A, Cholera dysentery
and dracunculiasis (Guineaworm disease), WHO/UNICEF JMP,2015
 Improved water coverage rates are amongst the lowest in the world.
 Nigeria is currently unable to reach the MDG target of 88%
coverage for safe drinking water in the year 2016.
 Improvement of access to clean drinking water boost economic productivity, more education
and health-care savings.
 Most efficient methodologies Technology Innovation employs to improve water supply is not
being accentuated.
NACETEM….Managing Technology for sustainable development
NACETEM 2017NACETEM 2017
3
Agency of federal ministry of science and Technology
Southeast Zonal office, Enugu
LITERATURE REVIEW
 Improved water Technology Innovation
methodologies:
 Waste water treatment and system improvement methods (use of wetlands
ecosystem approaches)
NACETEM….Managing Technology for sustainable development
NACETEM 2017
4
Agency of federal ministry of science and Technology
Southeast Zonal office, Enugu
Source: Science for Environmental Policy (2015)
Panel A: Vertical flow wetland, the water is added from above and flows out in a pipe at the bottom
l
NACETEM….Managing Technology for sustainable development
NACETEM 2017
5
Agency of federal ministry of science and Technology
Southeast Zonal office, Enugu
LITERATURE REVIEW Contd.
Panel B: Horizontal flow wetland, the water is fed
the wetland on one side and flows out on the oth
(Source: Science for Environmental Policy (2015))
Panel C: Free water surface wetland, rather than fed
through the soil and gravel of the wetland, as in the
first two cases, the water is allowed to flow over it,
open to direct sunlight.
(Source: Science For Environmental Policy, 2
RESEARCH OBJECTIVES
 To determine the percentage of Nigerian population that have access to improved
water supply as compared to the general standard.
 To outline the most efficient methodologies Technology Innovation employs to
improve water supply in a country.
 To establish how improved water supply would contribute to the sustainable
development of Nigeria.
NACETEM….Managing Technology for sustainable developmentNACETEM 2017
6
Agency of federal ministry of science and Technology
Southeast Zonal office, Enugu
METHODOLOGY
NACETEM 2017 7
NACETEM….Managing Technology
for sustainable development
Agency of federal ministry of science and Technology
Southeast Zonal office, Enugu
 Descriptive analytical techniques were employed to gather data
originated from secondary sources: previous research and analysis of
scholars, as well as journals articles that are related to the subject.
 Statistical tools: tables, graphs, charts and percentages would be used
for analysis to describe the results of the findings.
RESULTS PRESENTATIONS AND
DISCUSSION
NIGERIA
Drinking water coverage estimates
Urban % Rural % Total %
2000 2015 2000 2015 2000 2015
Pipe onto
premises
20 3 3 1 12 2
Other
improved
sources
58 78 35 56 28 67
Other
unimproved
17 16 26 27 23 21
Surface water 5 3 36 16 37 10
Indicator Target (2016)
Proportion of the population
that uses an improved drinking
water source
88%
NACETEM 2017 8
NACETEM….Managing Technology
for sustainable development
Agency of federal ministry of science and Technology
Southeast Zonal office, Enugu
Table 1: MDG Target For
Improved Water Sources For
Nigeria
Table 2:Estimated trends of drinking water
coverage.
Source: WHO/UNICEF JMP, 2015
RESULTS PRESENTATIONS AND
DISCUSSION Contd
NACETEM 2017
9
NACETEM….Managing Technology for sustainable development
Agency of federal ministry of science and Technology
Southeast Zonal office, Enugu
52%
69%
0
20
40
60
80
1 2
Coverage(%)
Fig 1: Improved water coverage
(JMP 2015 Report)
Coverage %
Linear (Coverage %)
20152000
Year Improved Water (%)
Urban Rural Total
2000 78 38 52
2015 81 57 69
Table 3: Urban – Rural Coverage: Major Disparitie
Source: JMP 2015
IMPROVED WATER COVERAGE IN NIGERIA
National coverage: Access unable to
Meet MDGs Target.
In 2000 (52%) of the population used water from improved sources,
while in 2015 (69%) of the proportion of the population used water
from improved sources making 19% below the targeted level of 88%
population as shown in fig.1.
Although, access to improved sources of drinking water in Nigeria
is low compared with the set standard (88% population as shown in table 1),
the urban areas have proportion of those with access than rural
areas. There is a much lower level of water supply
coverage in rural areas than in urban areas: a rural dweller is
less than half as likely to have access to an improved water source
as an urban dweller.
RESULTS PRESENTATIONS AND
DISCUSSION Contd
NACETEM 2017
10
NACETEM….Managing Technology for sustainable development
Agency of federal ministry of science and Technology
Southeast Zonal office, Enugu
2000
2015
0
20
40
60
ACCESS
NO ACCESS
Population(m)
R U R A L A C C E S S T O W A T E R S U P P L Y
2000 2015
The proportion of the urban population with access to improved sources of drinking water in Nigeria increased
by 3% from 78% in 2000 to 81% in 2015, (fig 3), and the rural areas recorded an increase of 19% from 38%
in 2000 to 57% in 2015 as shown in fig 2 .
fig 3: Urban Access To Water Supply fig 2: Urban Access To Water Supply
2000
2015
0
50
100
ACCESS
NO ACCESS
Population(m)
U R B A N A C C E S S T O W A T E R S U P P L Y
2000 2015
CONCLUSION/POLICY
RECOMMENDATIONS
 Available data and coverage estimates show that improved drinking water coverage rates are low
in Nigeria.
 Technology innovation methodologies present opportunities to achieve greater progress toward
clean and safe water substantially faster with significantly less cost and energy consumption.
 Technology innovation can be a means to assure that future actions are more sustainable and be an
economic driver, help businesses thrive, create jobs and be a source of Nigeria exports.
 Nigeria needs to revisit sector investment levels and patterns, and encourage civil, and community
participation towards the application of technology innovation methodology.
 Government should strengthen the State and Local Government councils so that they can fulfil
their mandate in the water sector.
 There is need for a joint sector review to enable the sector partners take stock of the country
development and strategise for accelerated progress if we are to meet the MDG targets on water
supply.
NACETEM….Managing Technology for sustainable development
NACETEM 2017
11
Agency of federal ministry of science and Technology
Southeast Zonal office, Enugu
NACETEM….Managing Technology for sustainable development
Thank you for your kind
attention
NACETEM 2017
12
Agency of federal ministry of science and Technology
Southeast Zonal office, Enugu

ICESD Conference Paper 25

  • 1.
    Chime .R.C*., OnyiaC. J., Chime R.O NACETEM 2017 NACETEM….Managing Technology for sustainable development NACETEM, South East Zonal Office 4, Coal City Gardens, Okpara Avenue, Enugu. 1 Agency of federal ministry of science and Technology Southeast Zonal office, Enugu INTERVENTION OF TECHNOLOGY INNOVATION FOR SUSTAINABLE WATER DEVELOPMENT IN NIGERIA.
  • 2.
    NACETEM….Managing Technology forsustainable development NACETEM 2017 2 Agency of federal ministry of science and Technology Southeast Zonal office, Enugu  Introduction  Literature Review  Research objectives  Methodology  Research Results  Discussion  Policy Requirements  Conclusion
  • 3.
    INTRODUCTION  Access tosafe and improved water (piped household water connection located inside the user’s dwelling, plot or yard; and other improved drinking water sources : public taps or standpipes, tube wells or boreholes, protected dug wells, protected springs, and rainwater collection) which refers to the percentage of the population using an improved drinking water source is a major challenge in Nigeria.  Lack of access to adequate water is responsible for significant outbreaks of diseases such as cholera and typhoid and include diarrhea, viral hepatitis A, Cholera dysentery and dracunculiasis (Guineaworm disease), WHO/UNICEF JMP,2015  Improved water coverage rates are amongst the lowest in the world.  Nigeria is currently unable to reach the MDG target of 88% coverage for safe drinking water in the year 2016.  Improvement of access to clean drinking water boost economic productivity, more education and health-care savings.  Most efficient methodologies Technology Innovation employs to improve water supply is not being accentuated. NACETEM….Managing Technology for sustainable development NACETEM 2017NACETEM 2017 3 Agency of federal ministry of science and Technology Southeast Zonal office, Enugu
  • 4.
    LITERATURE REVIEW  Improvedwater Technology Innovation methodologies:  Waste water treatment and system improvement methods (use of wetlands ecosystem approaches) NACETEM….Managing Technology for sustainable development NACETEM 2017 4 Agency of federal ministry of science and Technology Southeast Zonal office, Enugu Source: Science for Environmental Policy (2015) Panel A: Vertical flow wetland, the water is added from above and flows out in a pipe at the bottom
  • 5.
    l NACETEM….Managing Technology forsustainable development NACETEM 2017 5 Agency of federal ministry of science and Technology Southeast Zonal office, Enugu LITERATURE REVIEW Contd. Panel B: Horizontal flow wetland, the water is fed the wetland on one side and flows out on the oth (Source: Science for Environmental Policy (2015)) Panel C: Free water surface wetland, rather than fed through the soil and gravel of the wetland, as in the first two cases, the water is allowed to flow over it, open to direct sunlight. (Source: Science For Environmental Policy, 2
  • 6.
    RESEARCH OBJECTIVES  Todetermine the percentage of Nigerian population that have access to improved water supply as compared to the general standard.  To outline the most efficient methodologies Technology Innovation employs to improve water supply in a country.  To establish how improved water supply would contribute to the sustainable development of Nigeria. NACETEM….Managing Technology for sustainable developmentNACETEM 2017 6 Agency of federal ministry of science and Technology Southeast Zonal office, Enugu
  • 7.
    METHODOLOGY NACETEM 2017 7 NACETEM….ManagingTechnology for sustainable development Agency of federal ministry of science and Technology Southeast Zonal office, Enugu  Descriptive analytical techniques were employed to gather data originated from secondary sources: previous research and analysis of scholars, as well as journals articles that are related to the subject.  Statistical tools: tables, graphs, charts and percentages would be used for analysis to describe the results of the findings.
  • 8.
    RESULTS PRESENTATIONS AND DISCUSSION NIGERIA Drinkingwater coverage estimates Urban % Rural % Total % 2000 2015 2000 2015 2000 2015 Pipe onto premises 20 3 3 1 12 2 Other improved sources 58 78 35 56 28 67 Other unimproved 17 16 26 27 23 21 Surface water 5 3 36 16 37 10 Indicator Target (2016) Proportion of the population that uses an improved drinking water source 88% NACETEM 2017 8 NACETEM….Managing Technology for sustainable development Agency of federal ministry of science and Technology Southeast Zonal office, Enugu Table 1: MDG Target For Improved Water Sources For Nigeria Table 2:Estimated trends of drinking water coverage. Source: WHO/UNICEF JMP, 2015
  • 9.
    RESULTS PRESENTATIONS AND DISCUSSIONContd NACETEM 2017 9 NACETEM….Managing Technology for sustainable development Agency of federal ministry of science and Technology Southeast Zonal office, Enugu 52% 69% 0 20 40 60 80 1 2 Coverage(%) Fig 1: Improved water coverage (JMP 2015 Report) Coverage % Linear (Coverage %) 20152000 Year Improved Water (%) Urban Rural Total 2000 78 38 52 2015 81 57 69 Table 3: Urban – Rural Coverage: Major Disparitie Source: JMP 2015 IMPROVED WATER COVERAGE IN NIGERIA National coverage: Access unable to Meet MDGs Target. In 2000 (52%) of the population used water from improved sources, while in 2015 (69%) of the proportion of the population used water from improved sources making 19% below the targeted level of 88% population as shown in fig.1. Although, access to improved sources of drinking water in Nigeria is low compared with the set standard (88% population as shown in table 1), the urban areas have proportion of those with access than rural areas. There is a much lower level of water supply coverage in rural areas than in urban areas: a rural dweller is less than half as likely to have access to an improved water source as an urban dweller.
  • 10.
    RESULTS PRESENTATIONS AND DISCUSSIONContd NACETEM 2017 10 NACETEM….Managing Technology for sustainable development Agency of federal ministry of science and Technology Southeast Zonal office, Enugu 2000 2015 0 20 40 60 ACCESS NO ACCESS Population(m) R U R A L A C C E S S T O W A T E R S U P P L Y 2000 2015 The proportion of the urban population with access to improved sources of drinking water in Nigeria increased by 3% from 78% in 2000 to 81% in 2015, (fig 3), and the rural areas recorded an increase of 19% from 38% in 2000 to 57% in 2015 as shown in fig 2 . fig 3: Urban Access To Water Supply fig 2: Urban Access To Water Supply 2000 2015 0 50 100 ACCESS NO ACCESS Population(m) U R B A N A C C E S S T O W A T E R S U P P L Y 2000 2015
  • 11.
    CONCLUSION/POLICY RECOMMENDATIONS  Available dataand coverage estimates show that improved drinking water coverage rates are low in Nigeria.  Technology innovation methodologies present opportunities to achieve greater progress toward clean and safe water substantially faster with significantly less cost and energy consumption.  Technology innovation can be a means to assure that future actions are more sustainable and be an economic driver, help businesses thrive, create jobs and be a source of Nigeria exports.  Nigeria needs to revisit sector investment levels and patterns, and encourage civil, and community participation towards the application of technology innovation methodology.  Government should strengthen the State and Local Government councils so that they can fulfil their mandate in the water sector.  There is need for a joint sector review to enable the sector partners take stock of the country development and strategise for accelerated progress if we are to meet the MDG targets on water supply. NACETEM….Managing Technology for sustainable development NACETEM 2017 11 Agency of federal ministry of science and Technology Southeast Zonal office, Enugu
  • 12.
    NACETEM….Managing Technology forsustainable development Thank you for your kind attention NACETEM 2017 12 Agency of federal ministry of science and Technology Southeast Zonal office, Enugu

Editor's Notes

  • #8 Science and Technology (S&T) combine human knowledge with the ability to produce and use tools and machines in order to solve real life problems.