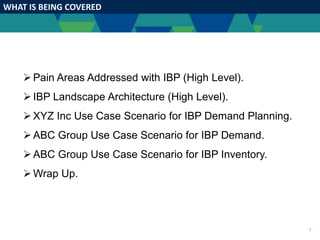
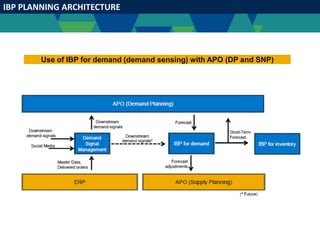
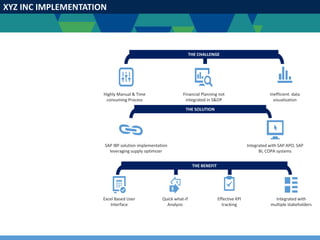
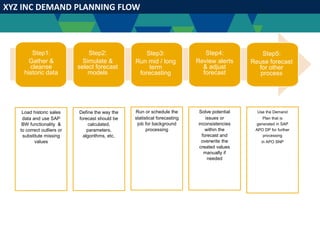
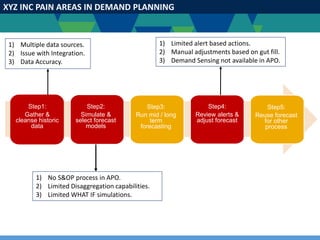
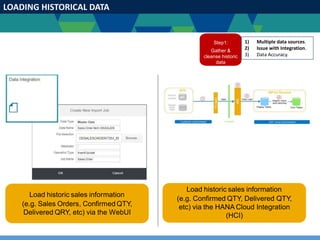
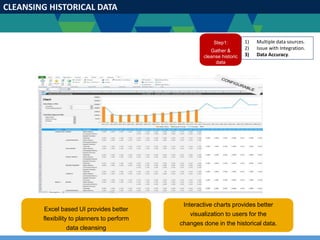
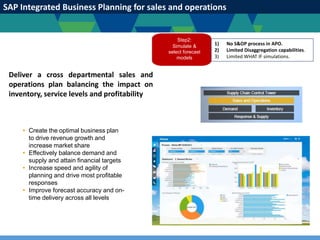
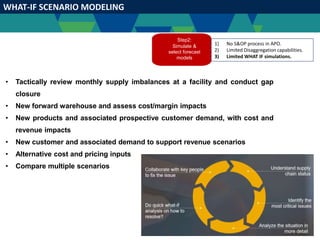
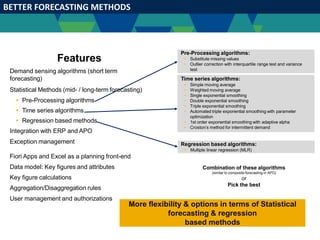
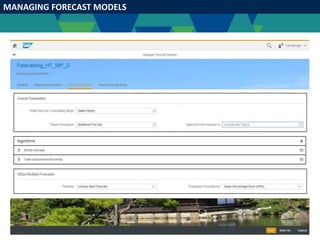
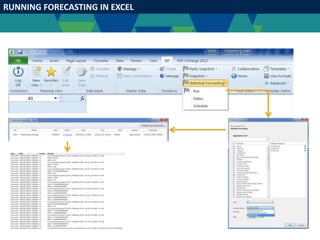
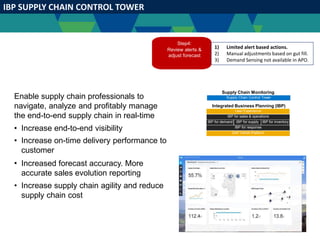
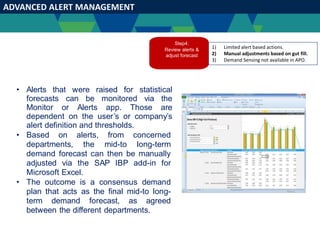
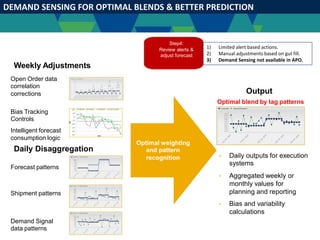
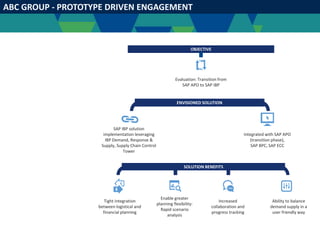
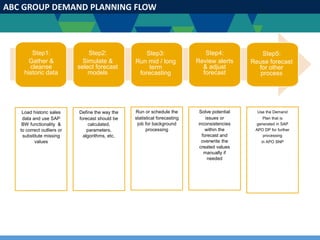
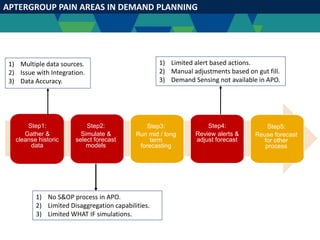
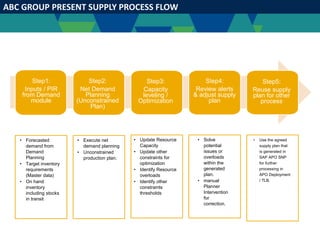
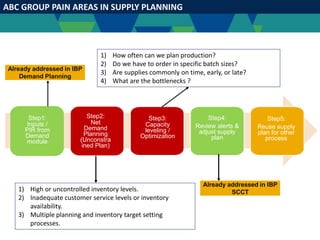
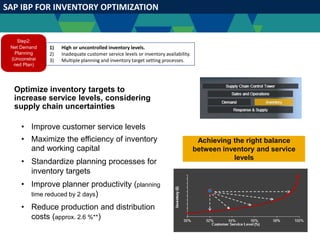
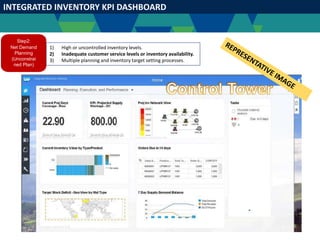
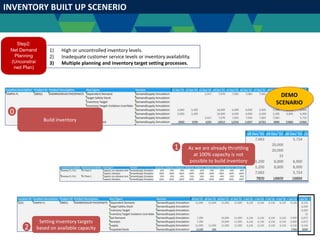
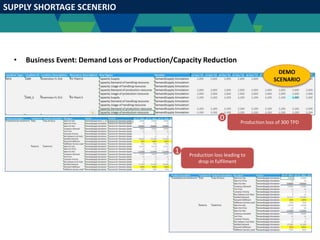
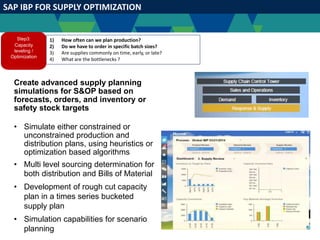
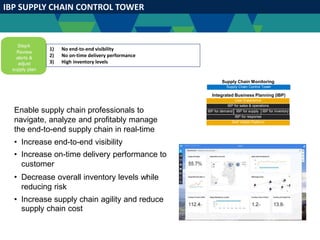
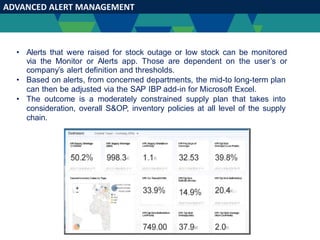
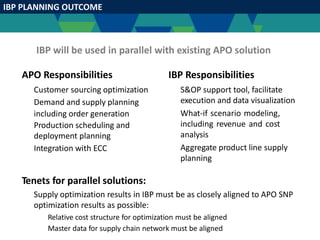
SAP IBP can address pain areas in demand and supply planning for ABC Group. IBP allows gathering and cleansing historic data from multiple sources. It offers improved forecasting methods like demand sensing and statistical algorithms. IBP enables what-if scenario modeling and integrated inventory KPI dashboards. Alerts can be better managed to adjust forecasts and plans. IBP provides supply optimization and a supply chain control tower for end-to-end visibility. IBP would be implemented in parallel with APO, with master data and optimization results closely aligned between the two systems.
SAP IBP Use Case Scenarios for Demand and Inventory Planning
1. SAP IBP USE CASE SCENERIOS
Presenter: Ayan Bishnu
2. 2
WHAT IS BEING COVERED
Pain Areas Addressed with IBP (High Level).
IBP Landscape Architecture (High Level).
XYZ Inc Use Case Scenario for IBP Demand Planning.
ABC Group Use Case Scenario for IBP Demand.
ABC Group Use Case Scenario for IBP Inventory.
Wrap Up.
3. AREAS ADDRESSED WITH IBP ( A HAWK EYE VIEW )
Operational Validation Demand Validation
Demand and Supply Review S&OP Meeting
5. XYZ INC IMPLEMENTATION
THE CHALLENGE
Highly Manual & Time
consuming Process
Financial Planning not
integrated in S&OP
Inefficient data
visualization
THE SOLUTION
SAP IBP solution implementation
leveraging supply optimizer
Integrated with SAP APO, SAP
BI, COPA systems
THE BENEFIT
Excel Based User
Interface
Effective KPI
tracking
Integrated with
multiple stakeholders
Quick what-if
Analysis
6. XYZ INC DEMAND PLANNING FLOW
Step1:
Gather &
cleanse
historic data
Run or schedule the
statistical forecasting
job for background
processing
Solve potential
issues or
inconsistencies
within the
forecast and
overwrite the
created values
manually if
needed
Use the Demand
Plan that is
generated in SAP
APO DP for further
processing
in APO SNP
Load historic sales
data and use SAP
BW functionality &
to correct outliers or
substitute missing
values
Define the way the
forecast should be
calculated,
parameters,
algorithms, etc.
Step2:
Simulate &
select forecast
models
Step3:
Run mid / long
term
forecasting
Step4:
Review alerts
& adjust
forecast
Step5:
Reuse forecast
for other
process
7. XYZ INC PAIN AREAS IN DEMAND PLANNING
Step1:
Gather &
cleanse historic
data
Step2:
Simulate &
select forecast
models
Step3:
Run mid / long
term
forecasting
Step4:
Review alerts &
adjust forecast
Step5:
Reuse forecast
for other
process
1) Multiple data sources.
2) Issue with Integration.
3) Data Accuracy.
1) No S&OP process in APO.
2) Limited Disaggregation capabilities.
3) Limited WHAT IF simulations.
1) Limited alert based actions.
2) Manual adjustments based on gut fill.
3) Demand Sensing not available in APO.
8. LOADING HISTORICAL DATA
Step2:
Simulate &
select forecast
models
Load historic sales information
(e.g. Confirmed QTY, Delivered QTY,
etc) via the HANA Cloud Integration
(HCI)
Load historic sales information
(e.g. Sales Orders, Confirmed QTY,
Delivered QRY, etc) via the WebUI
Step1:
Gather &
cleanse historic
data
1) Multiple data sources.
2) Issue with Integration.
3) Data Accuracy.
9. CLEANSING HISTORICAL DATA
Step2:
Simulate &
select forecast
models
Step3:
Run mid / long
term
forecasting
Step4:
Review alerts &
adjust forecast
Interactive charts provides better
visualization to users for the
changes done in the historical data.
Excel based UI provides better
flexibility to planners to perform
data cleansing
Step1:
Gather &
cleanse historic
data
1) Multiple data sources.
2) Issue with Integration.
3) Data Accuracy.
10. SAP Integrated Business Planning for sales and operations
Create the optimal business plan
to drive revenue growth and
increase market share
Effectively balance demand and
supply and attain financial targets
Increase speed and agility of
planning and drive most profitable
responses
Improve forecast accuracy and on-
time delivery across all levels
Deliver a cross departmental sales and
operations plan balancing the impact on
inventory, service levels and profitability
Step2:
Simulate &
select forecast
models
1) No S&OP process in APO.
2) Limited Disaggregation capabilities.
3) Limited WHAT IF simulations.
11. WHAT-IF SCENARIO MODELING
• Tactically review monthly supply imbalances at a facility and conduct gap
closure
• New forward warehouse and assess cost/margin impacts
• New products and associated prospective customer demand, with cost and
revenue impacts
• New customer and associated demand to support revenue scenarios
• Alternative cost and pricing inputs
• Compare multiple scenarios
Step2:
Simulate &
select forecast
models
1) No S&OP process in APO.
2) Limited Disaggregation capabilities.
3) Limited WHAT IF simulations.
12. BETTER FORECASTING METHODS
Features
Demand sensing algorithms (short term
forecasting)
Statistical Methods (mid- / long-term forecasting)
Pre-Processing algorithms
Time series algorithms
Regression based methods
Integration with ERP and APO
Exception management
Fiori Apps and Excel as a planning front-end
Data model: Key figures and attributes
Key figure calculations
Aggregation/Disaggregation rules
User management and authorizations
Pre-Processing algorithms:
Substitute missing values
Outlier correction with interquartile range test and variance
test
Time series algorithms:
Simple moving average
Weighted moving average
Single exponential smoothing
Double exponential smoothing
Triple exponential smoothing
Automated triple exponential smoothing with parameter
optimization
1st order exponential smoothing with adaptive alpha
Croston’s method for intermittent demand
Combination of these algorithms
(similar to composite forecasting in APO)
or
Pick the best
Regression based algorithms:
Multiple linear regression (MLR)
More flexibility & options in terms of Statistical
forecasting & regression
based methods
15. IBP SUPPLY CHAIN CONTROL TOWER
Supply Chain Monitoring
Enable supply chain professionals to
navigate, analyze and profitably manage
the end-to-end supply chain in real-time
Integrated Business Planning (IBP)
•
•
Increase end-to-end visibility
Increase on-time delivery performance to
customer
Increased forecast accuracy. More
accurate sales evolution reporting
•
• Increase supply chain agility and reduce
supply chain cost
User Experience
IBP for sales & operations
IBP for demand IBP for supply IBP for inventory
IBP for response
SAP HANA Platform
Supply Chain Control Tower
Step4:
Review alerts &
adjust forecast
1) Limited alert based actions.
2) Manual adjustments based on gut fill.
3) Demand Sensing not available in APO.
16. ADVANCED ALERT MANAGEMENT
• Alerts that were raised for statistical
forecasts can be monitored via the
Monitor or Alerts app. Those are
dependent on the user’s or company’s
alert definition and thresholds.
• Based on alerts, from concerned
departments, the mid-to long-term
demand forecast can then be manually
adjusted via the SAP IBP add-in for
Microsoft Excel.
• The outcome is a consensus demand
plan that acts as the final mid-to long-
term demand forecast, as agreed
between the different departments.
Step4:
Review alerts &
adjust forecast
1) Limited alert based actions.
2) Manual adjustments based on gut fill.
3) Demand Sensing not available in APO.
17. DEMAND SENSING FOR OPTIMAL BLENDS & BETTER PREDICTION
Weekly Adjustments
Open Order data
correlation
corrections Output
Optimal blend by lag patterns
Bias Tracking
Controls
Intelligent forecast
consumption logic
Optimal weighting
and pattern
recognition
Daily Disaggregation
Daily outputs for execution
systems
Aggregated weekly or
monthly values for
planning and reporting
Bias and variability
calculations
•
Forecast patterns
•
Shipment patterns
•
Demand Signal
data patterns
Step4:
Review alerts &
adjust forecast
1) Limited alert based actions.
2) Manual adjustments based on gut fill.
3) Demand Sensing not available in APO.
18. DEMAND SENSING USING EXCEL
Navigation for demand Sensing Issues
from the Fiori Launchpad
19. ABC GROUP - PROTOTYPE DRIVEN ENGAGEMENT
OBJECTIVE
Evaluation: Transition from
SAP APO to SAP IBP
Integrated with SAP APO
(transition phase),
SAP BPC, SAP ECC
ENVISIONED SOLUTION
SAP IBP solution
implementation leveraging
IBP Demand, Response &
Supply, Supply Chain Control
Tower
SOLUTION BENEFITS
Tight integration
between logistical and
financial planning
Increased
collaboration and
progress tracking
Ability to balance
demand supply in a
user friendly way
Enable greater
planning flexibility:
Rapid scenario
analysis
20. ABC GROUP DEMAND PLANNING FLOW
Step1:
Gather &
cleanse
historic data
Run or schedule the
statistical forecasting
job for background
processing
Solve potential
issues or
inconsistencies
within the
forecast and
overwrite the
created values
manually if
needed
Use the Demand
Plan that is
generated in SAP
APO DP for further
processing
in APO SNP
Load historic sales
data and use SAP
BW functionality &
to correct outliers or
substitute missing
values
Define the way the
forecast should be
calculated,
parameters,
algorithms, etc.
Step2:
Simulate &
select forecast
models
Step3:
Run mid / long
term
forecasting
Step4:
Review alerts
& adjust
forecast
Step5:
Reuse forecast
for other
process
21. APTERGROUP PAIN AREAS IN DEMAND PLANNING
Step1:
Gather &
cleanse historic
data
Step2:
Simulate &
select forecast
models
Step3:
Run mid / long
term
forecasting
Step4:
Review alerts &
adjust forecast
Step5:
Reuse forecast
for other
process
1) Multiple data sources.
2) Issue with Integration.
3) Data Accuracy.
1) No S&OP process in APO.
2) Limited Disaggregation capabilities.
3) Limited WHAT IF simulations.
1) Limited alert based actions.
2) Manual adjustments based on gut fill.
3) Demand Sensing not available in APO.
22. ABC GROUP PRESENT SUPPLY PROCESS FLOW
Step1:
Inputs / PIR
from Demand
module
• Update Resource
Capacity
• Update other
constraints for
optimization
• Identify Resource
overloads
• Identify other
constraints
thresholds
• Solve
potential
issues or
overloads
within the
generated
plan.
• manual
Planner
Intervention
for
correction.
• Use the agreed
supply plan that
is generated in
SAP APO SNP
for further
processing in
APO Deployment
/ TLB.
• Forecasted
demand from
Demand
Planning
• Target inventory
requirements
(Master data)
• On hand
inventory
including stocks
in transit
• Execute net
demand planning
• Unconstrained
production plan.
Step2:
Net Demand
Planning
(Unconstrained
Plan)
Step3:
Capacity
leveling /
Optimization
Step4:
Review alerts
& adjust supply
plan
Step5:
Reuse supply
plan for other
process
23. ABC GROUP PAIN AREAS IN SUPPLY PLANNING
Step1:
Inputs /
PIR from
Demand
module
Step2:
Net
Demand
Planning
(Unconstra
ined Plan)
Step3:
Capacity
leveling /
Optimization
Step4:
Review alerts &
adjust supply
plan
Step5:
Reuse supply
plan for other
process
1) High or uncontrolled inventory levels.
2) Inadequate customer service levels or inventory
availability.
3) Multiple planning and inventory target setting
processes.
1) How often can we plan production?
2) Do we have to order in specific batch sizes?
3) Are supplies commonly on time, early, or late?
4) What are the bottlenecks ?
Already addressed in IBP
Demand Planning
Already addressed in IBP
SCCT
24. SAP IBP FOR INVENTORY OPTIMIZATION
Optimize inventory targets to
increase service levels, considering
supply chain uncertainties
• Improve customer service levels
• Maximize the efficiency of inventory
and working capital
• Standardize planning processes for
inventory targets
• Improve planner productivity (planning
time reduced by 2 days)
• Reduce production and distribution
costs (approx. 2.6 %**)
Achieving the right balance
between inventory and service
levels
Step2:
Net Demand
Planning
(Unconstrai
ned Plan)
1) High or uncontrolled inventory levels.
2) Inadequate customer service levels or inventory availability.
3) Multiple planning and inventory target setting processes.
25. INTEGRATED INVENTORY KPI DASHBOARD
Step2:
Net Demand
Planning
(Unconstrai
ned Plan)
1) High or uncontrolled inventory levels.
2) Inadequate customer service levels or inventory availability.
3) Multiple planning and inventory target setting processes.
26. INVENTORY BUILT UP SCENERIO
Build inventory
0
As we are already throttling
at 100% capacity is not
possible to build inventory
1
Setting inventory targets
based on available capacity2
DEMO
SCENARIO
Step2:
Net Demand
Planning
(Unconstrai
ned Plan)
1) High or uncontrolled inventory levels.
2) Inadequate customer service levels or inventory availability.
3) Multiple planning and inventory target setting processes.
27. SUPPLY SHORTAGE SCENERIO
• Business Event: Demand Loss or Production/Capacity Reduction
Production loss leading to
drop in fulfilment
1
Production loss of 300 TPD
0
DEMO
SCENARIO
28. SAP IBP FOR SUPPLY OPTIMIZATION
Create advanced supply planning
simulations for S&OP based on
forecasts, orders, and inventory or
safety stock targets
• Simulate either constrained or
unconstrained production and
distribution plans, using heuristics or
optimization based algorithms
• Multi level sourcing determination for
both distribution and Bills of Material
• Development of rough cut capacity
plan in a times series bucketed
supply plan
• Simulation capabilities for scenario
planning
Step3:
Capacity
leveling /
Optimization
1) How often can we plan production?
2) Do we have to order in specific batch sizes?
3) Are supplies commonly on time, early, or late?
4) What are the bottlenecks ?
29. PRODUCTION / RESOURCE VIEW
• Analyze Production Goods Receipt and Issue in Daily Buckets
• Ability to Review Resource Capacities and Consumption
30. WAREHOUSE VIEW
• Analyze Warehouse Goods Issue and Receipt along with Inventory Targets and
Projections
31. SOURCING VIEW
• Ability to Track Sources Among Locations and Between Customer and Locations
Step3:
Capacity
leveling /
Optimization
1) How often can we plan production?
2) Do we have to order in specific batch sizes?
3) Are supplies commonly on time, early, or late?
4) What are the bottlenecks ?
32. OPTIMIZER COST VIEW
• Ability to build ahead only runner items as there is more certainty of demand
Step3:
Capacity
leveling /
Optimization
1) How often can we plan production?
2) Do we have to order in specific batch sizes?
3) Are supplies commonly on time, early, or late?
4) What are the bottlenecks ?
33. IBP SUPPLY CHAIN CONTROL TOWER
Supply Chain Monitoring
Enable supply chain professionals to
navigate, analyze and profitably manage
the end-to-end supply chain in real-time
Integrated Business Planning (IBP)
•
•
Increase end-to-end visibility
Increase on-time delivery performance to
customer
Decrease overall inventory levels while
reducing risk
•
• Increase supply chain agility and reduce
supply chain cost
User Experience
IBP for sales & operations
IBP for demand IBP for supply IBP for inventory
IBP for response
SAP HANA Platform
Supply Chain Control Tower
Step4:
Review
alerts &
adjust
supply plan
1) No end-to-end visibility
2) No on-time delivery performance
3) High inventory levels
34. ADVANCED ALERT MANAGEMENT
• Alerts that were raised for stock outage or low stock can be monitored
via the Monitor or Alerts app. Those are dependent on the user’s or
company’s alert definition and thresholds.
• Based on alerts, from concerned departments, the mid-to long-term plan
can then be adjusted via the SAP IBP add-in for Microsoft Excel.
• The outcome is a moderately constrained supply plan that takes into
consideration, overall S&OP, inventory policies at all level of the supply
chain.
35. IBP PLANNING OUTCOME
IBP will be used in parallel with existing APO solution
APO Responsibilities IBP Responsibilities
Customer sourcing optimization
Demand and supply planning
including order generation
Production scheduling and
deployment planning
Integration with ECC
S&OP support tool, facilitate
execution and data visualization
What-if scenario modeling,
including revenue and cost
analysis
Aggregate product line supply
planning
Tenets for parallel solutions:
Supply optimization results in IBP must be as closely aligned to APO SNP
optimization results as possible:
Relative cost structure for optimization must be aligned
Master data for supply chain network must be aligned
36. IBP JOURNEY – OVERALL IMPRESSIONS
• User interface – both Excel and Web UI easier to learn than
other traditional SAP applications
• Merging supply chain, commercial and financial information
can be challenging
• Business needs to agree on fundamentals of how the data
aligns between each group
• Level of detail required by all groups needs to be considered
up front to ensure proper design and configuration
37. IBP JOURNEY – OVERALL IMPRESSIONS
• Data integration always takes extra time and refinement
• Data modeling differences between IBP and APO to
overcome
• Some learning curve with aggregating/disaggregating
planning views
within
• Data management can be underestimated –
•
•
Need to consider full lifecycle of data in the design
IBP is really both a planning tool and a reporting/analytics
tool all in one
38. IBP JOURNEY – EARLY SUCCESSES
• Excessive downtime issue was discovered and corrected within minutes in
IBP. This allowed business to move forward in addressing capacity questions
and building a scenario.
Able to make quick changes to demand and see impact to supply which has
saved hours of work for the Demand Planner.
Completed several what-if analysis scenarios which provided very realistic
output on impact to gross profit and results shared in Executive review
process.
Provided decision support on a project factoring in things like a new
location, new demand, and sourcing changes.
As proficiency continues to build expect to do scenarios and gross
profit/margin analysis much more efficiently than in the past.
•
•
•
•
•
24
“All in all we are feeling pretty excited about what we will be
able to accomplish.” {Operational Planning Manager in XYZ INC}