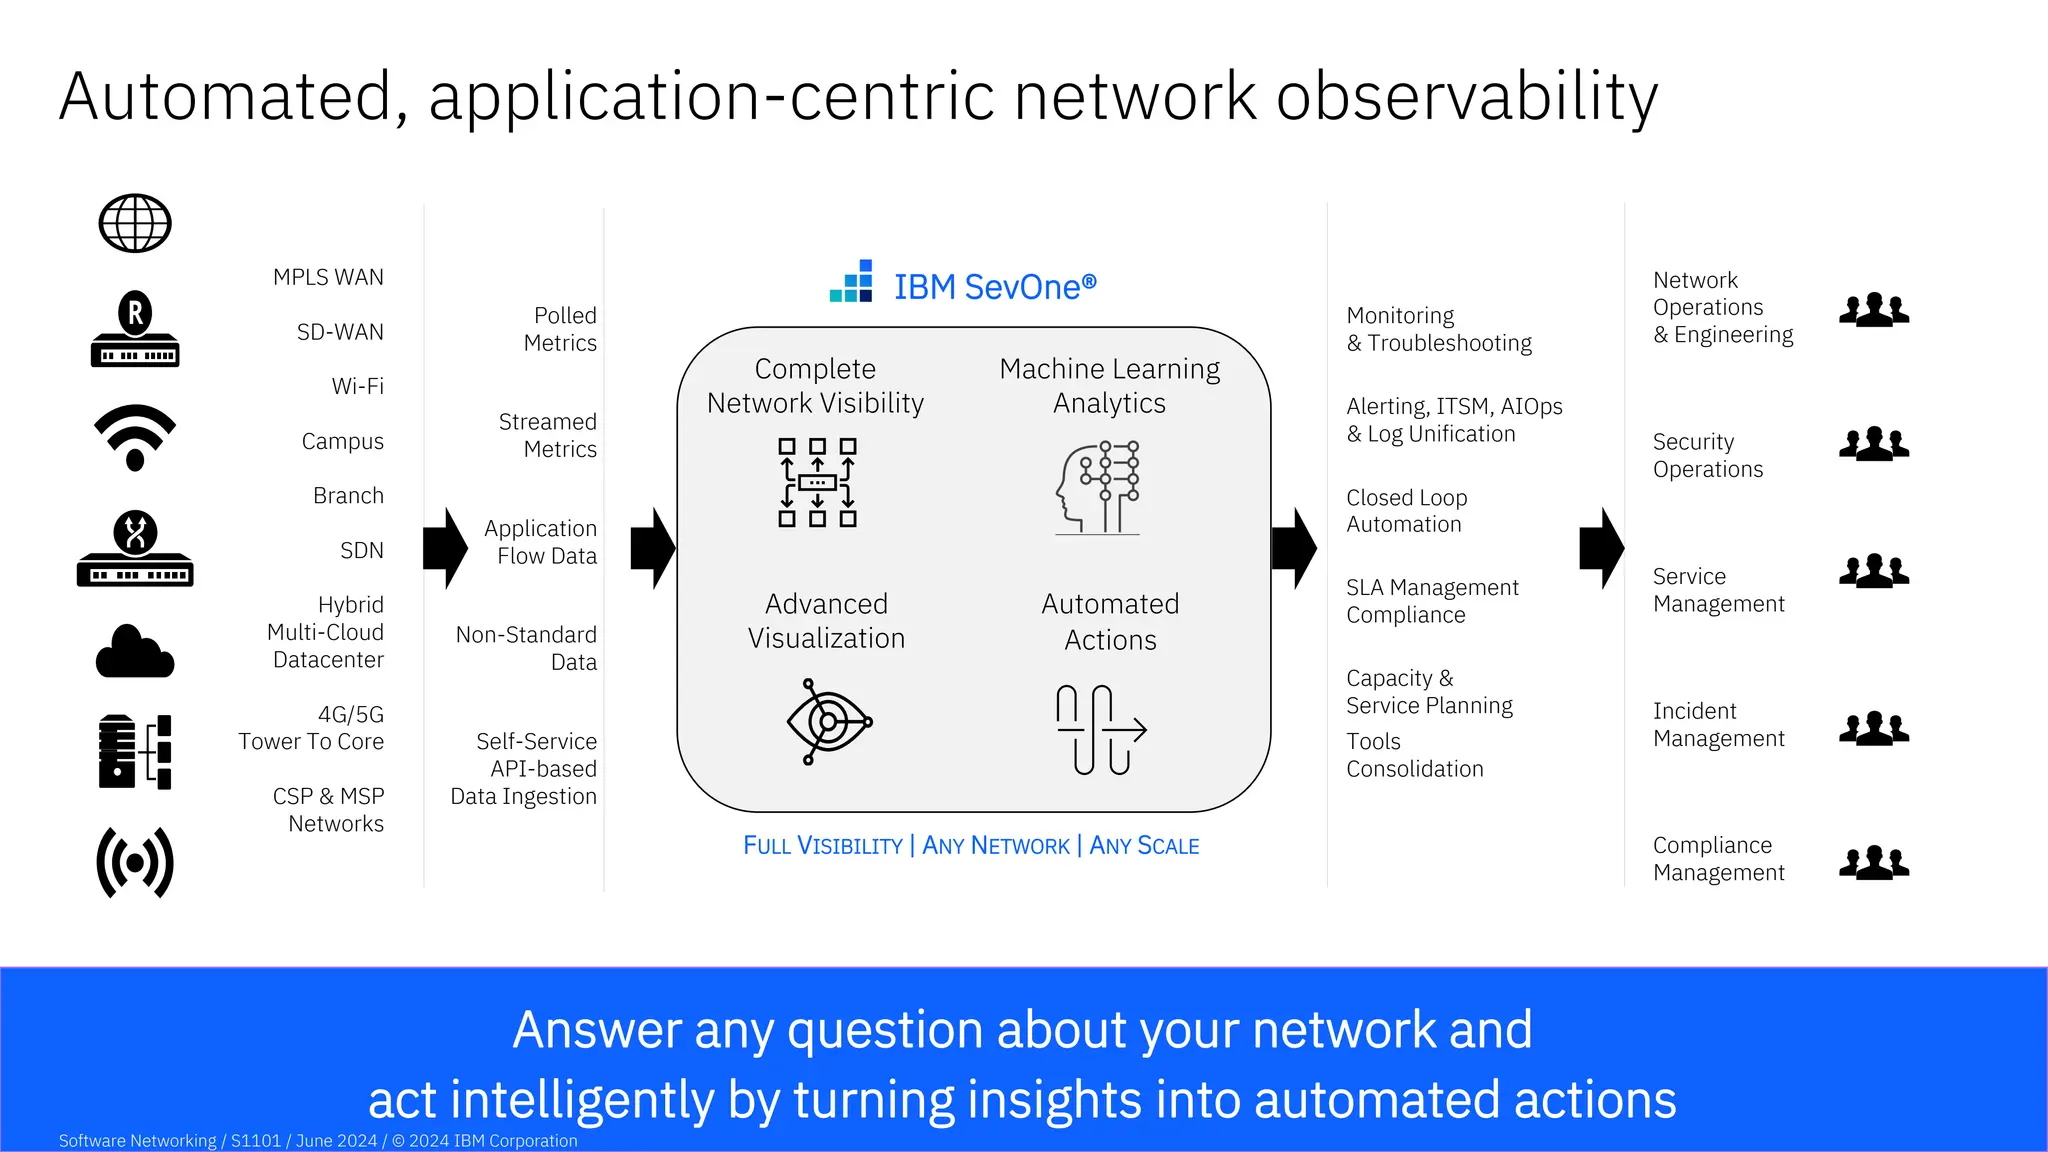
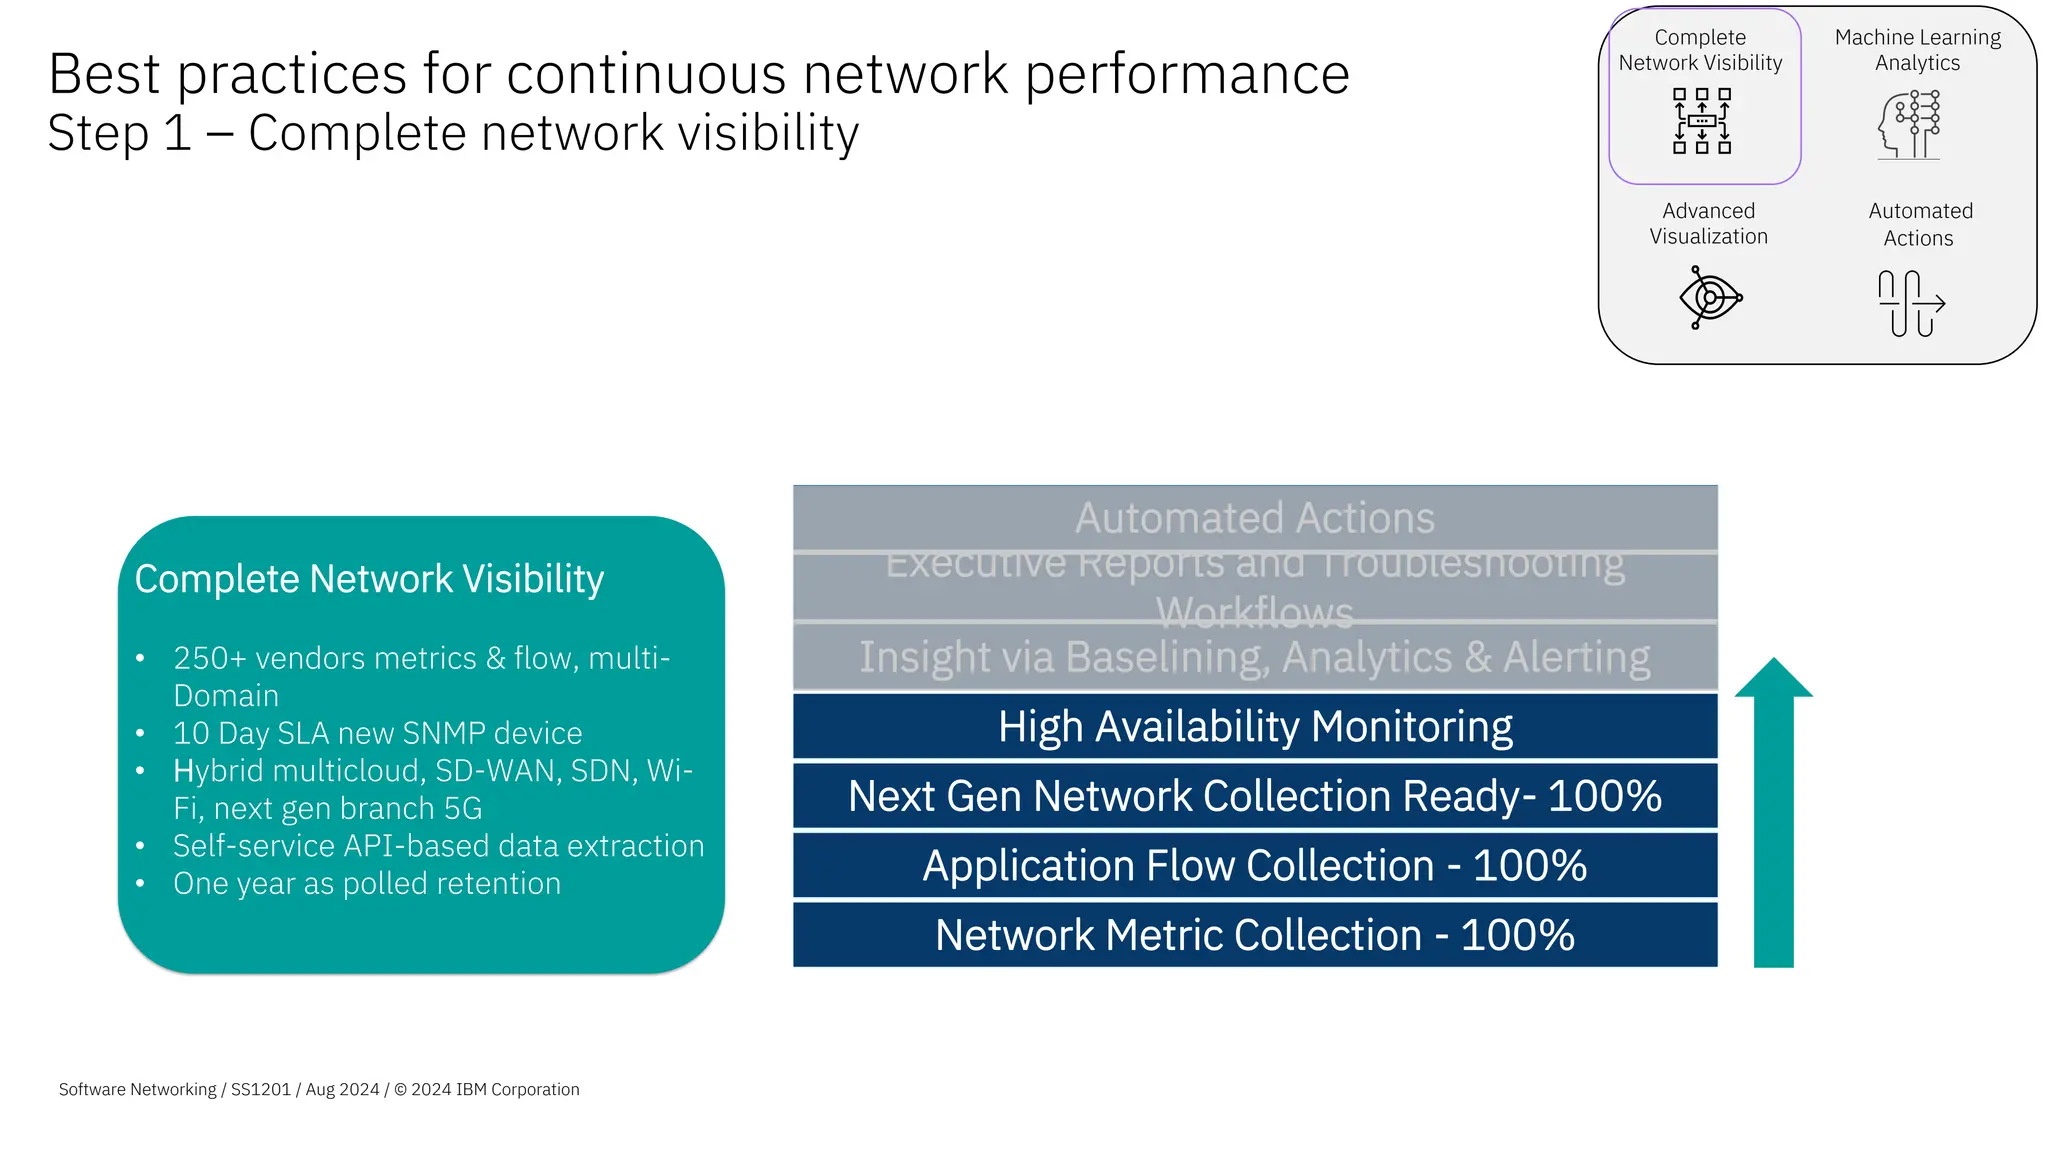
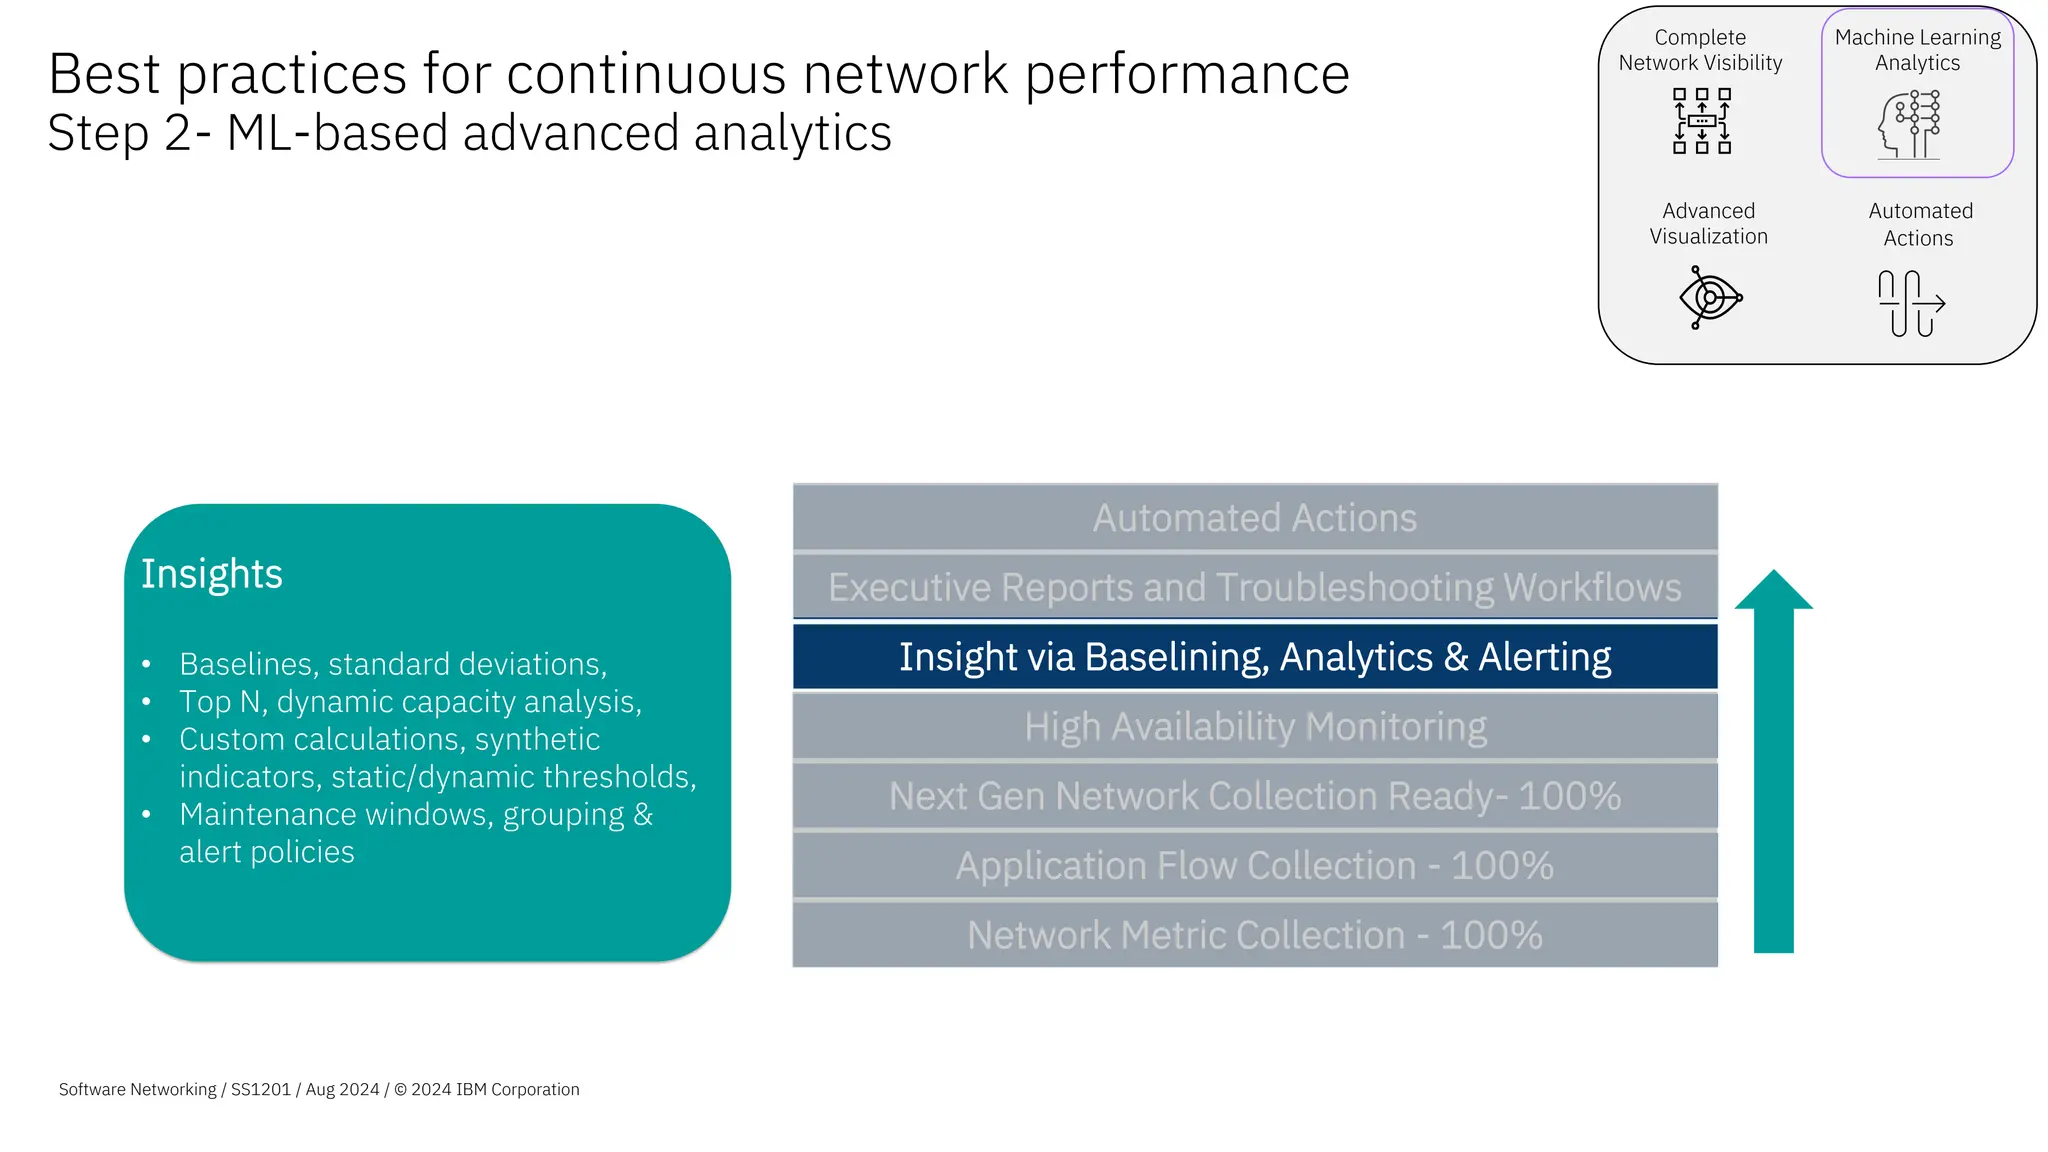
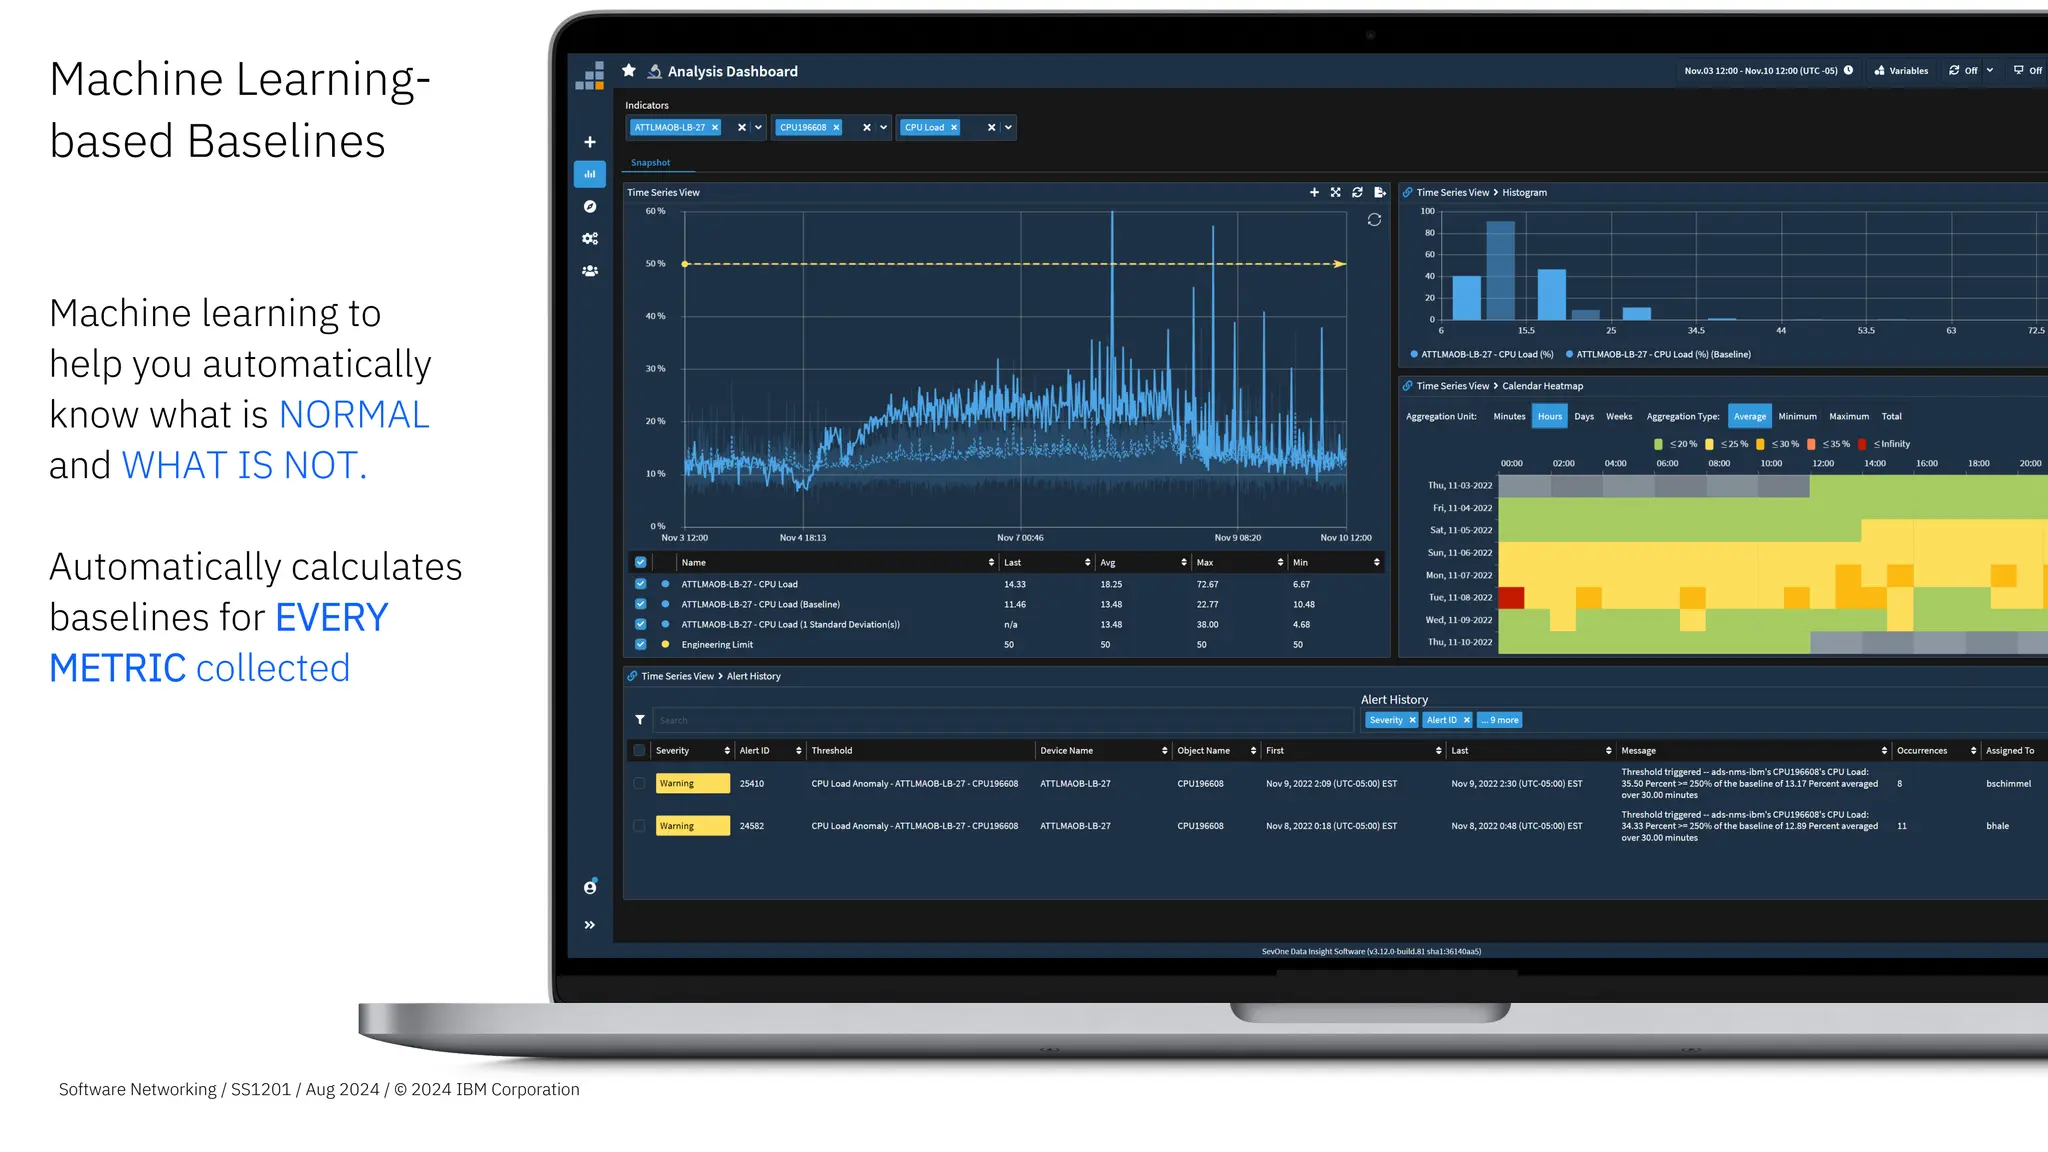
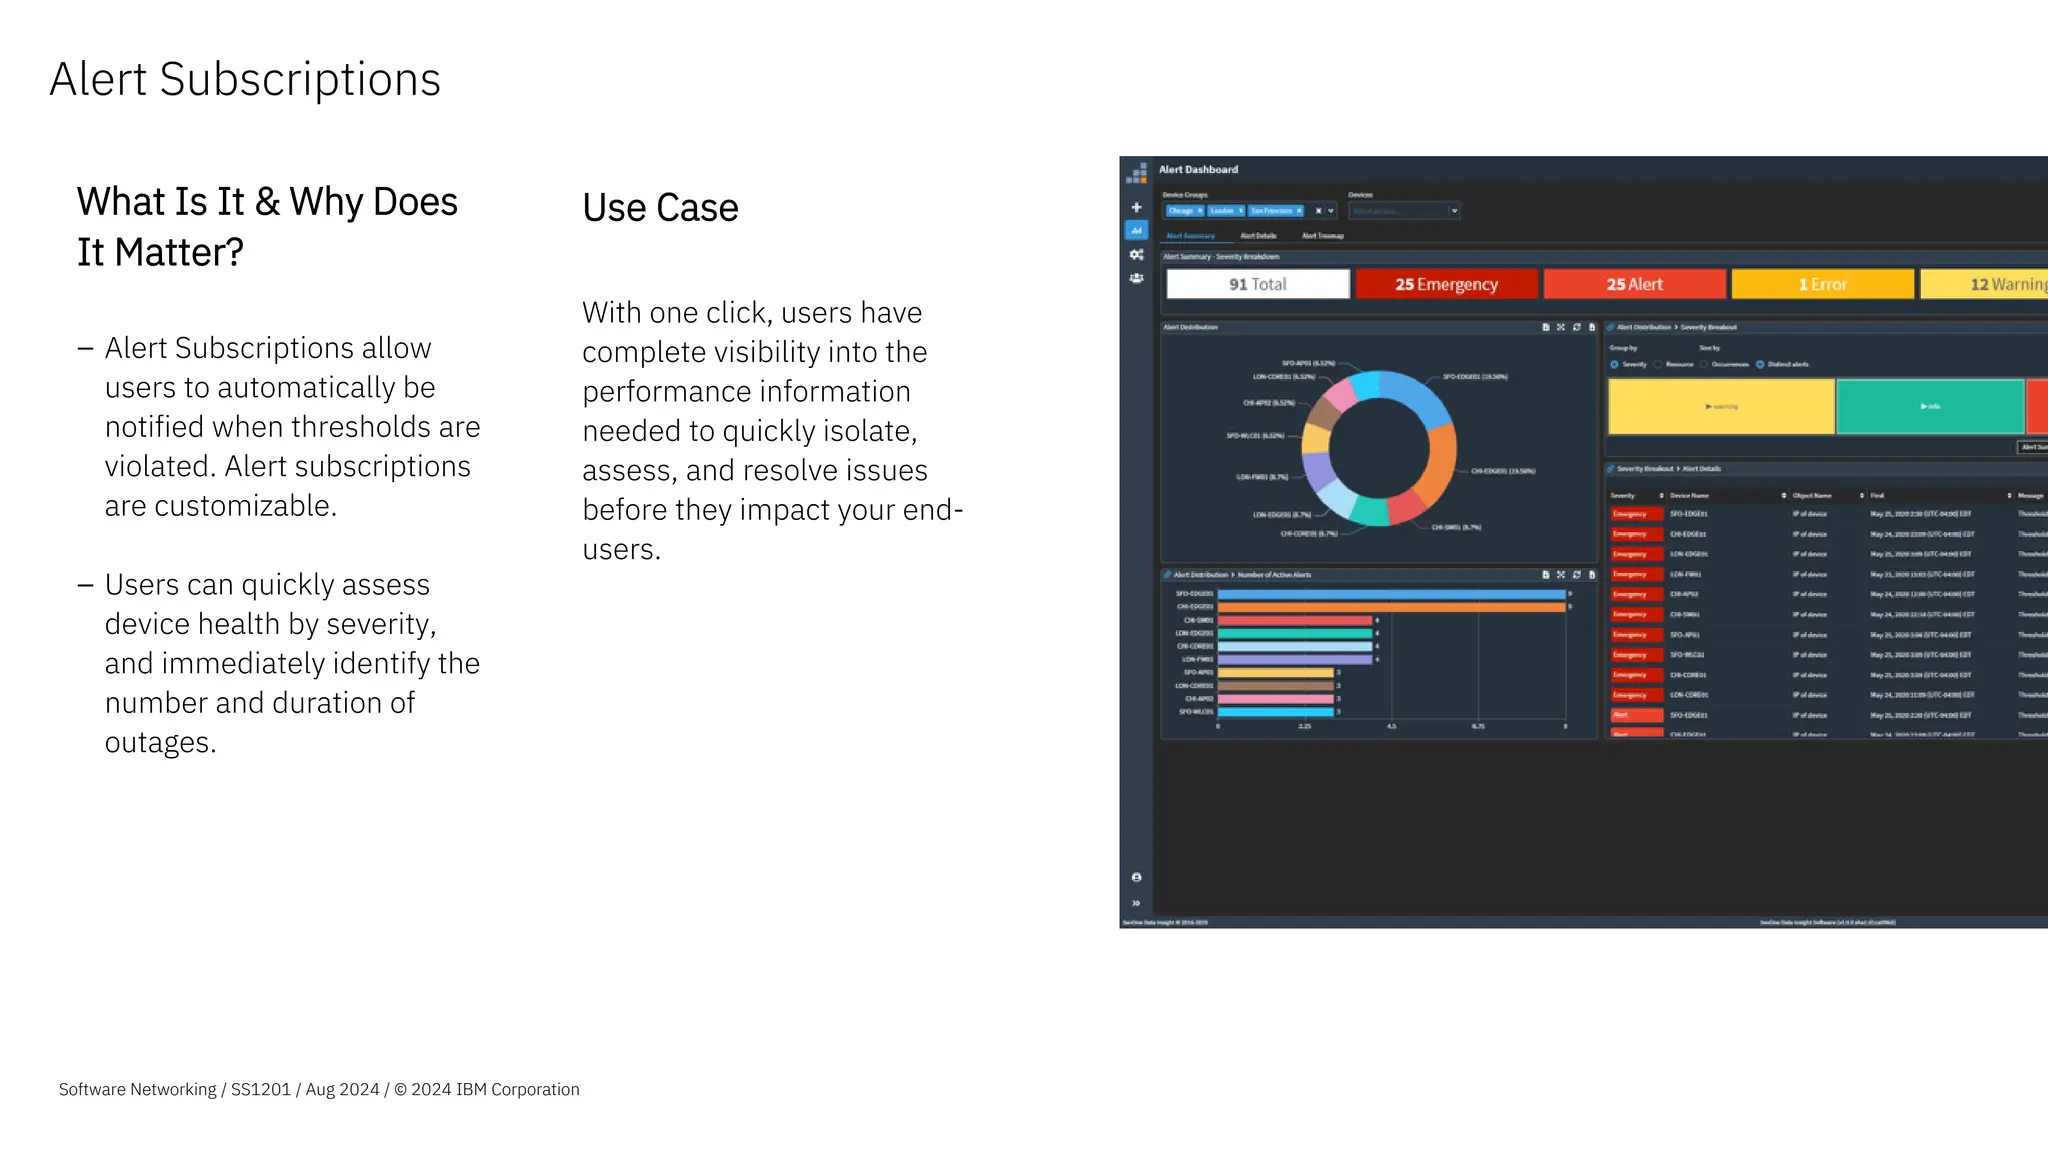
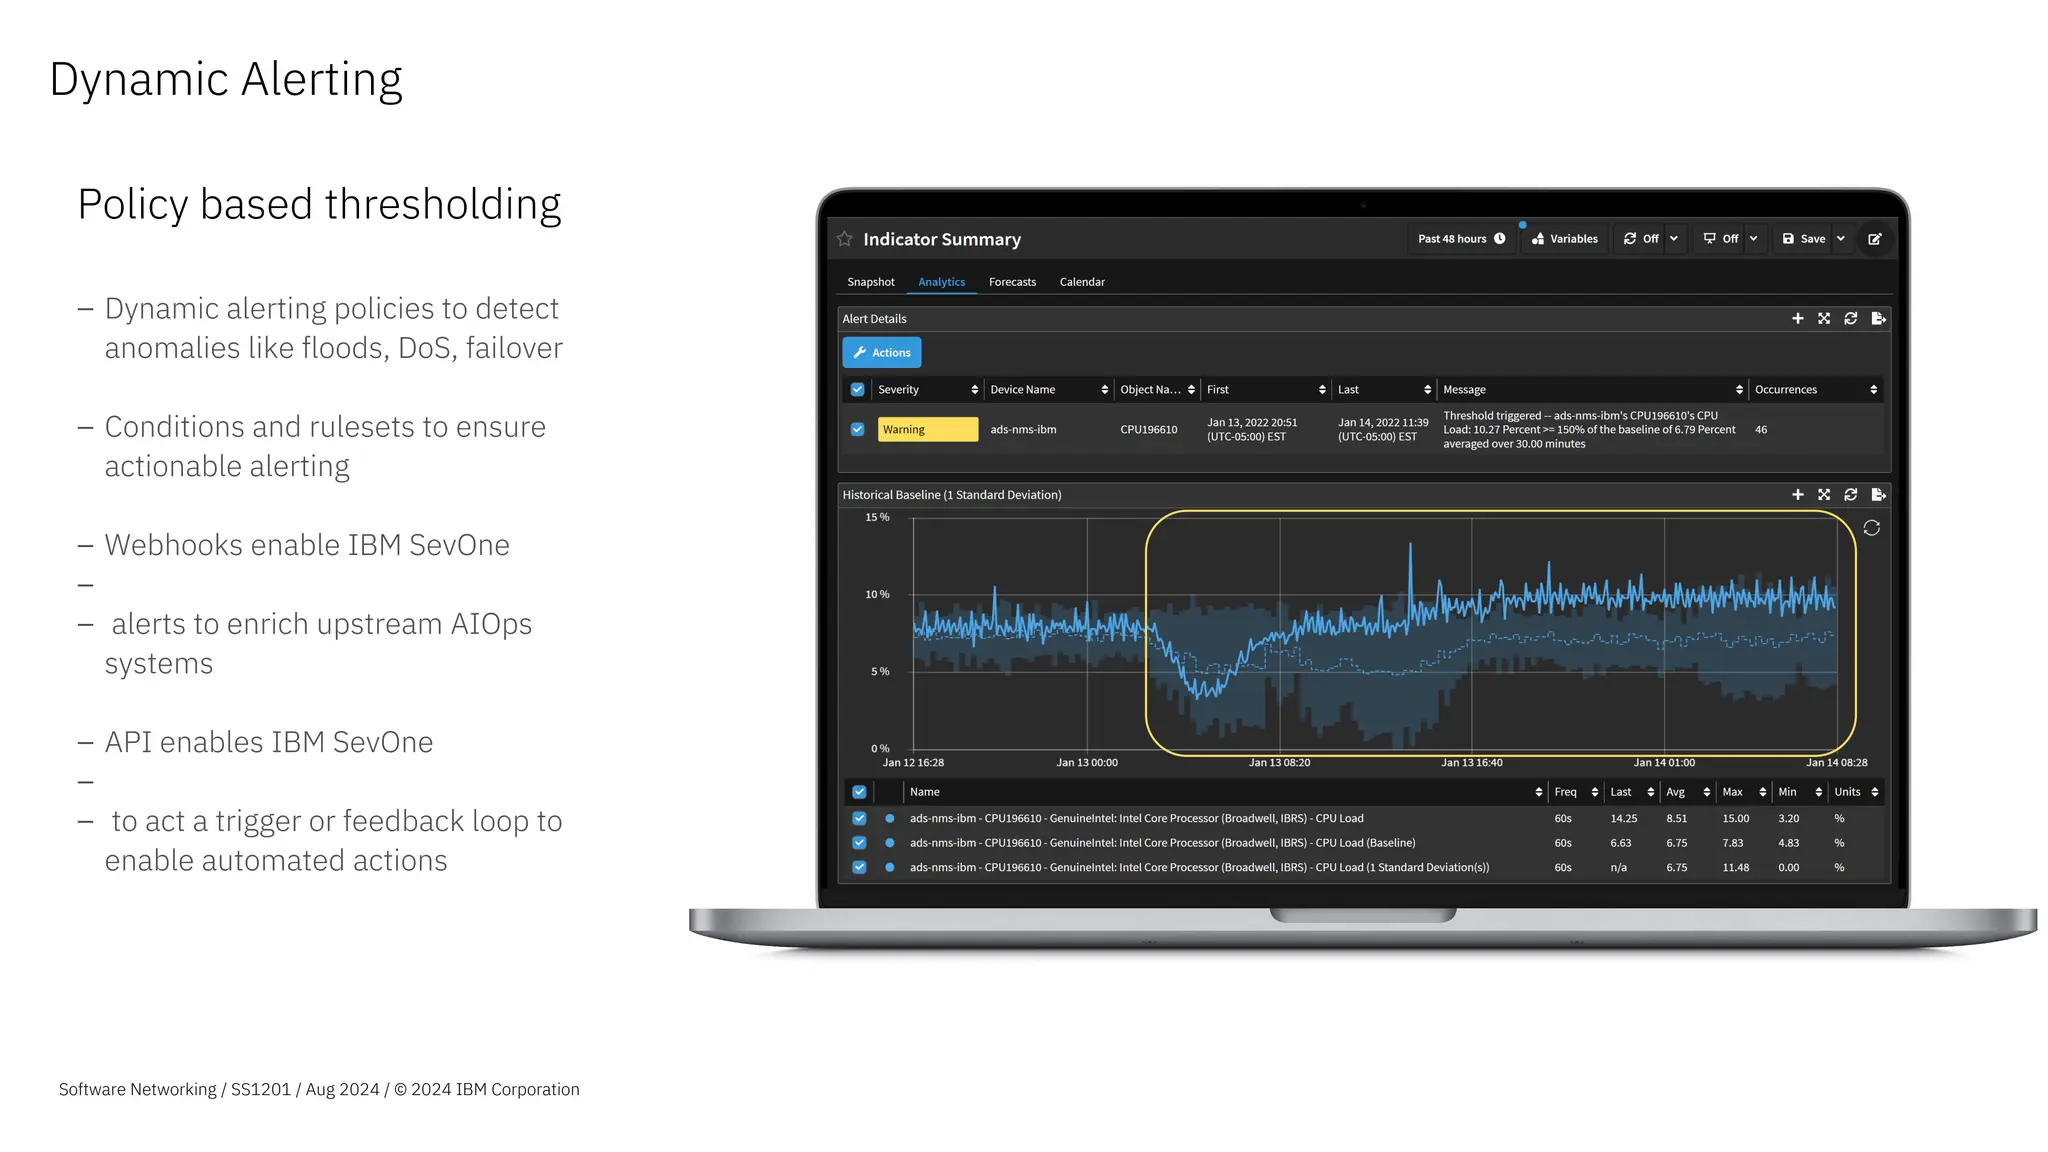
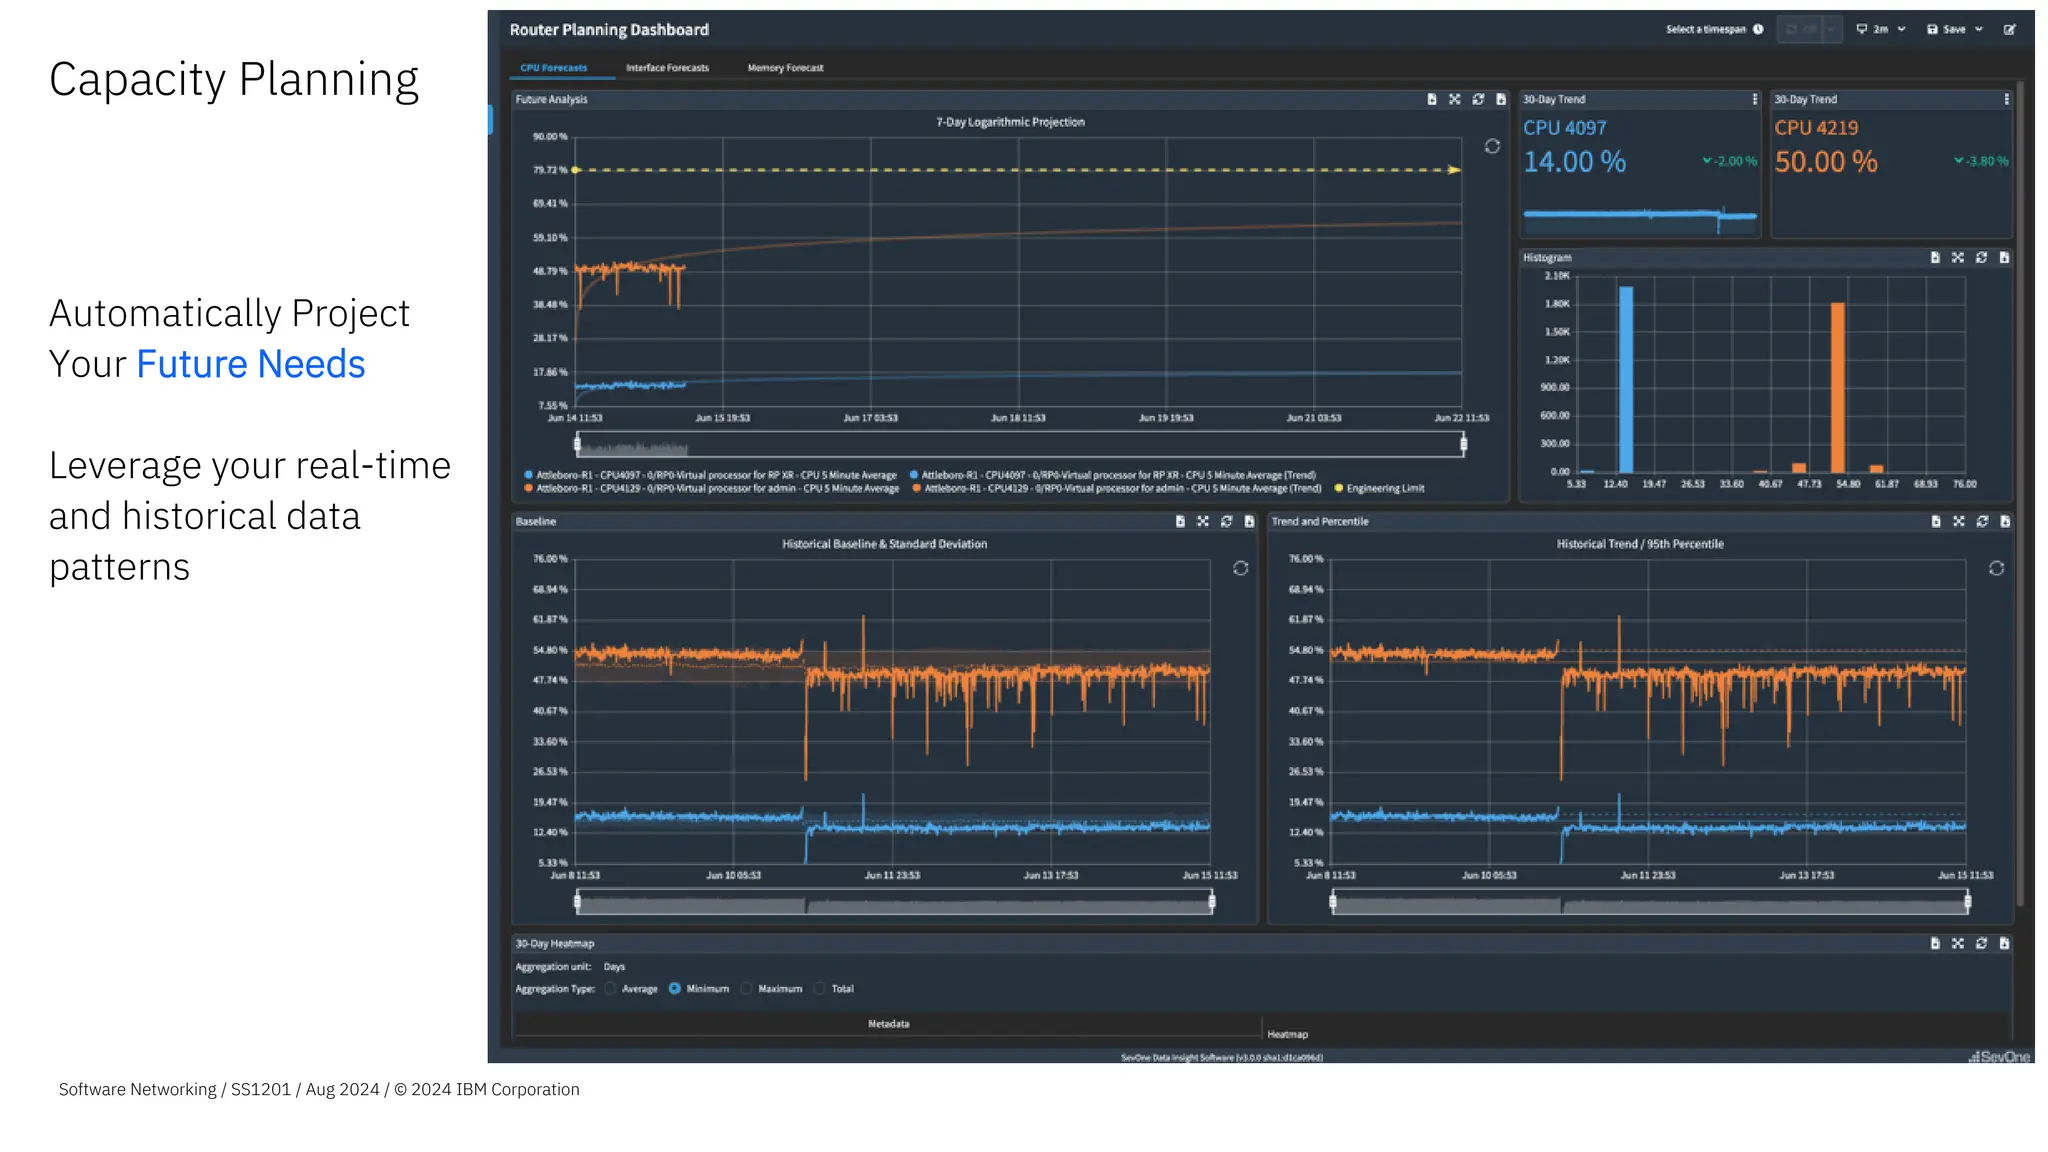
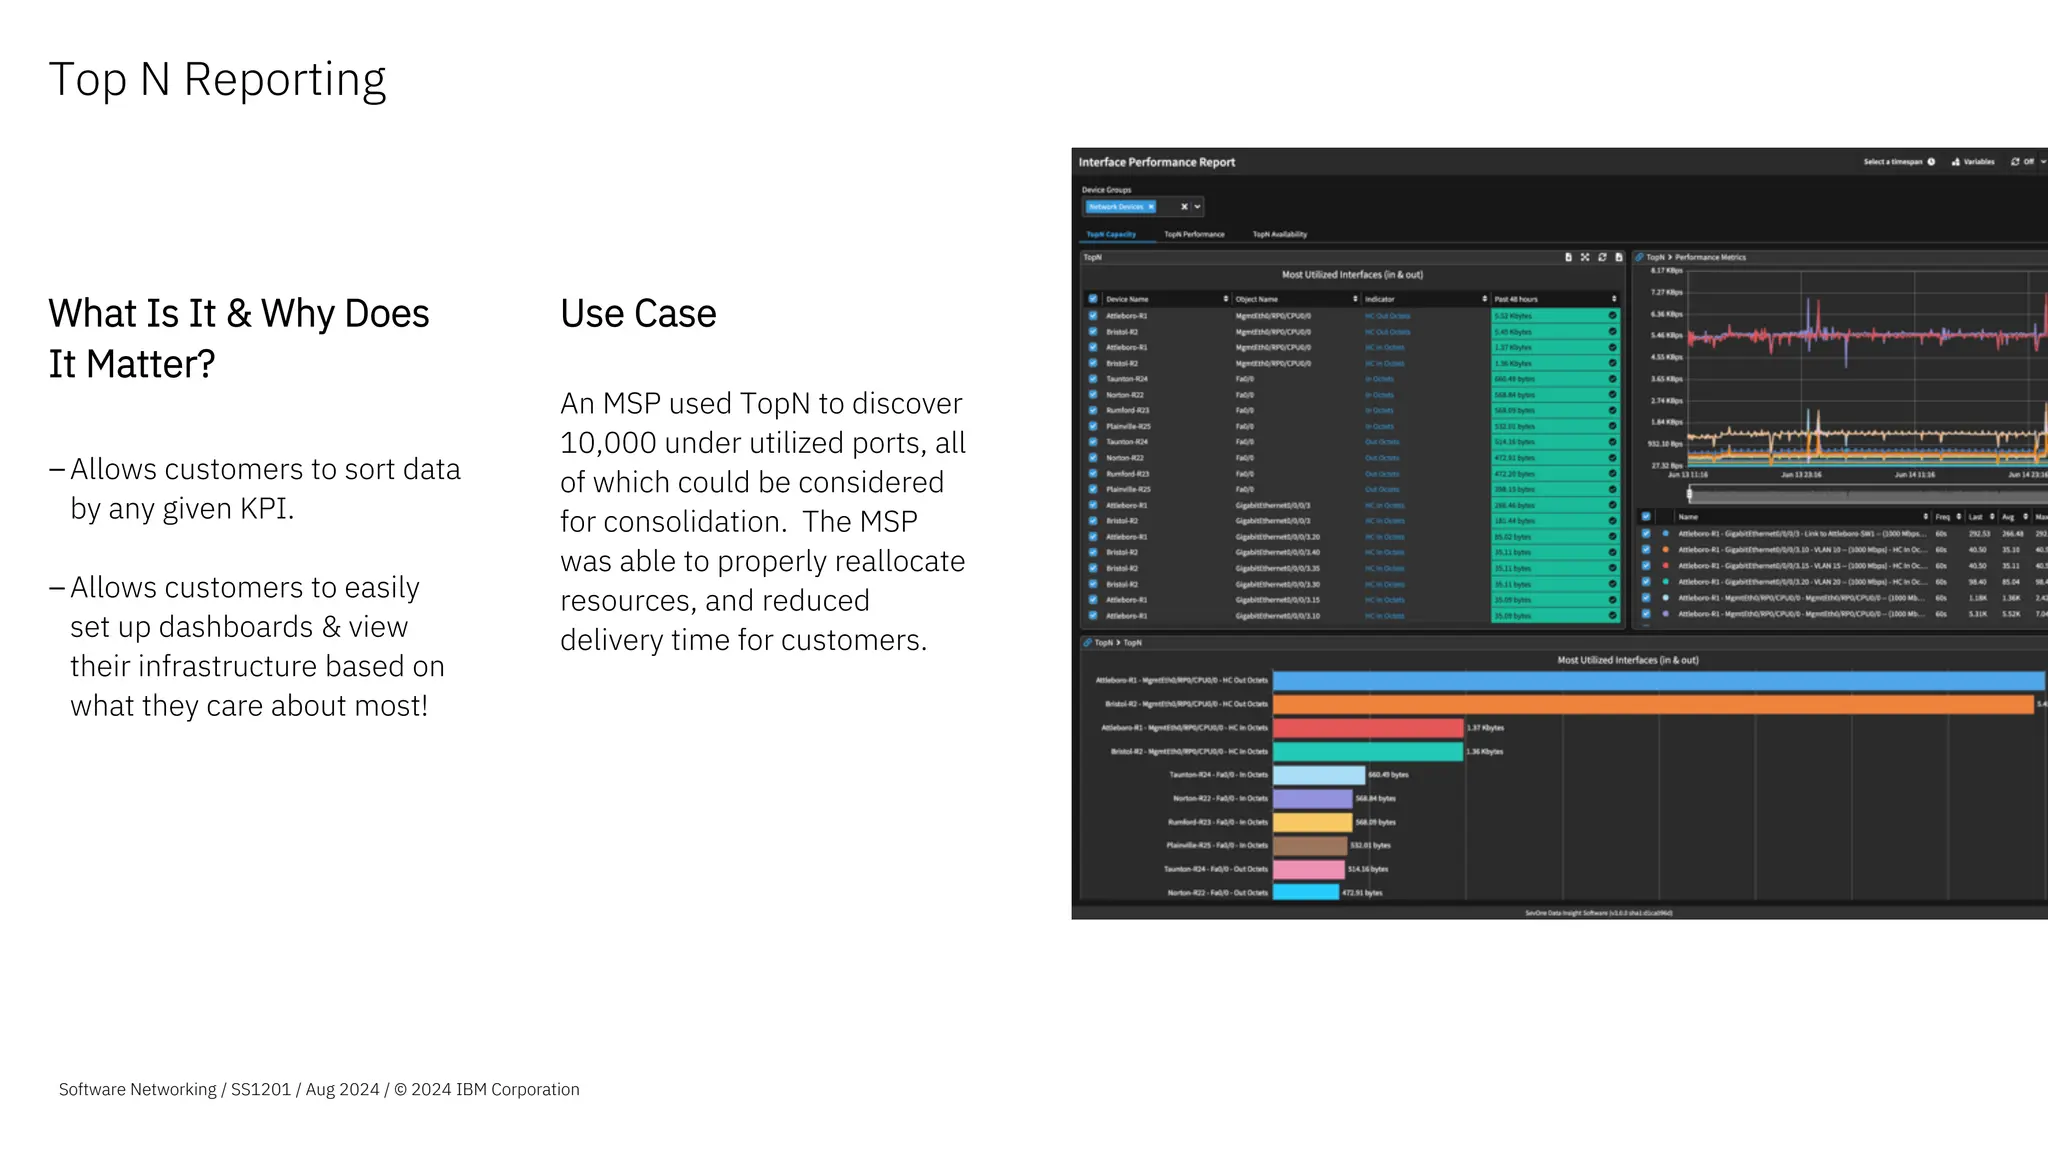
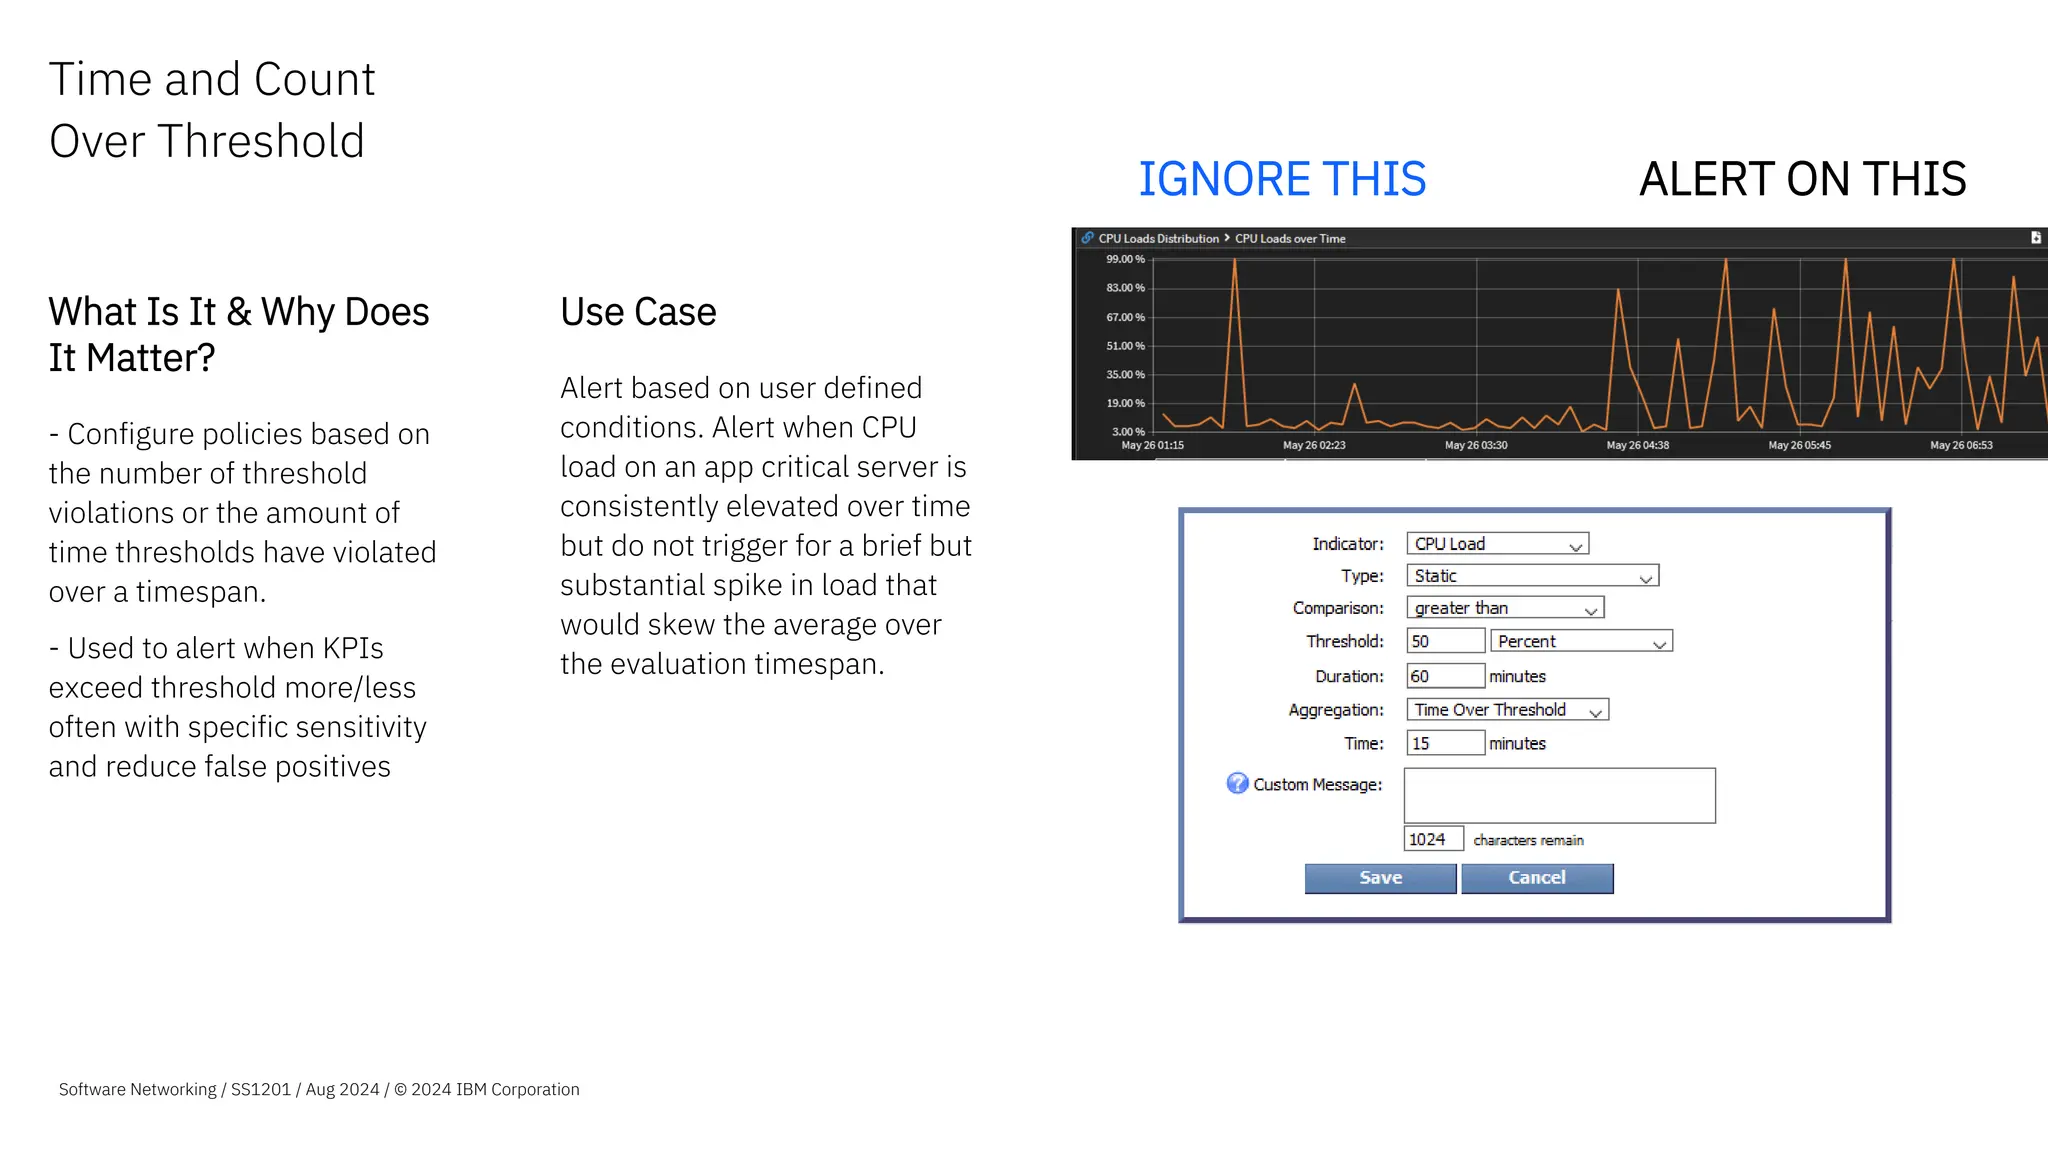
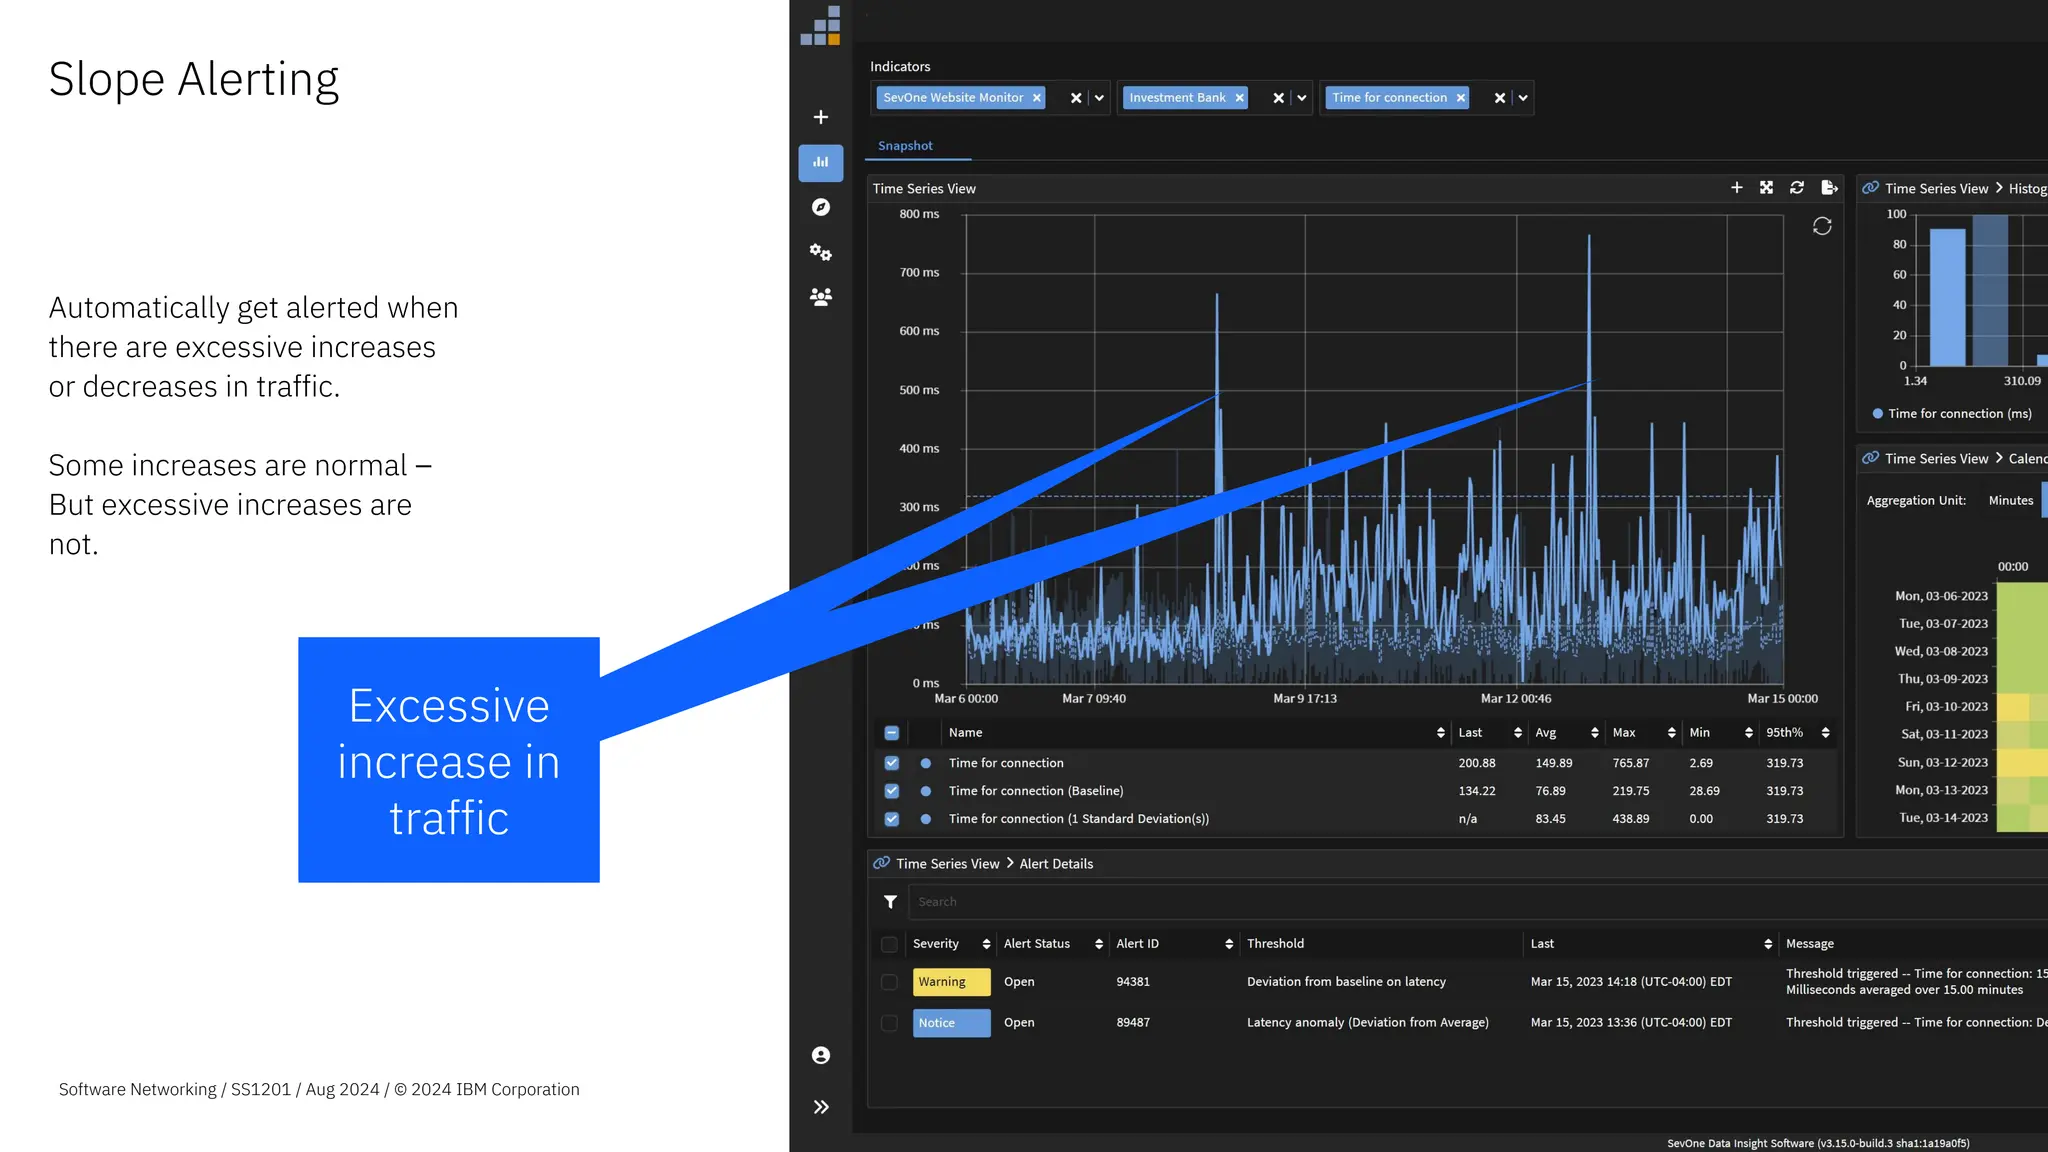
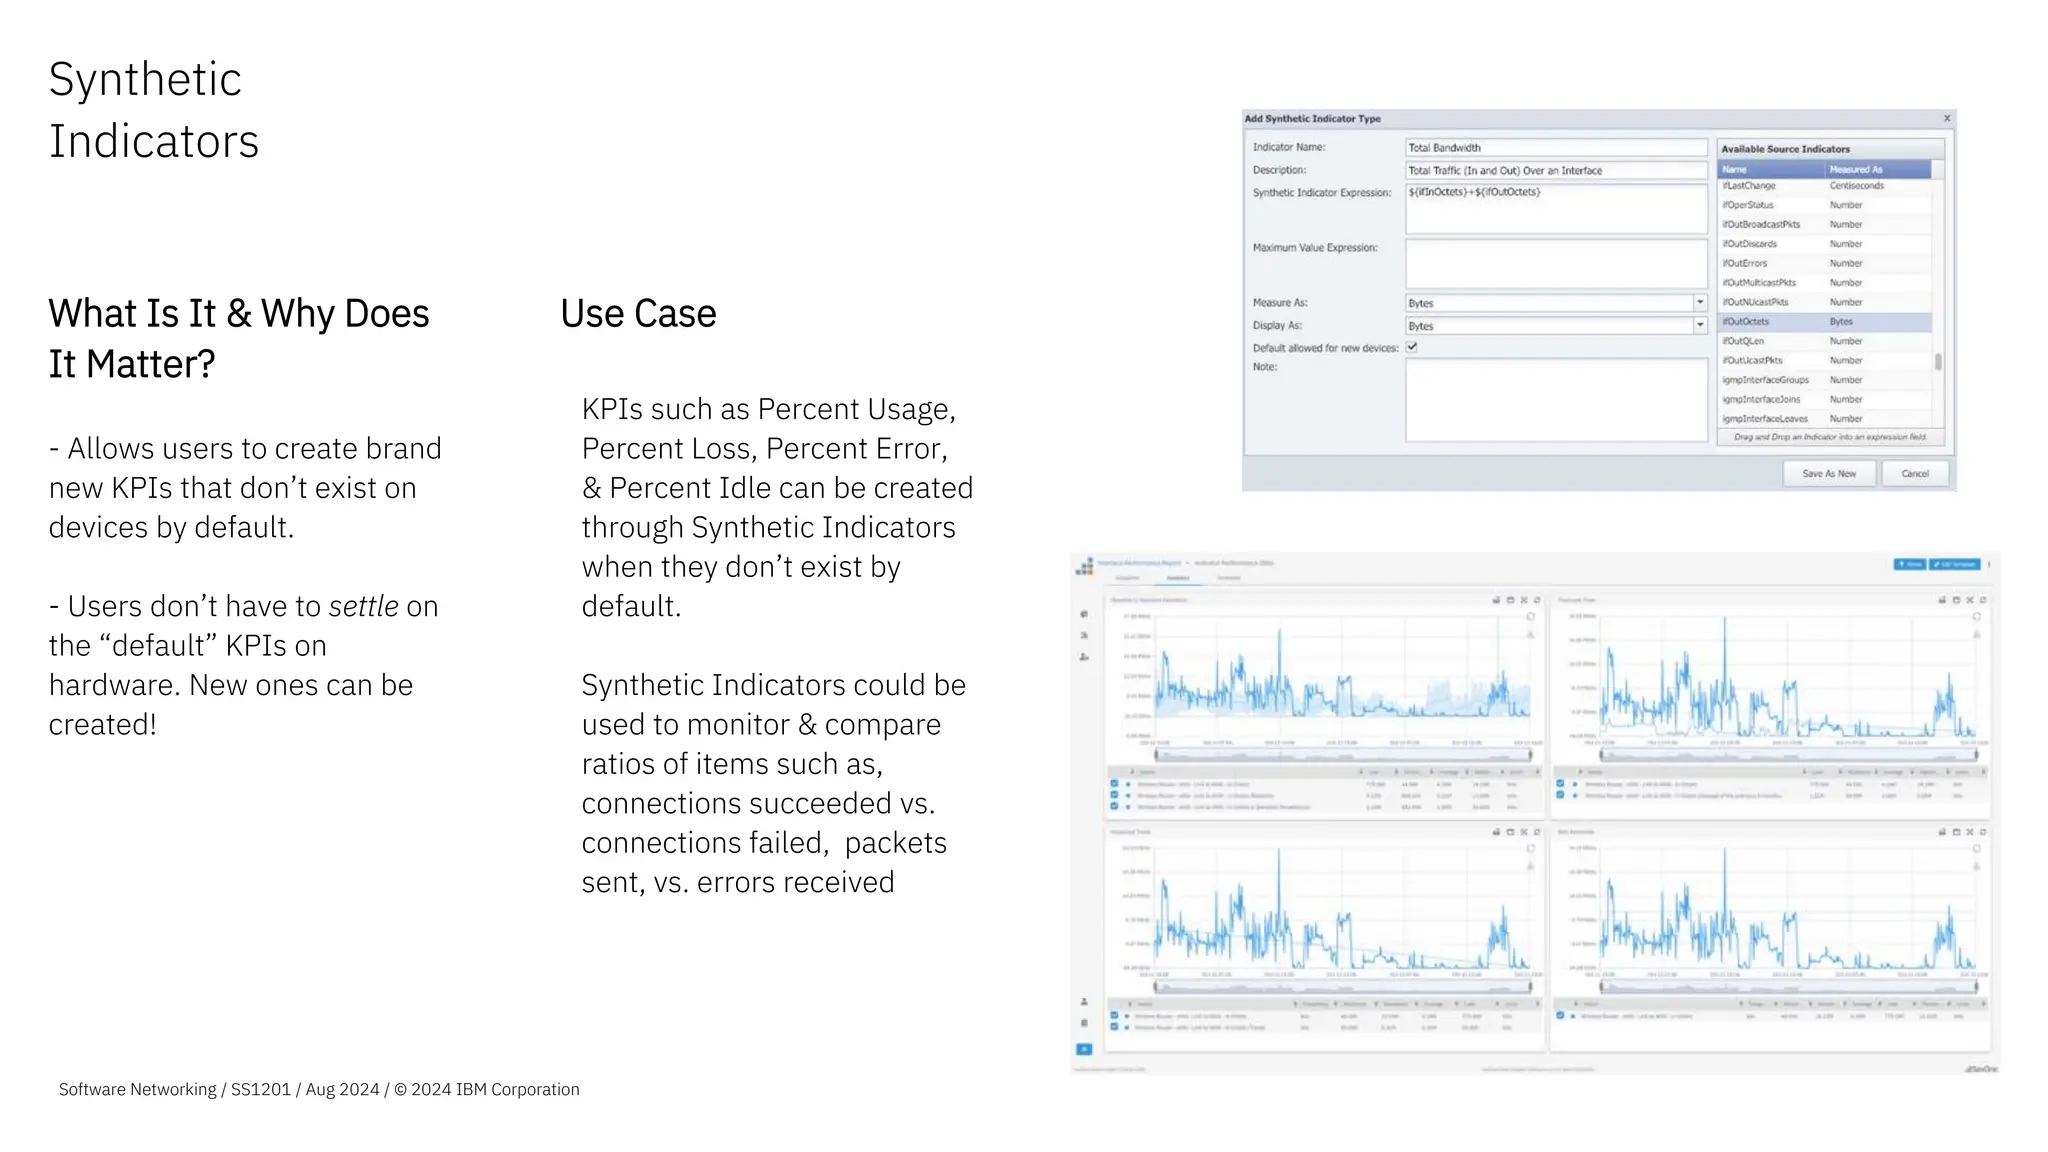
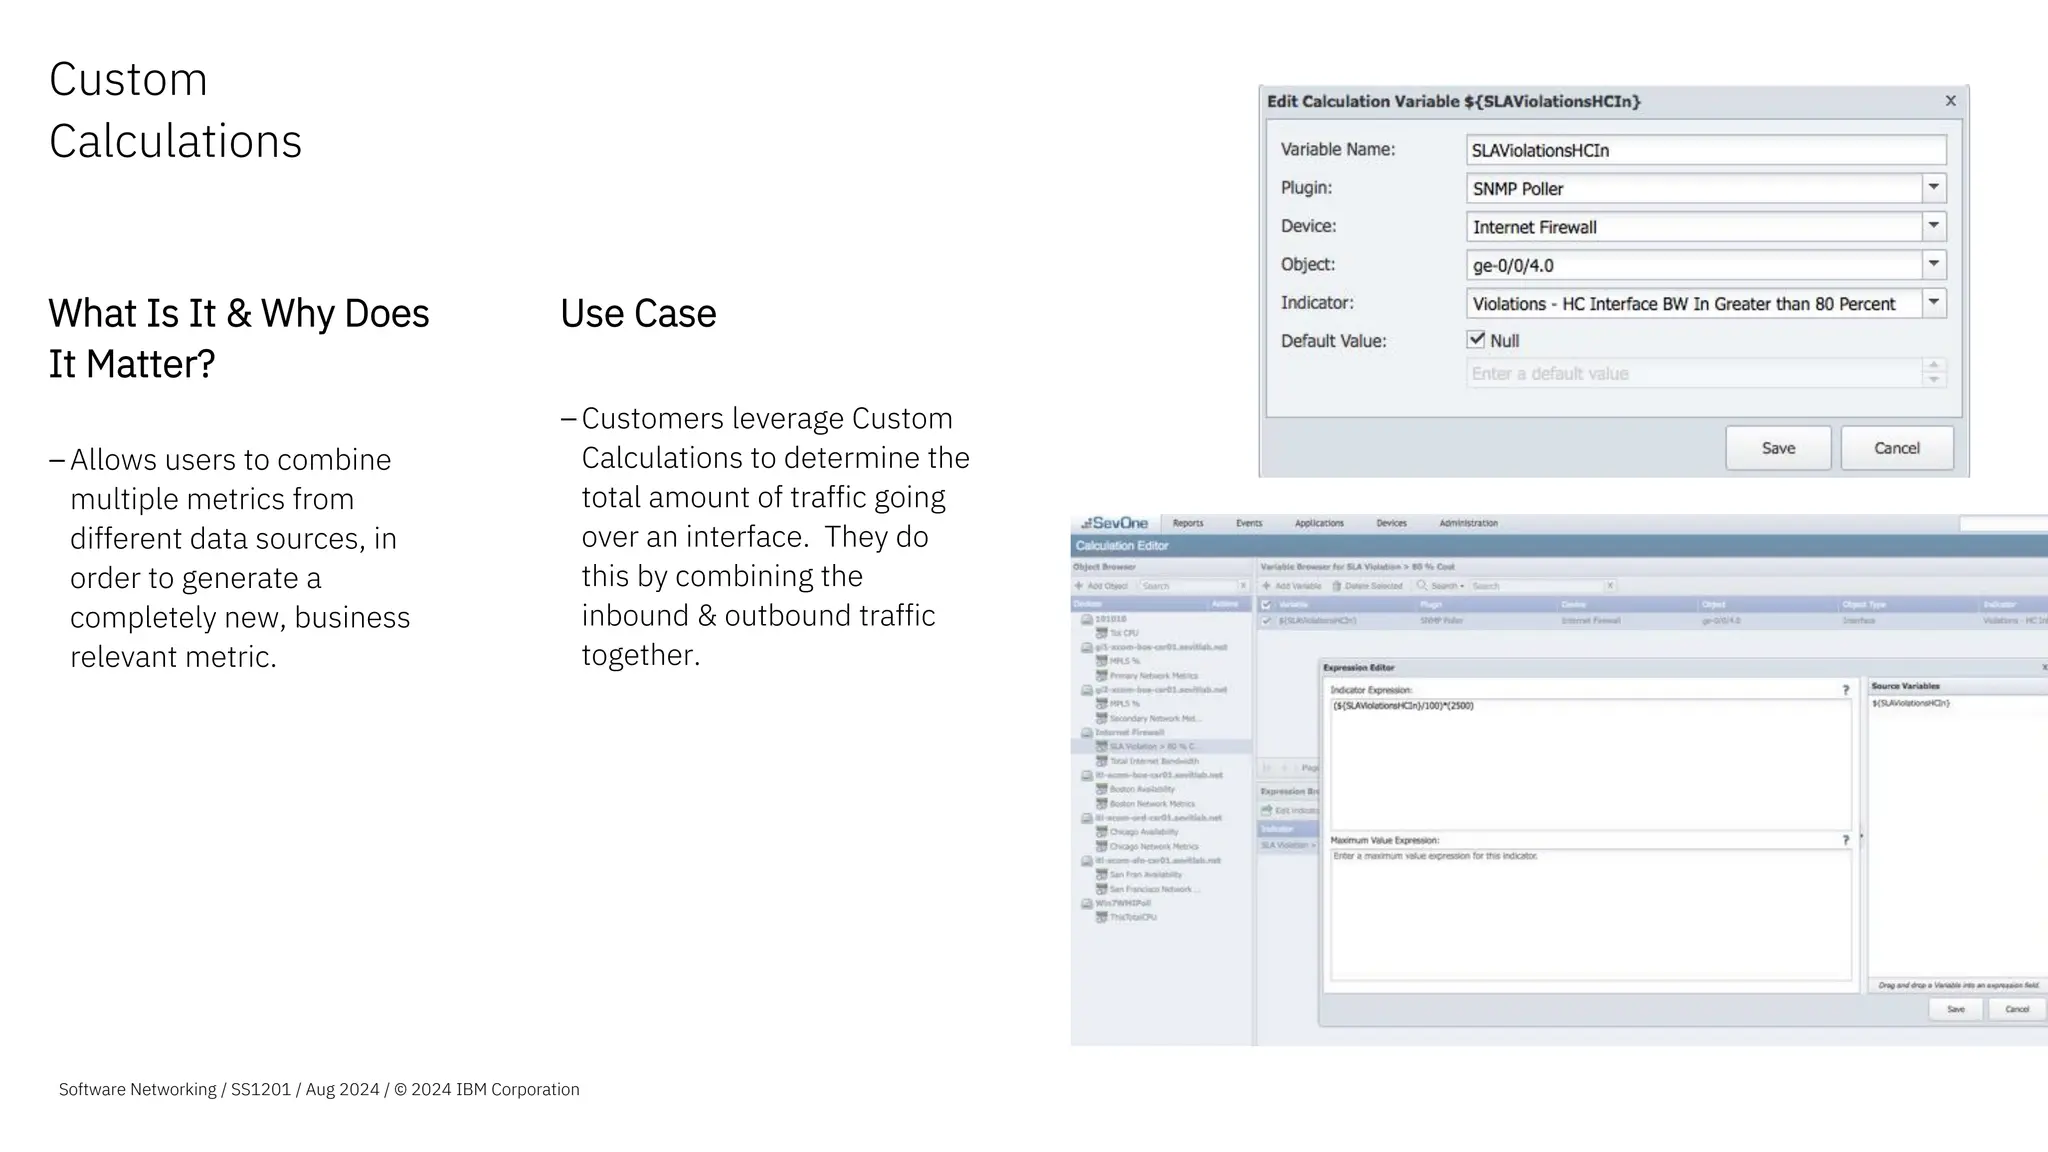
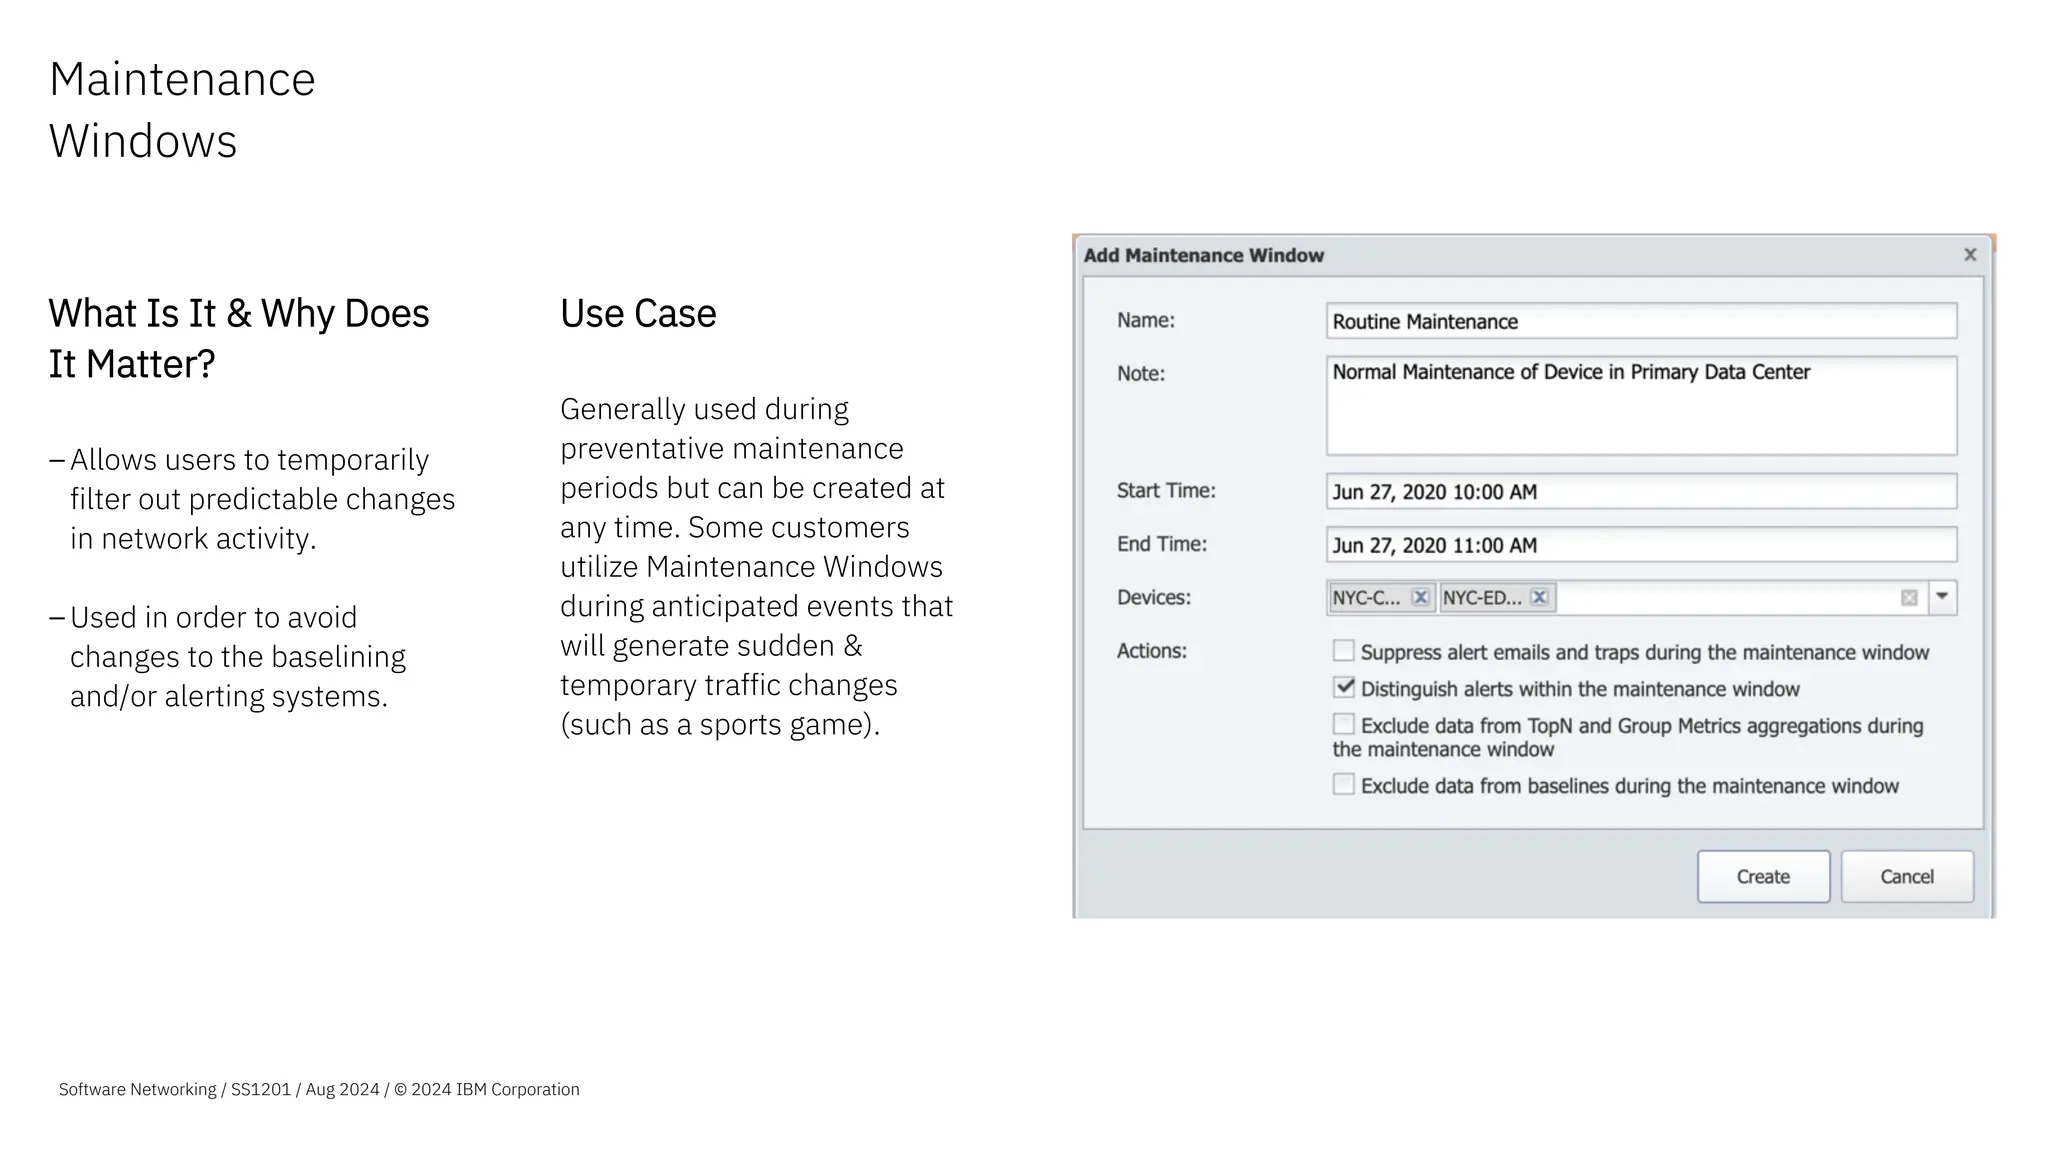
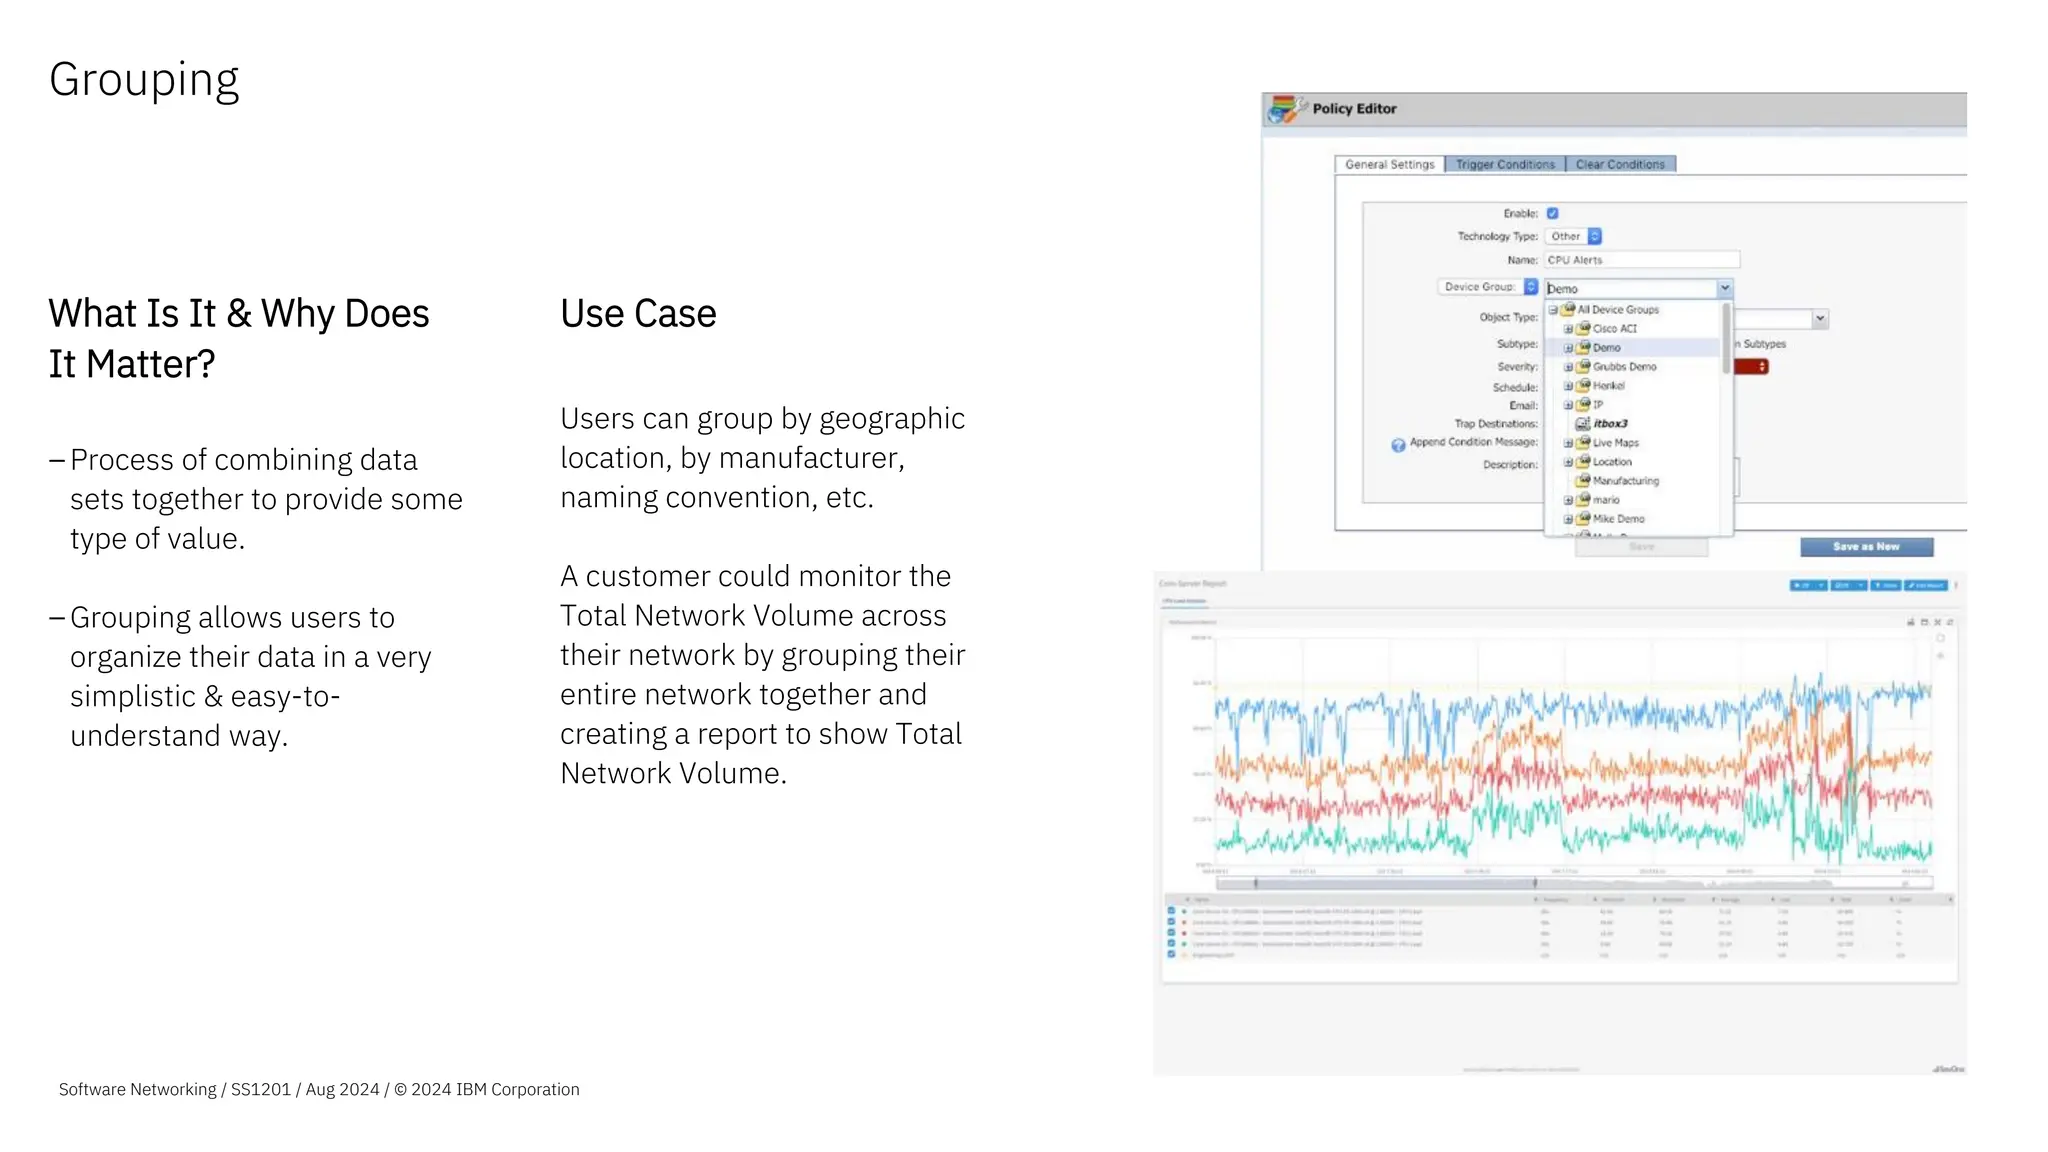
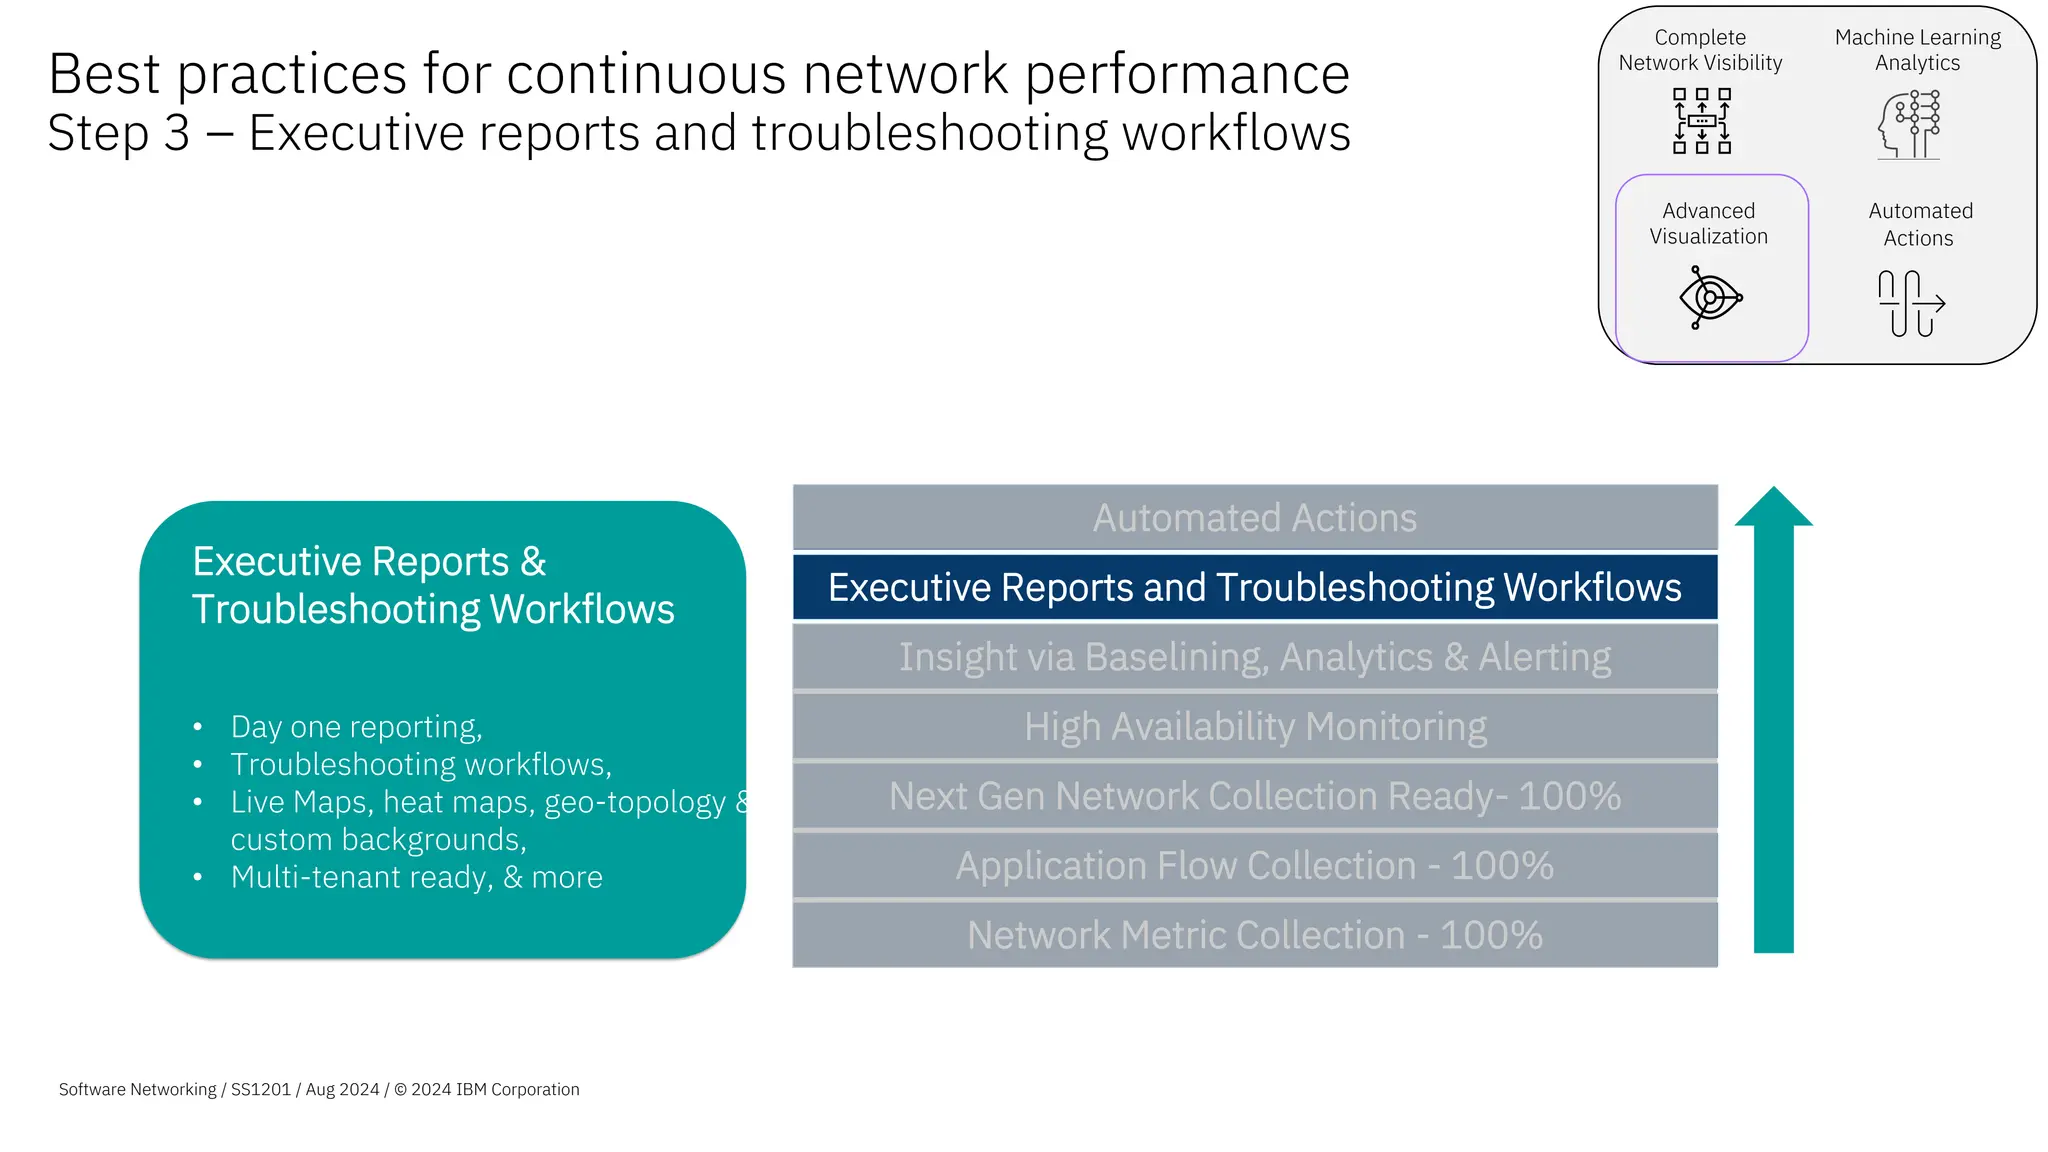
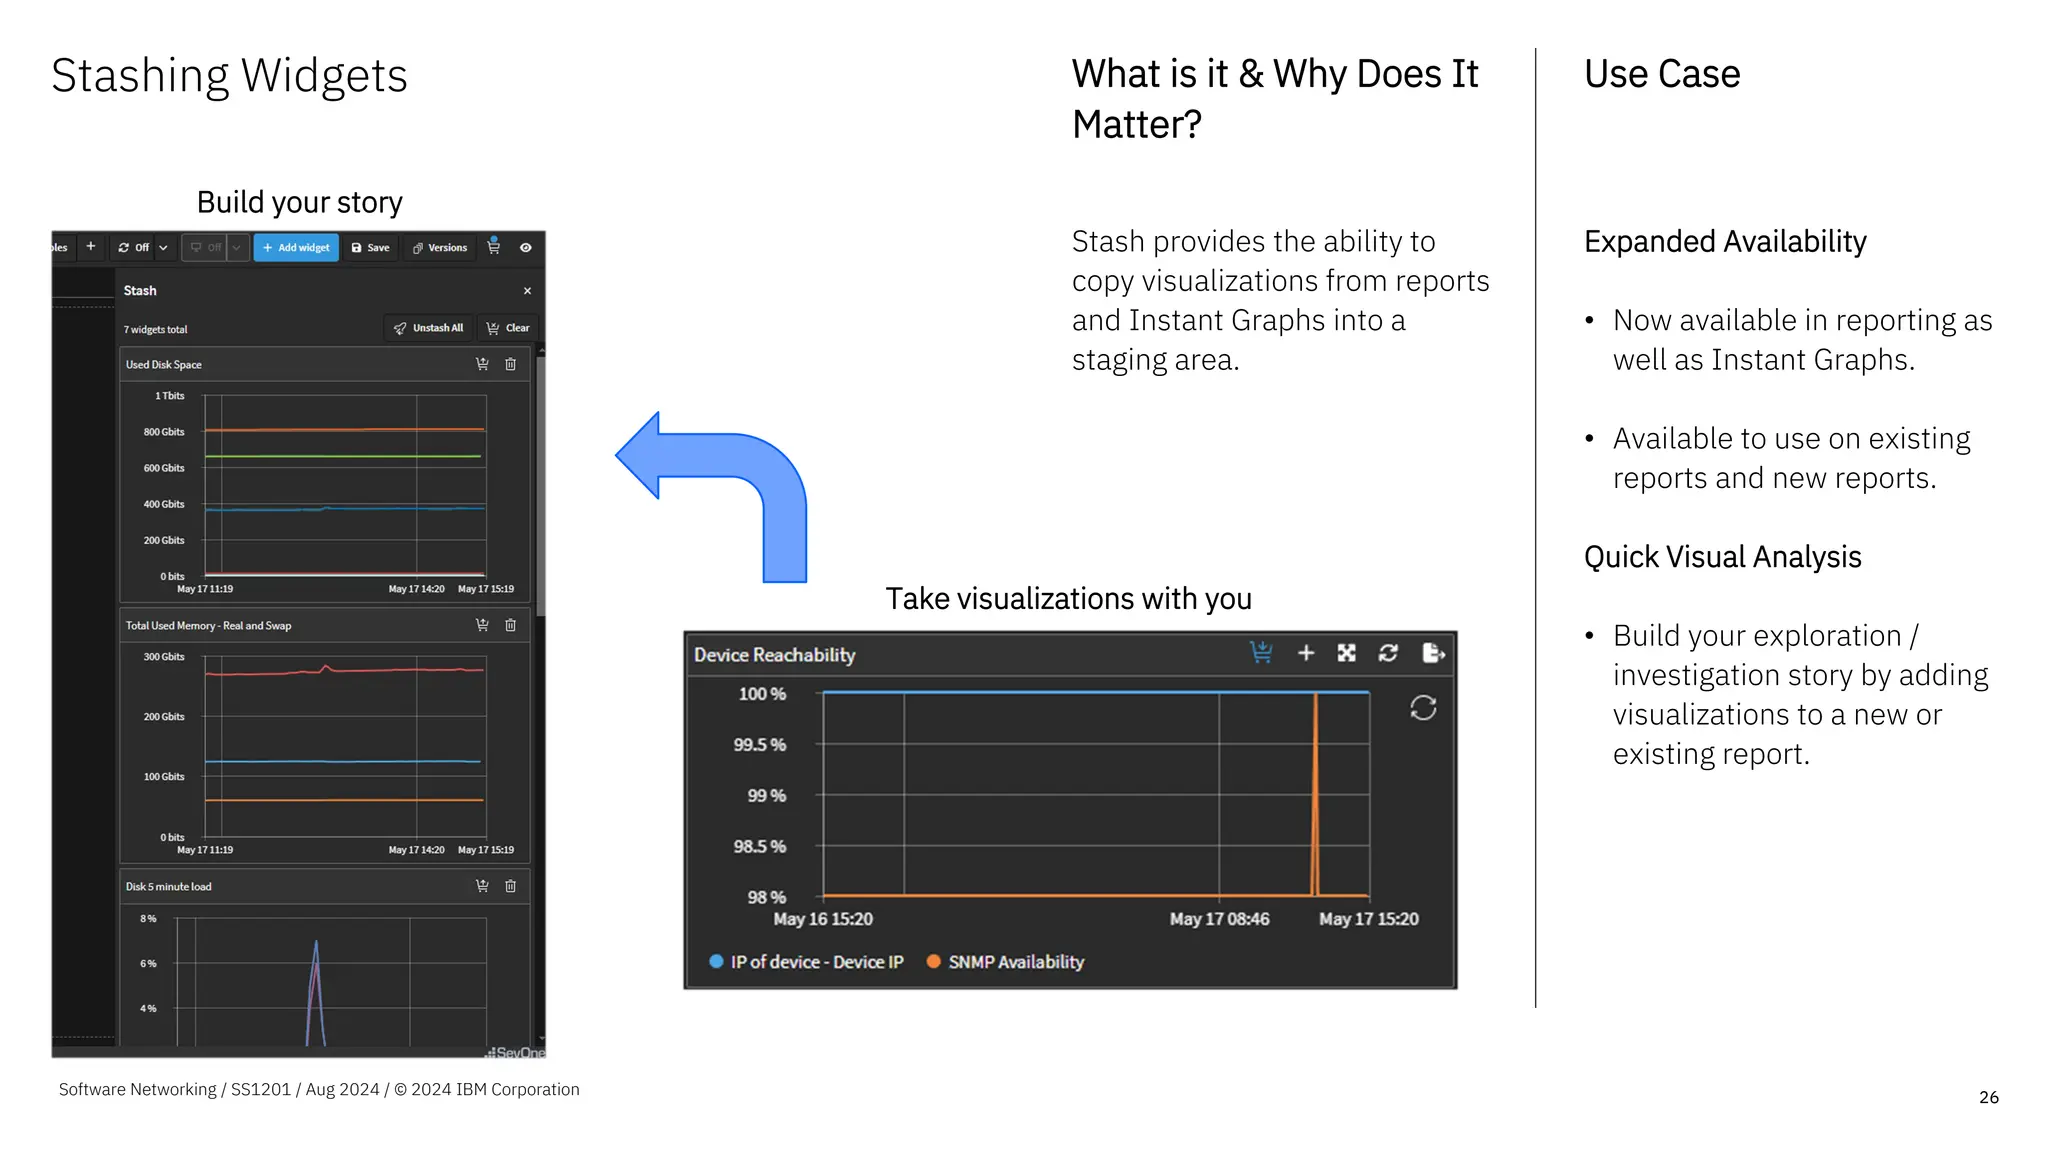
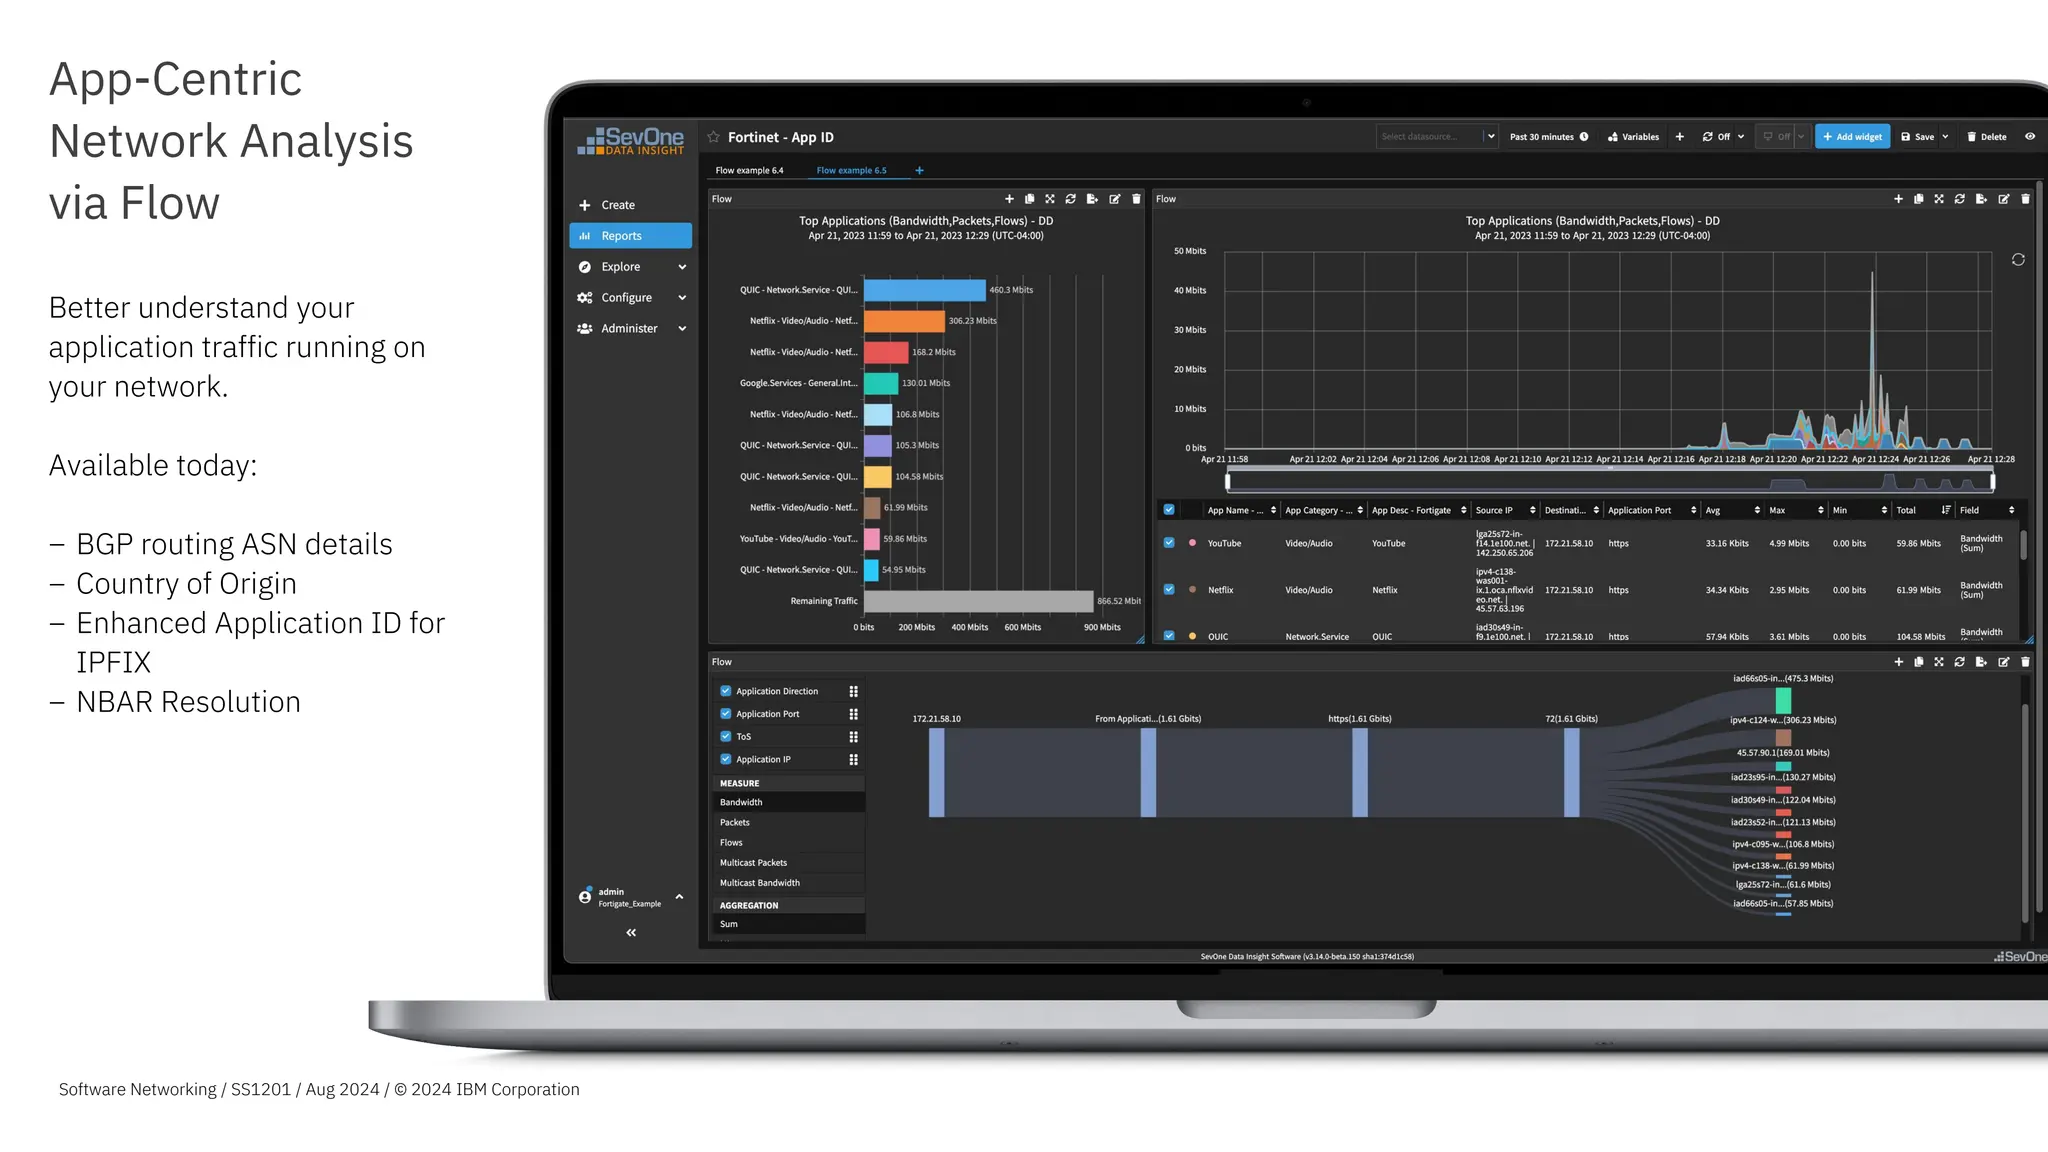
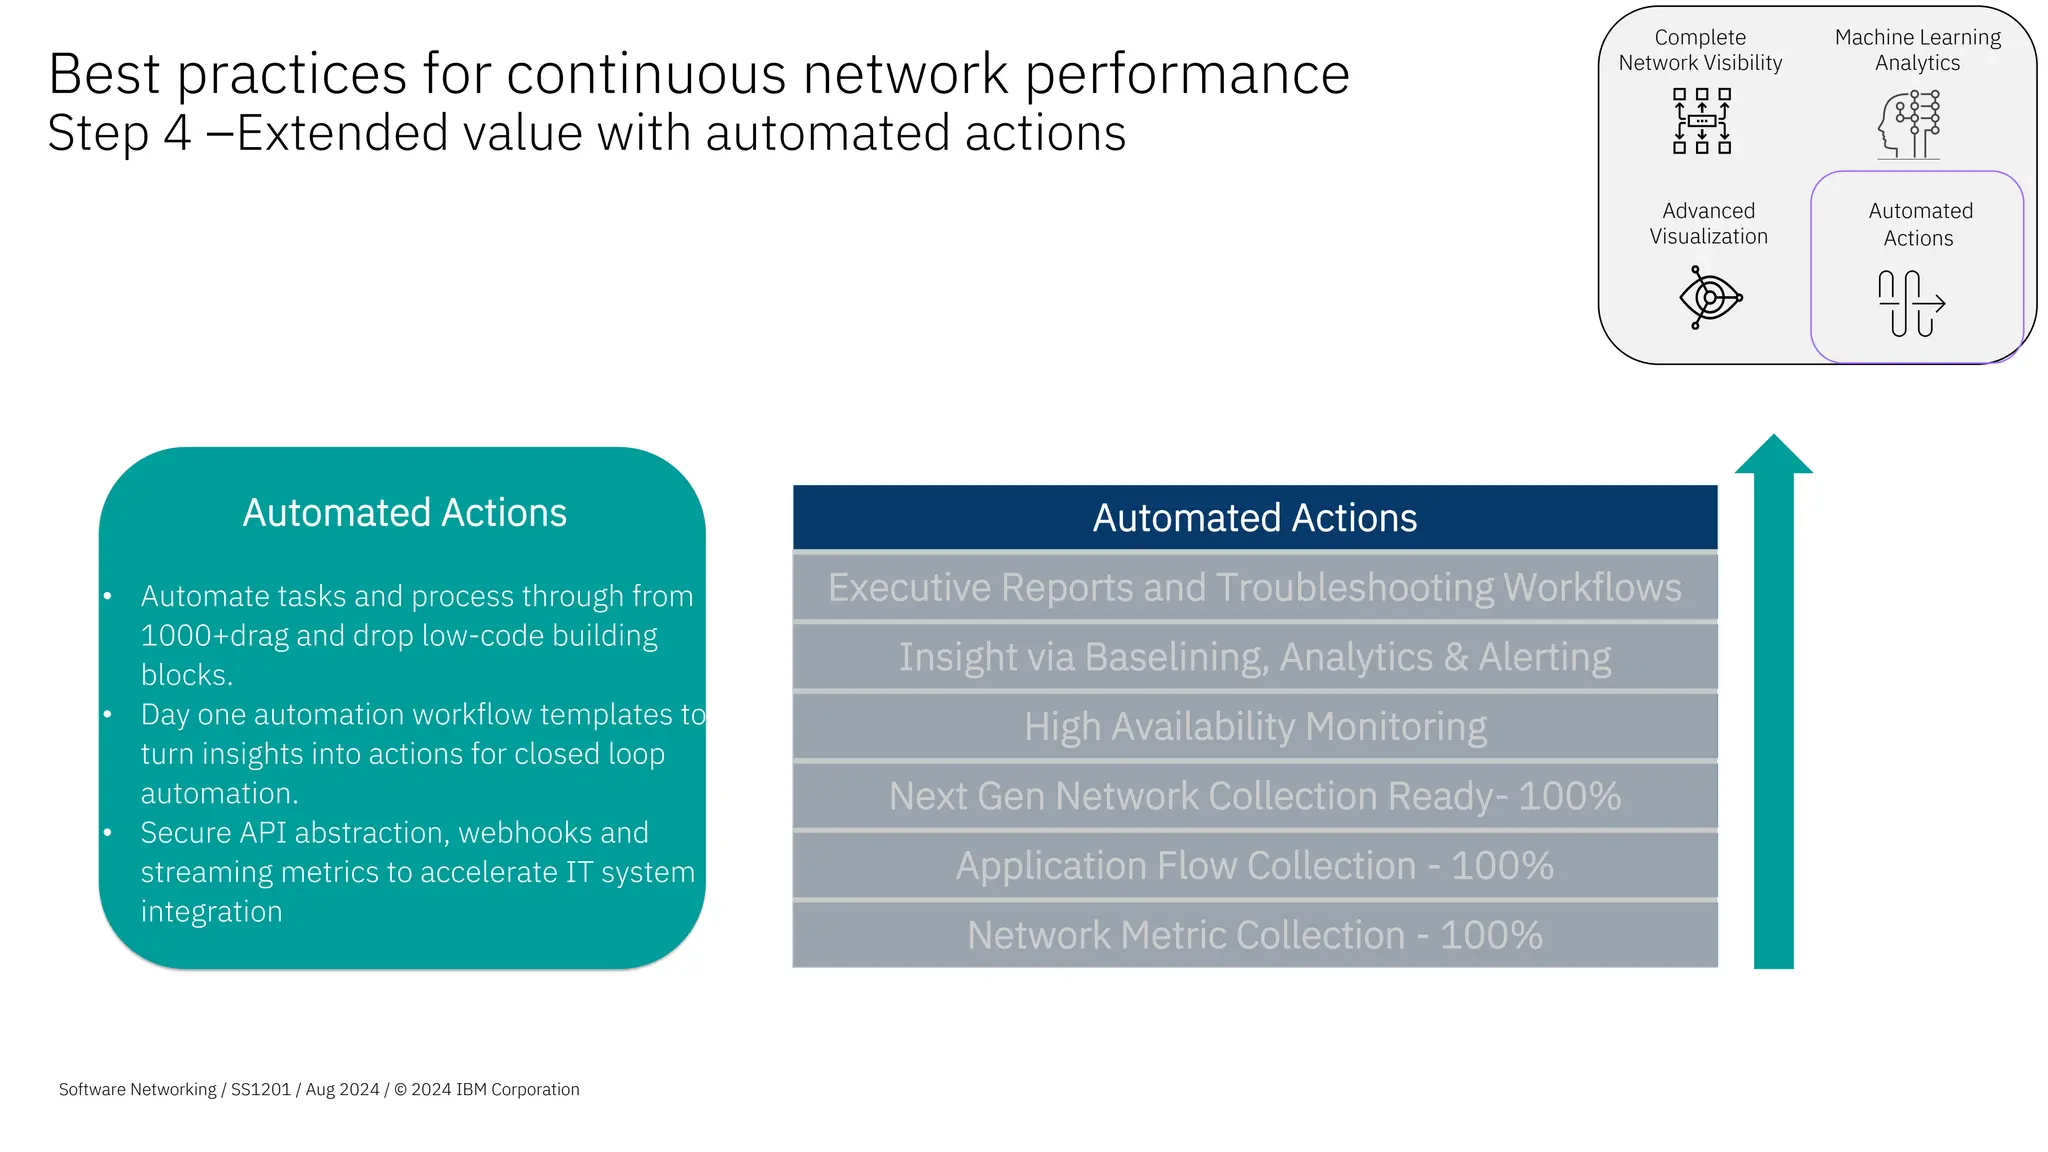
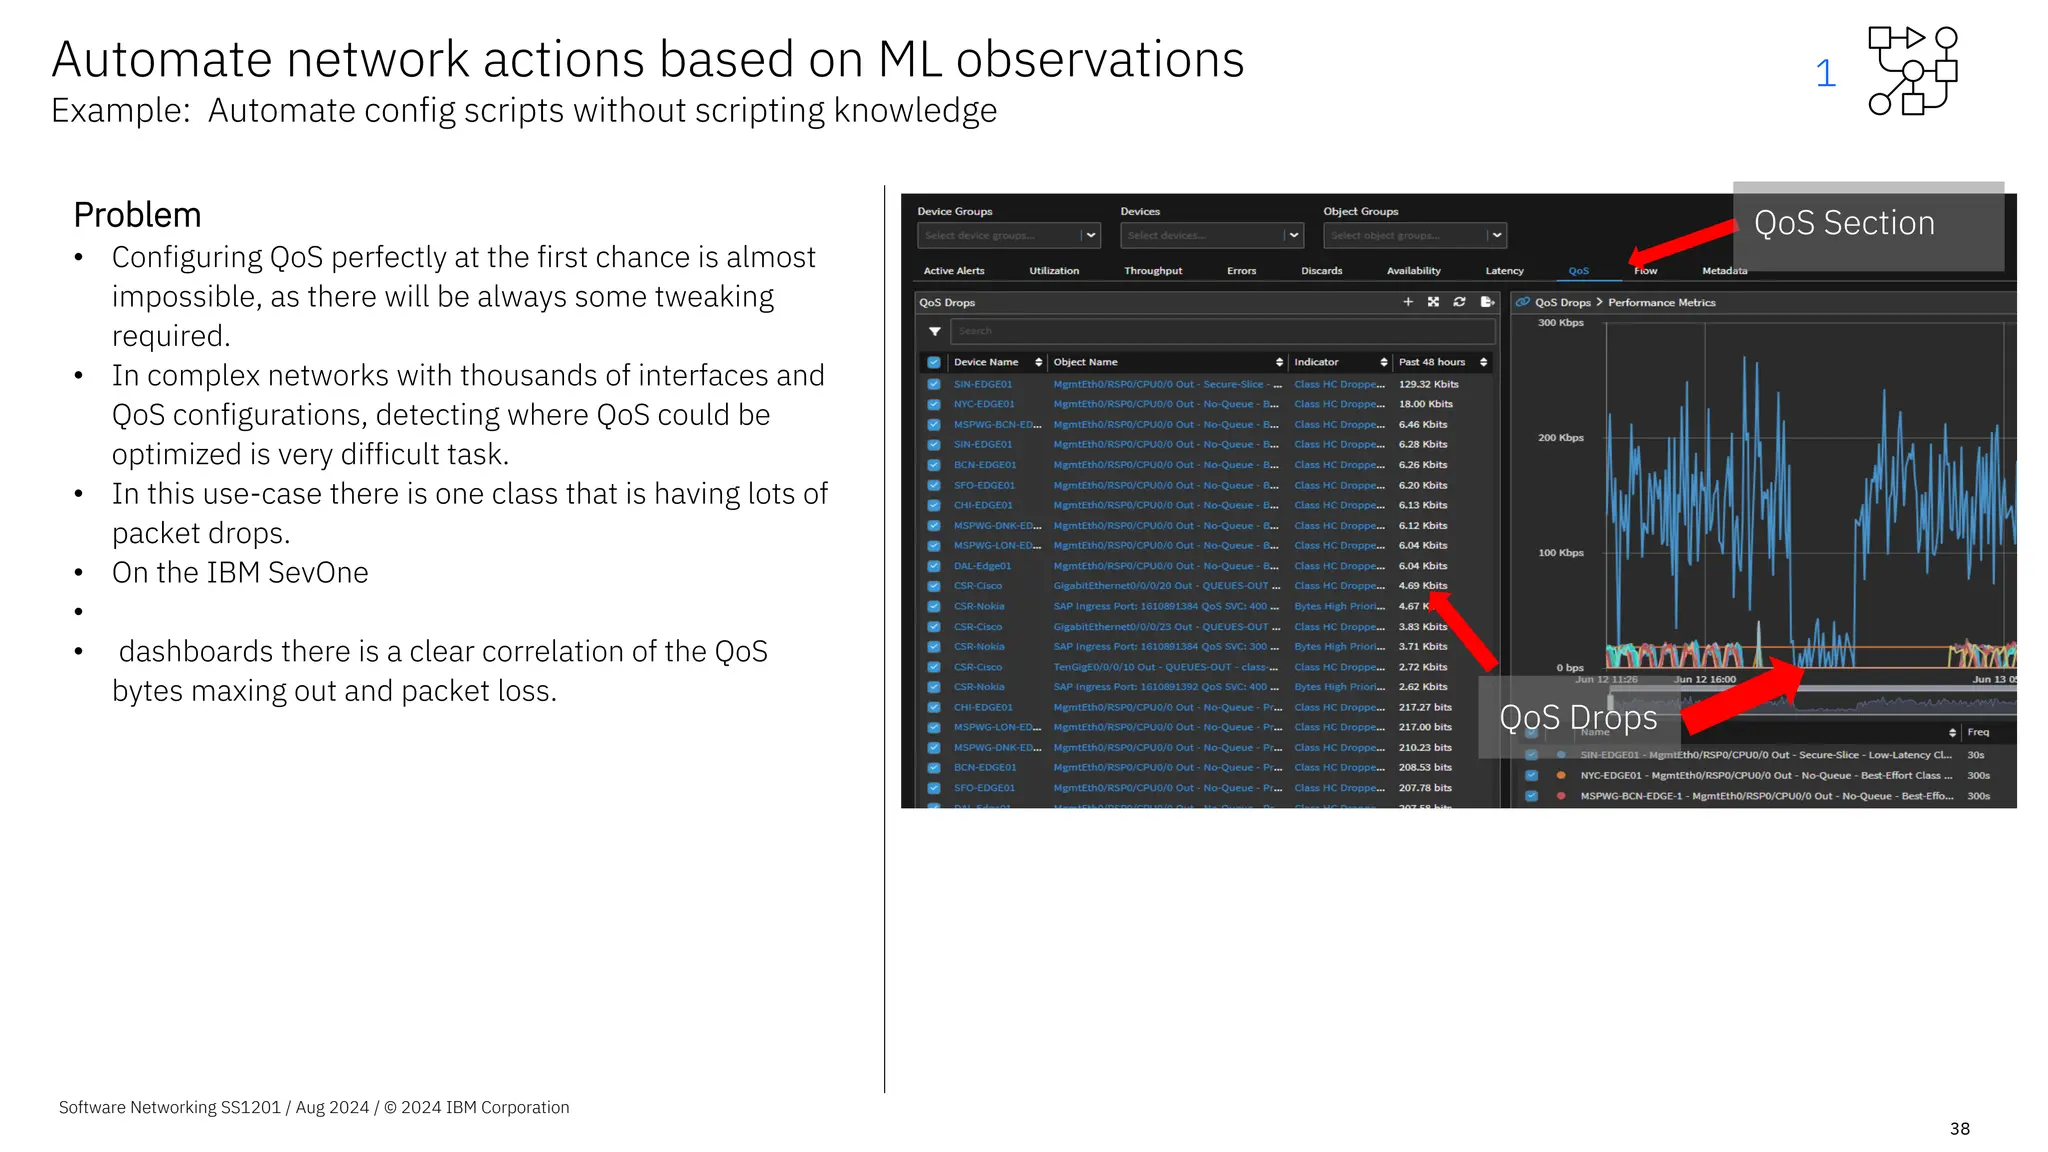
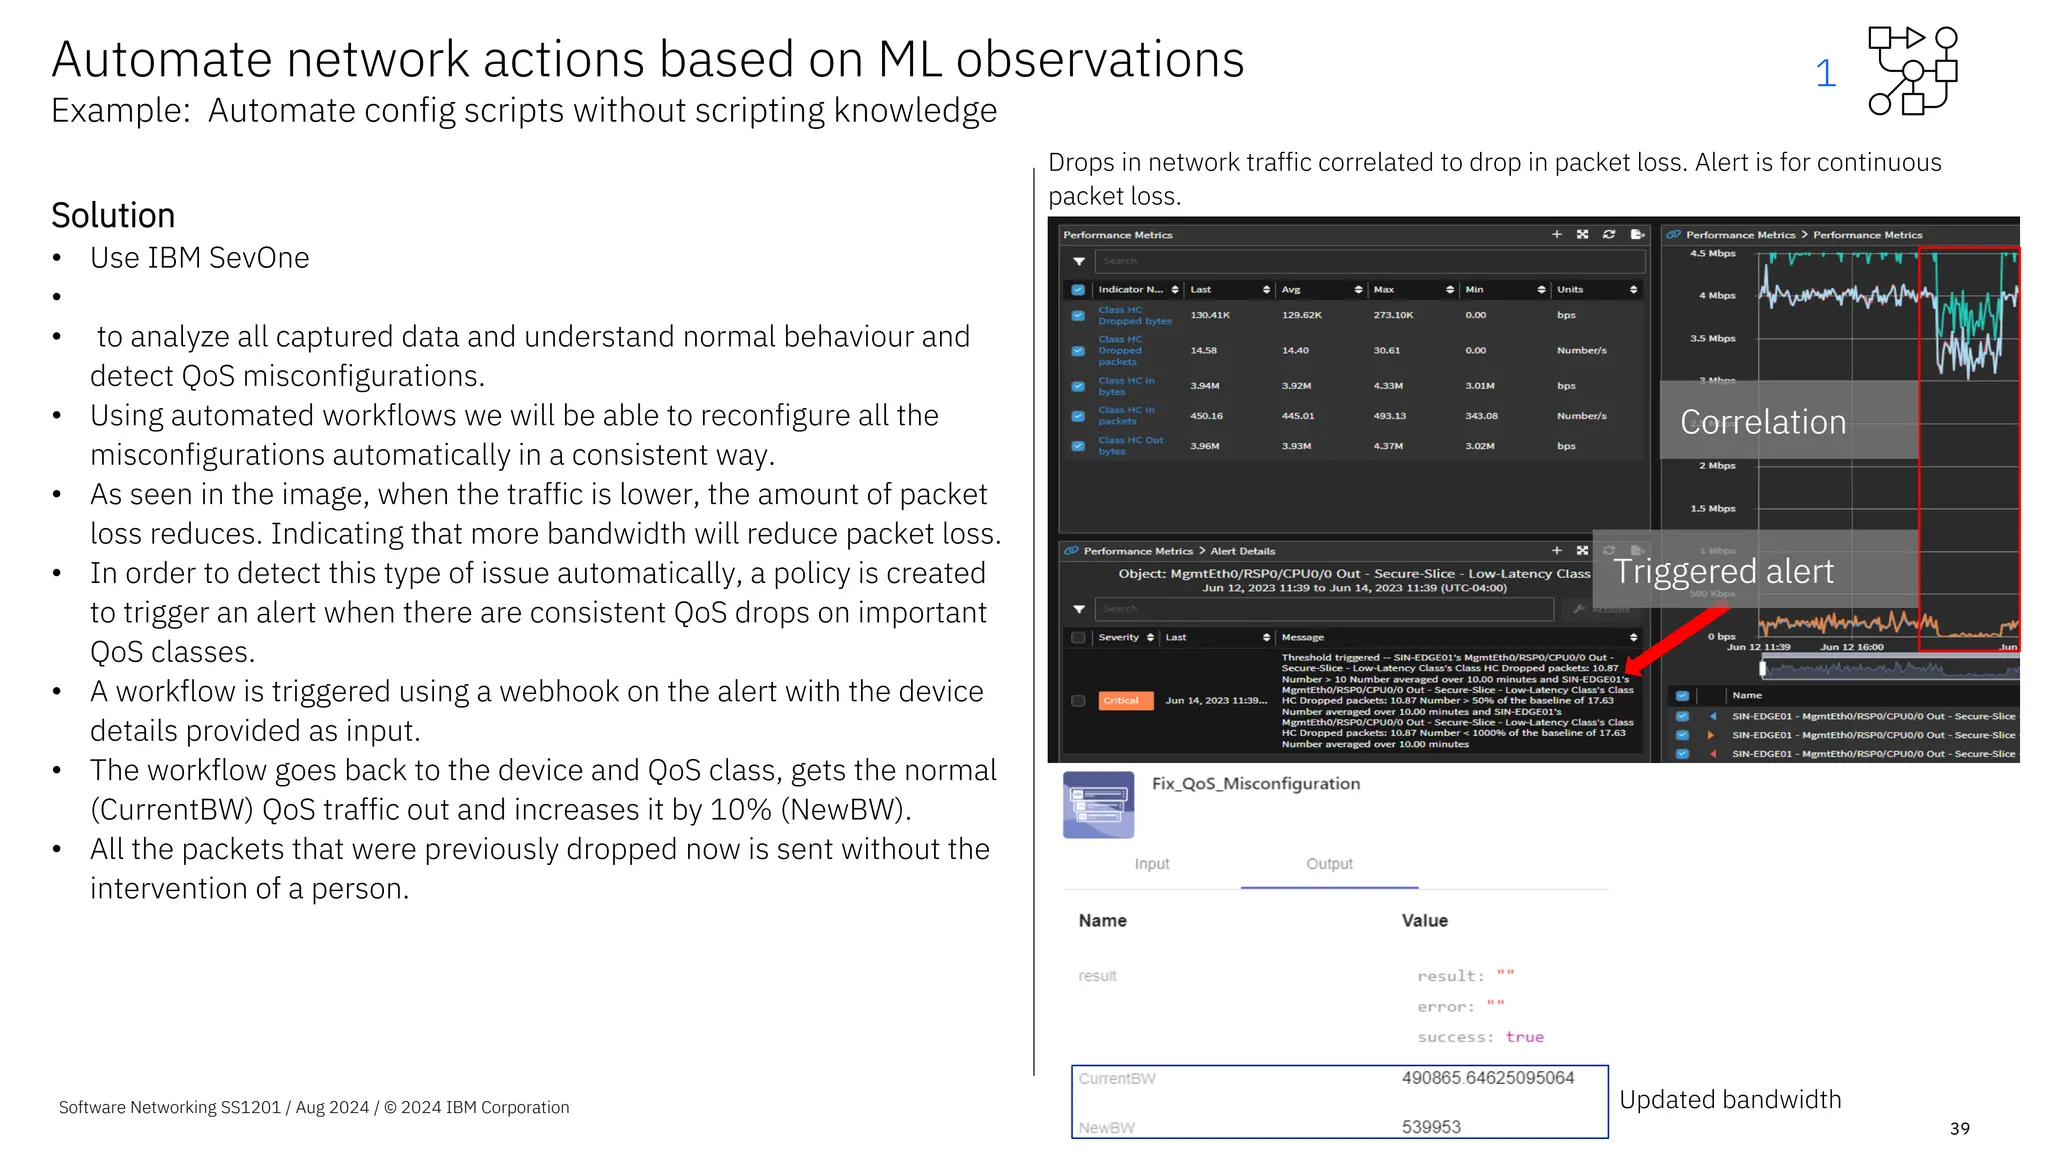
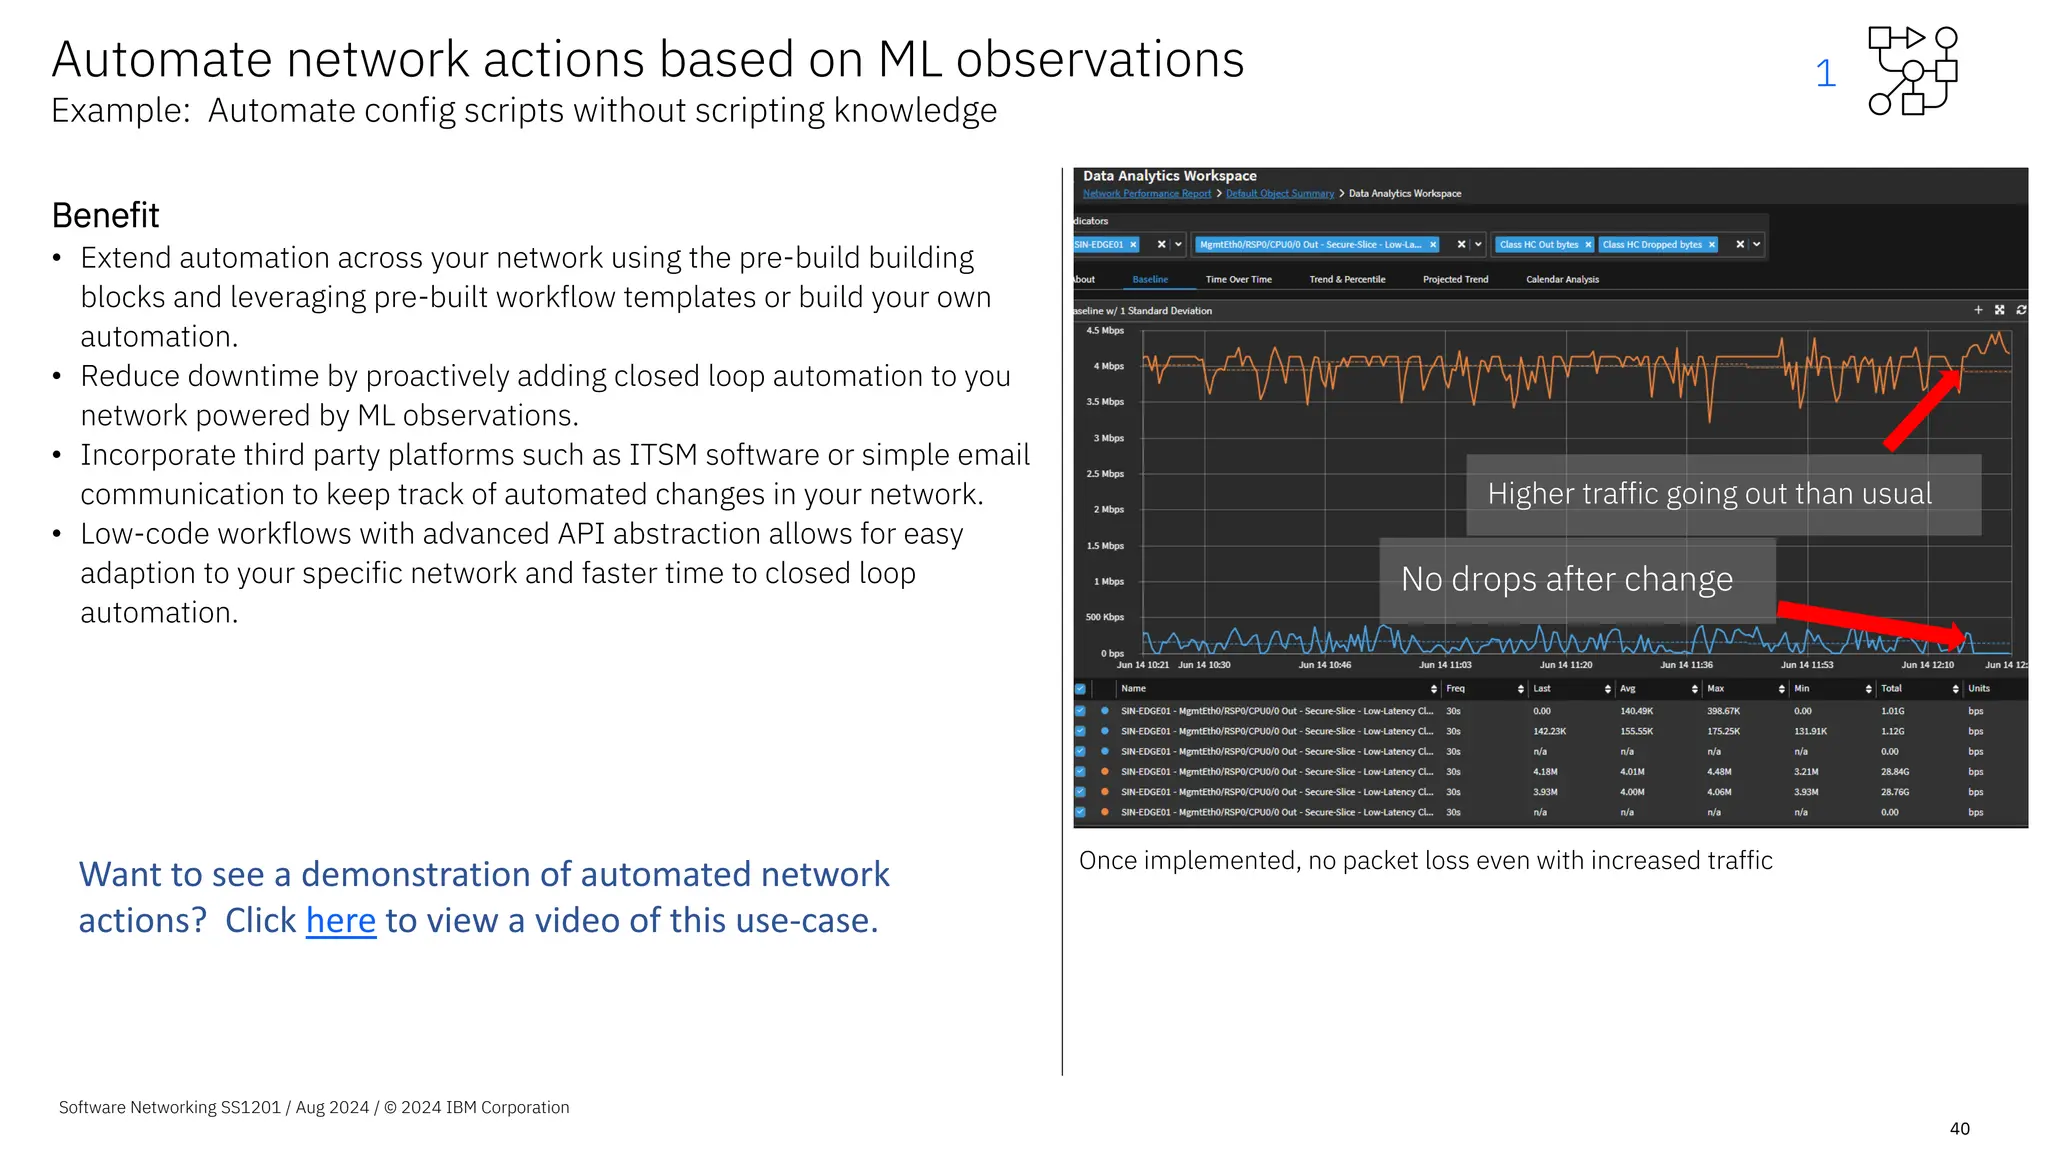
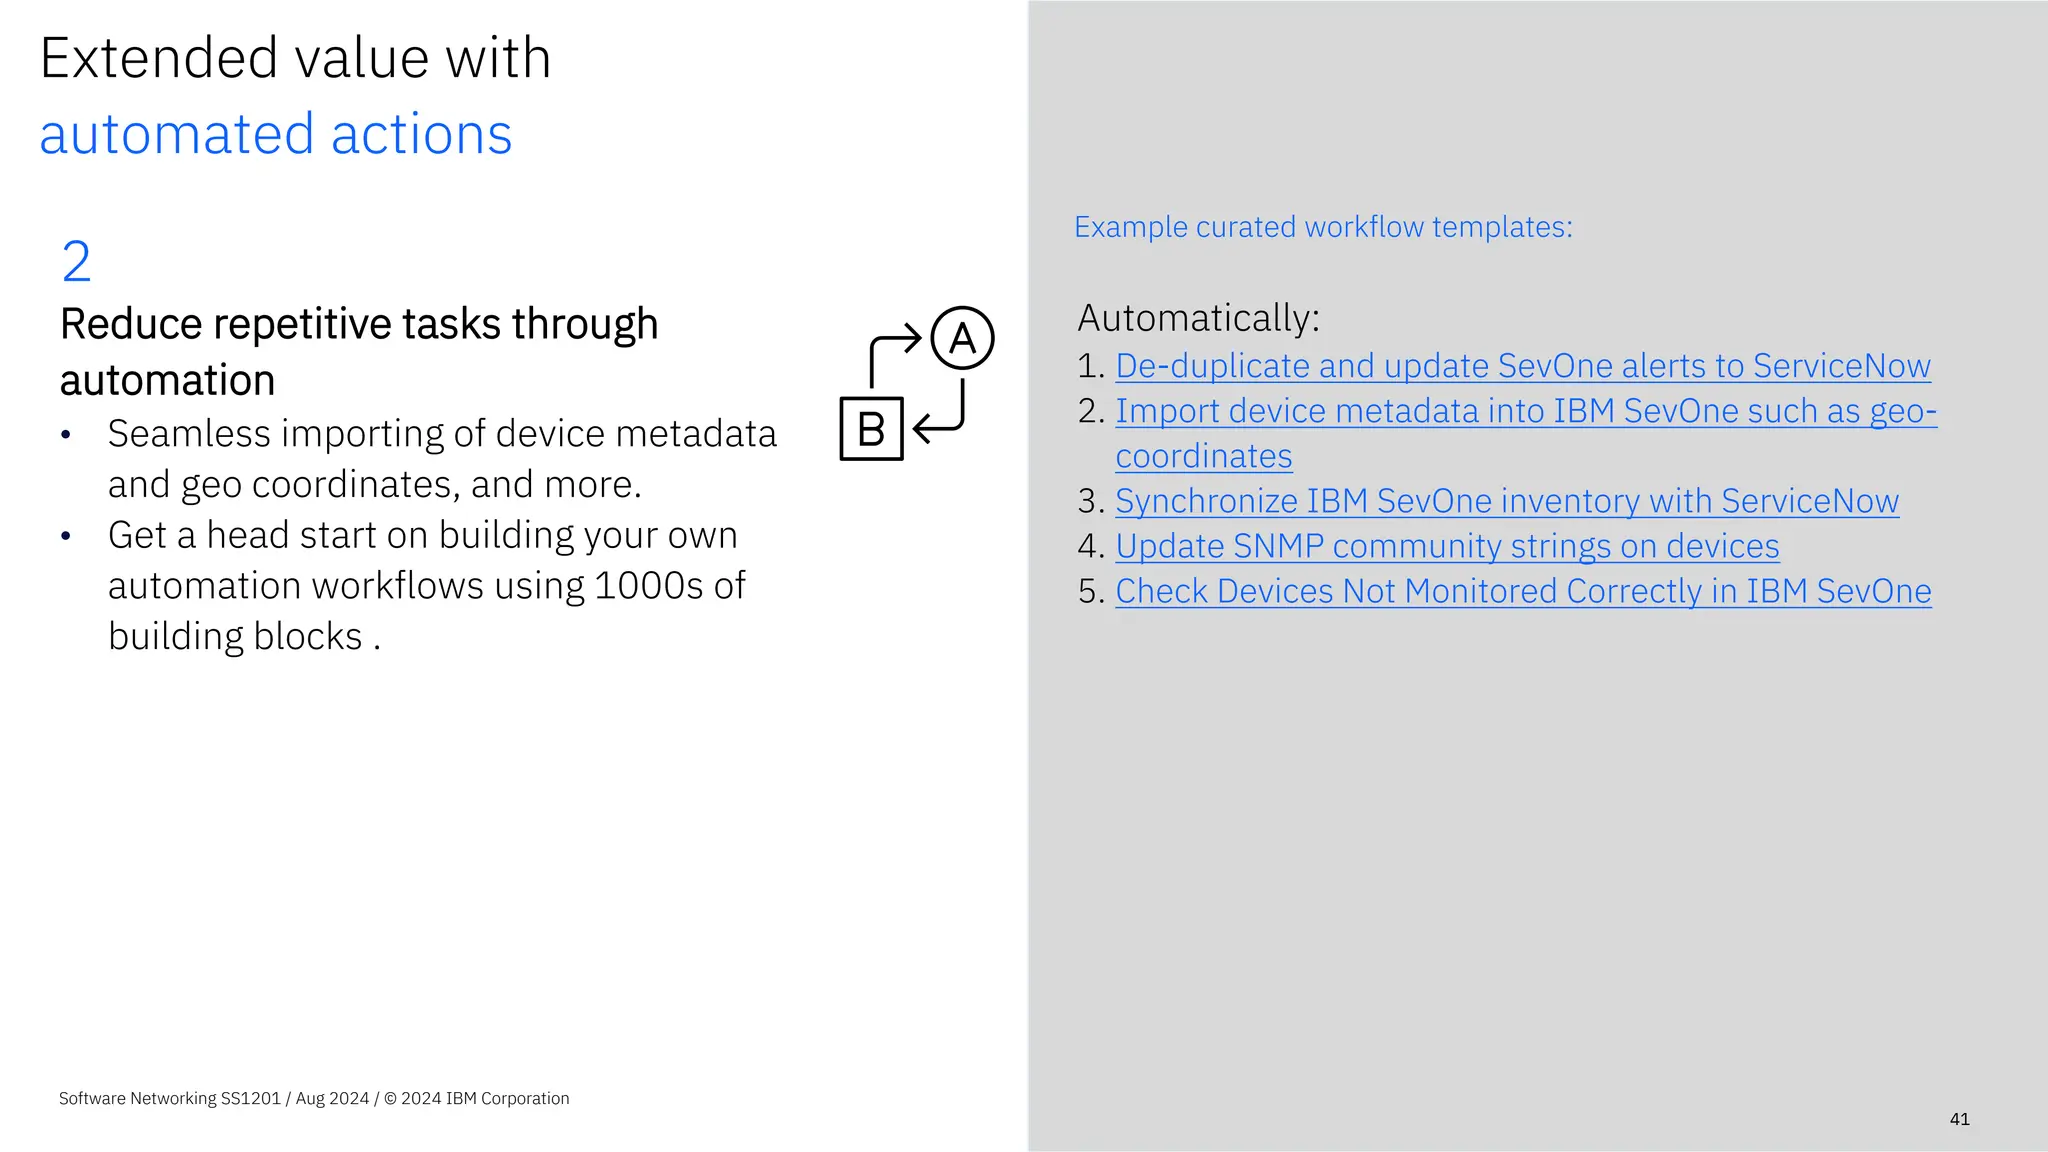
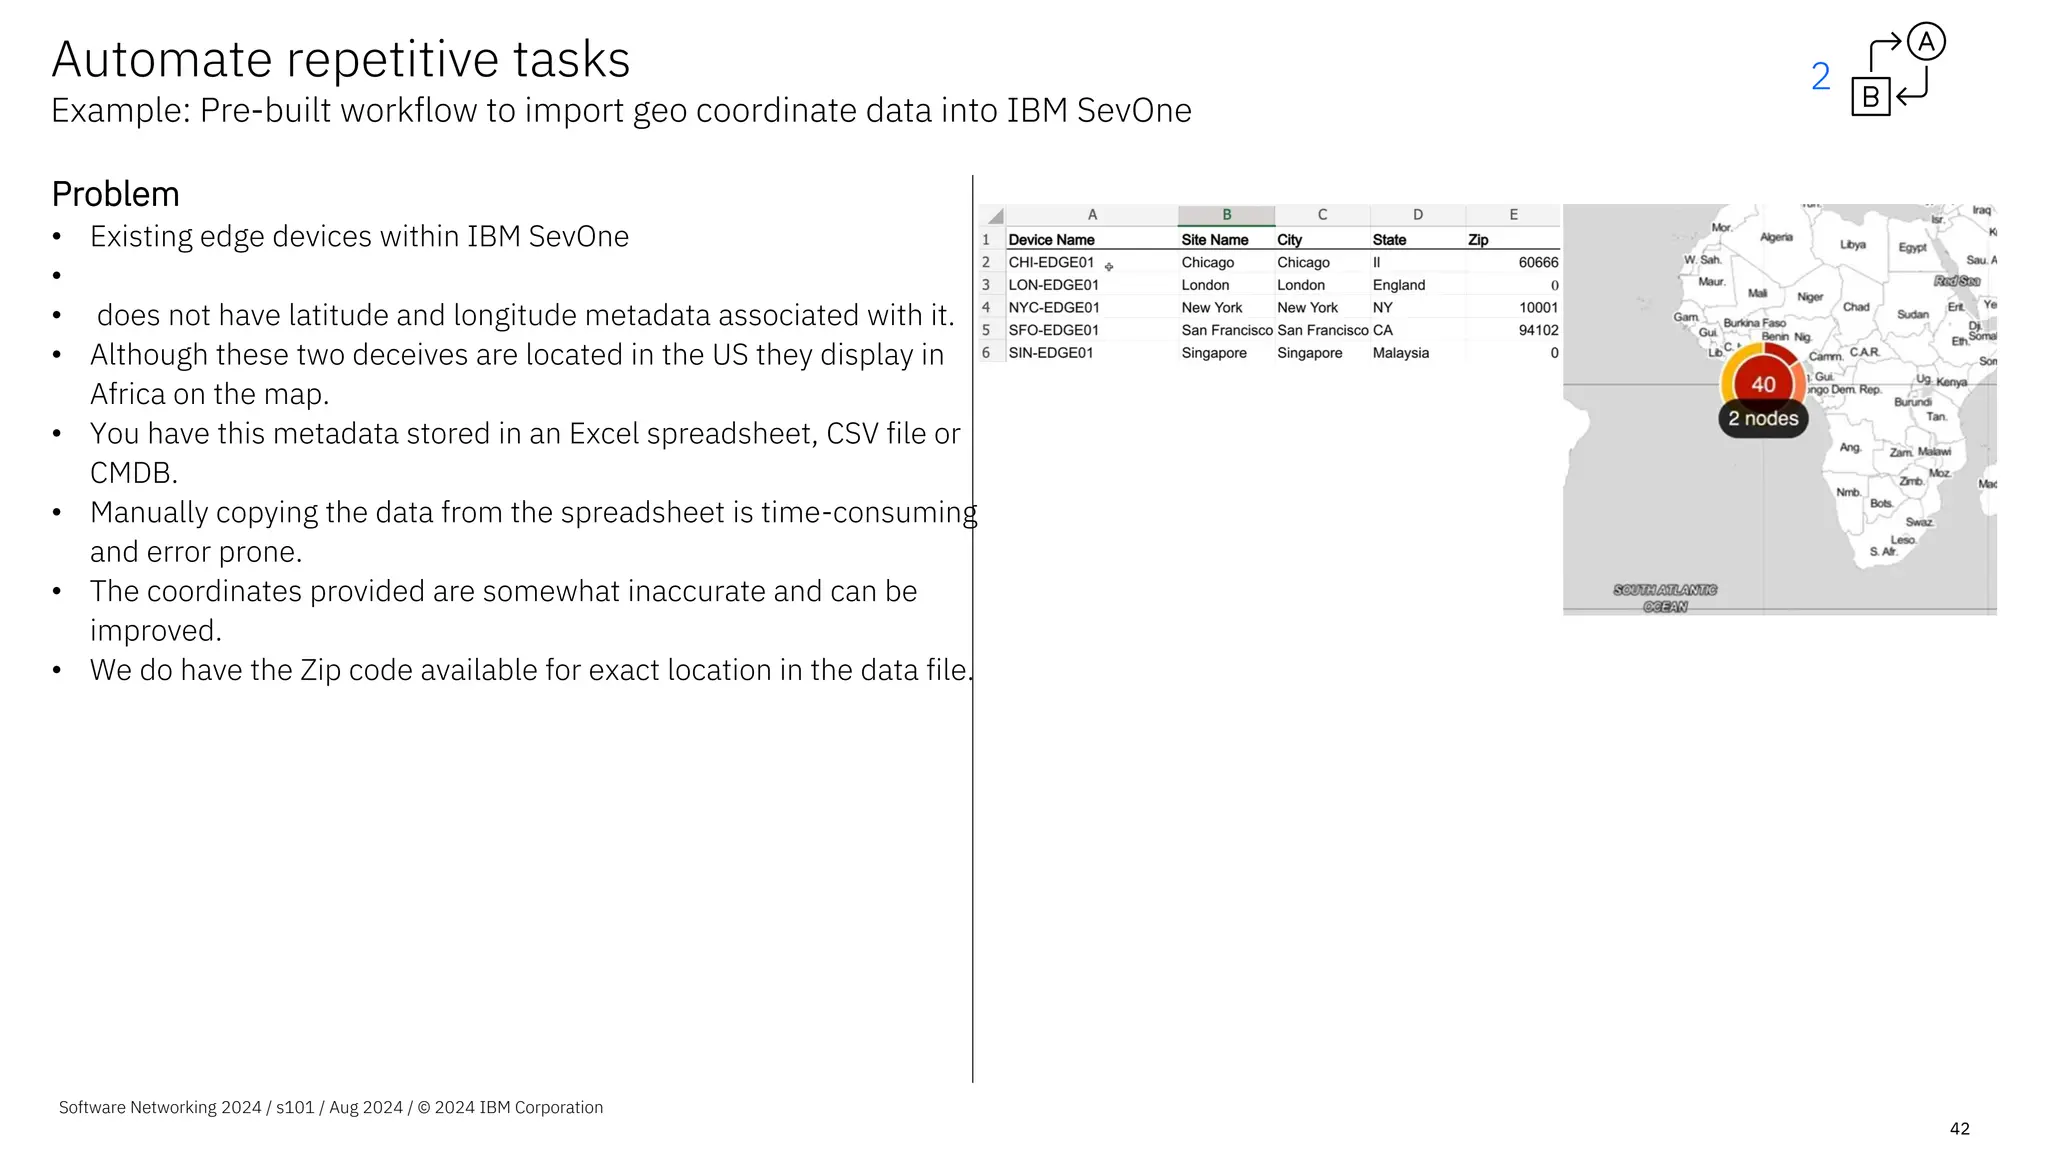
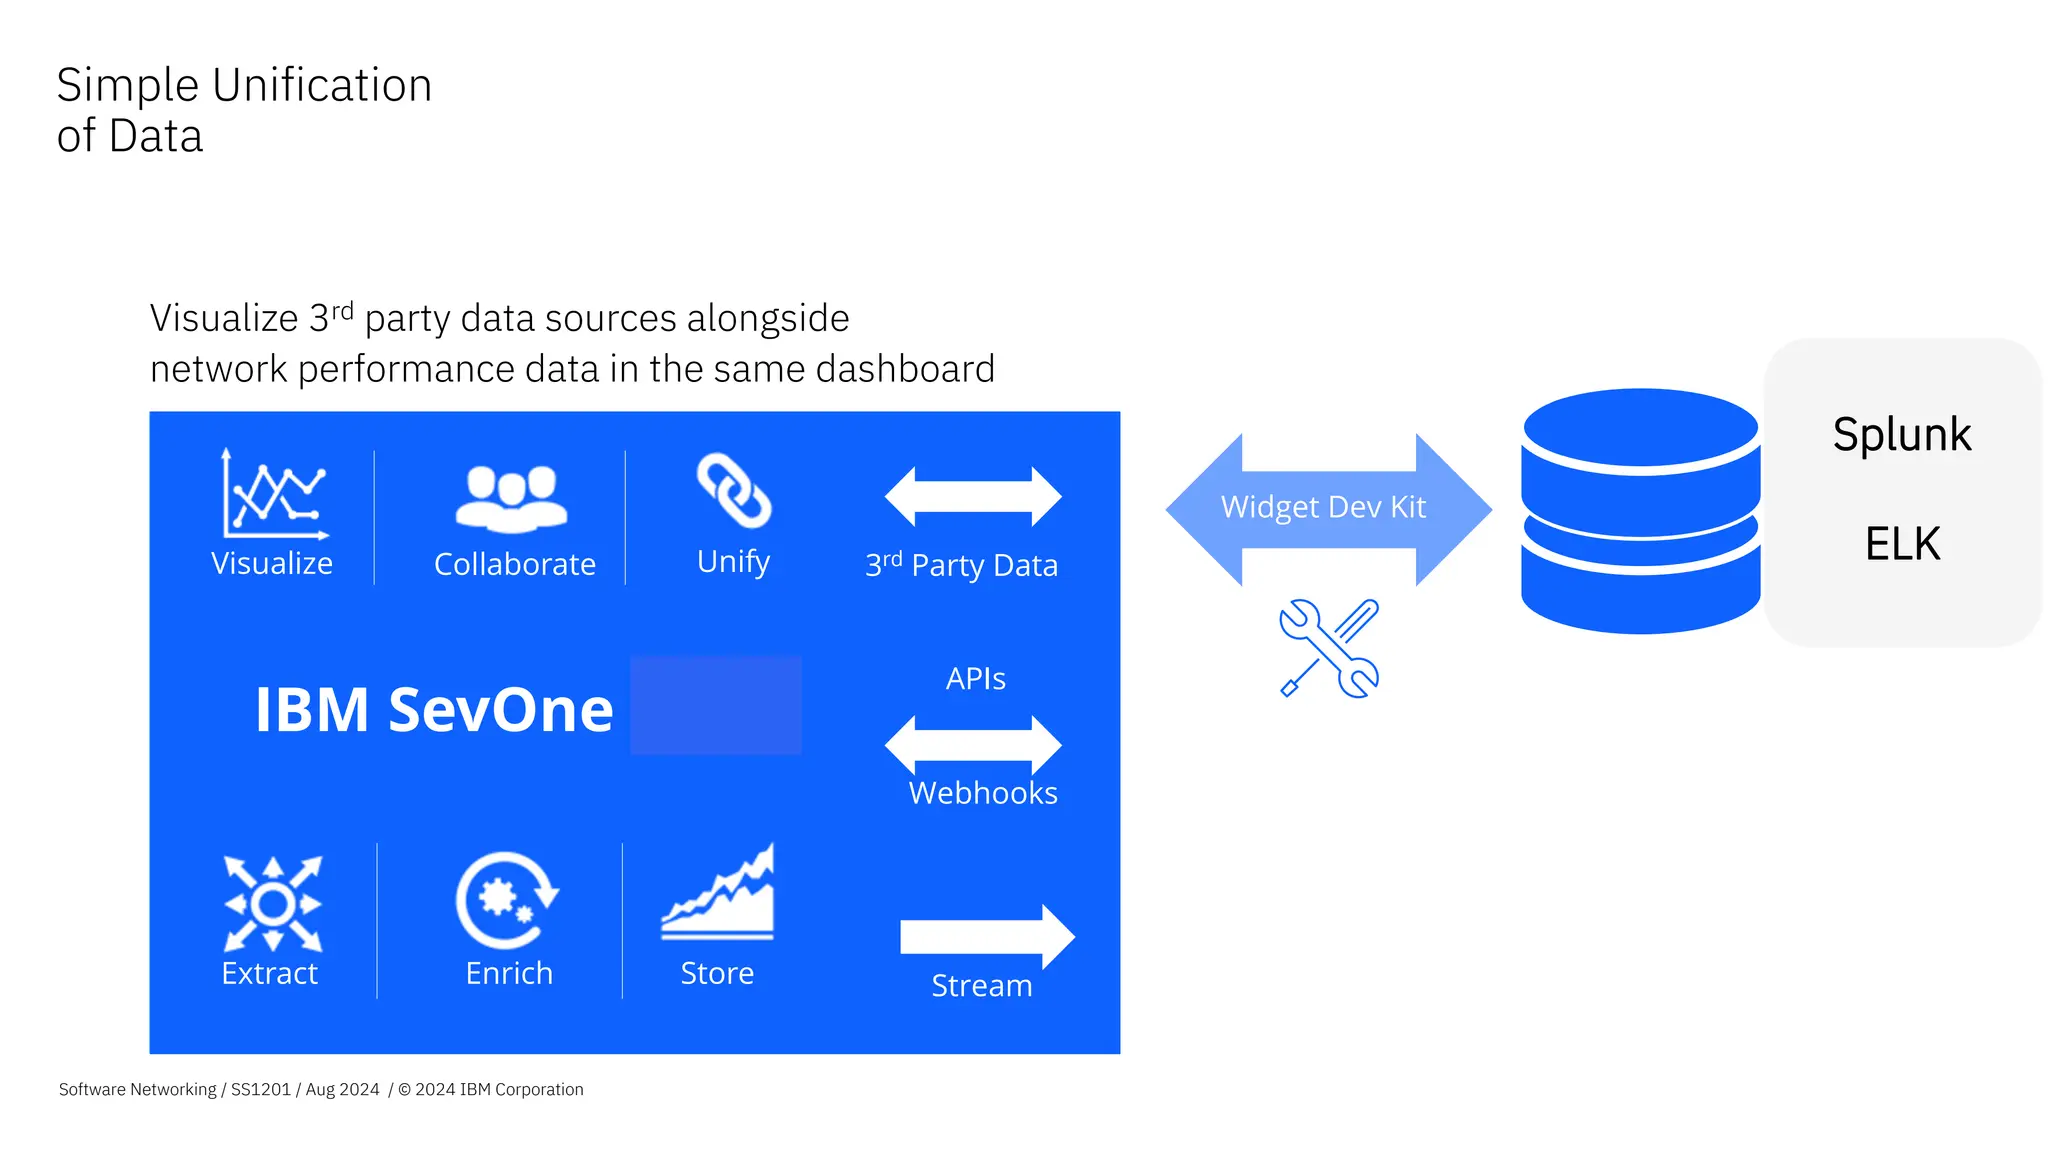
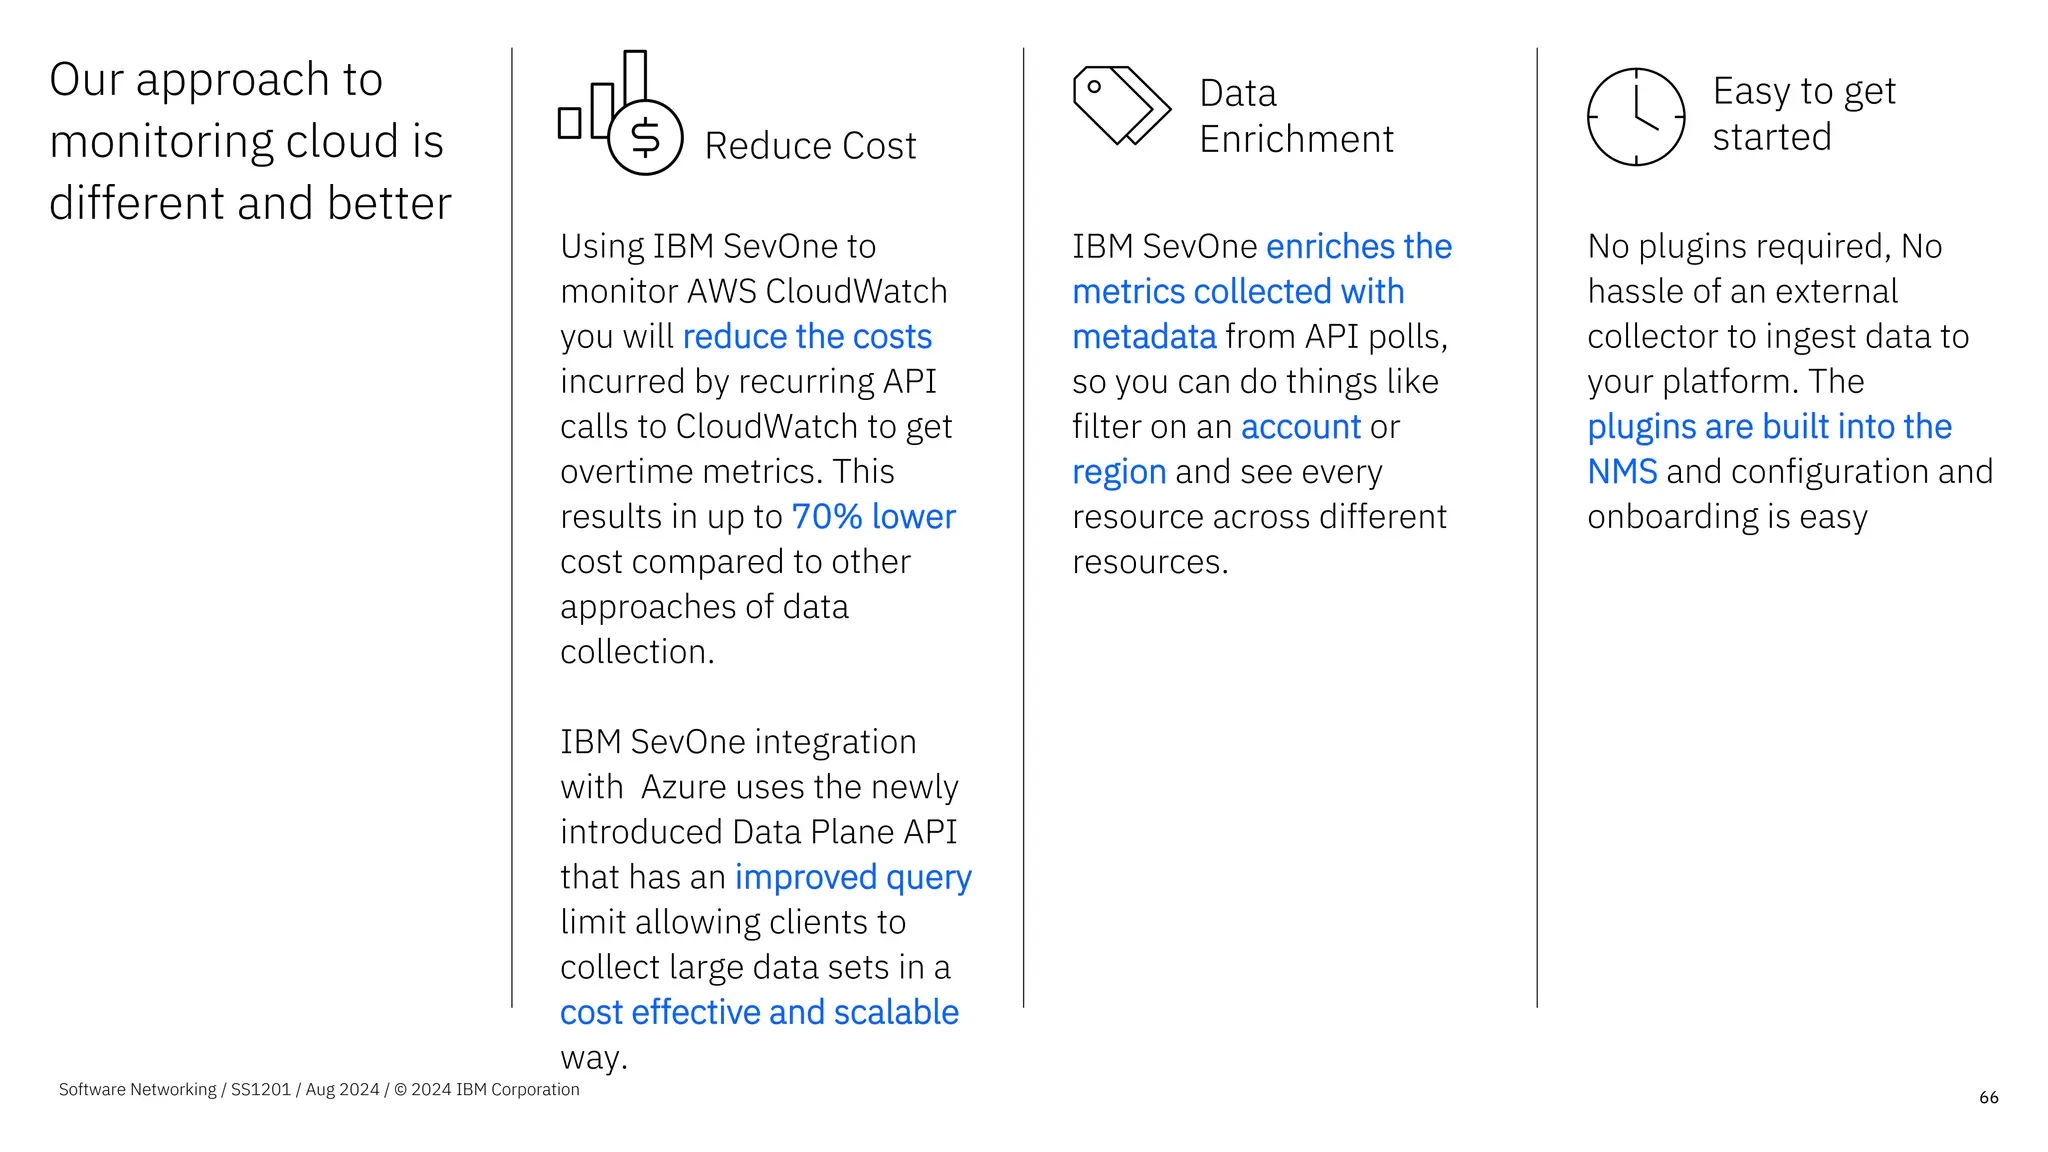
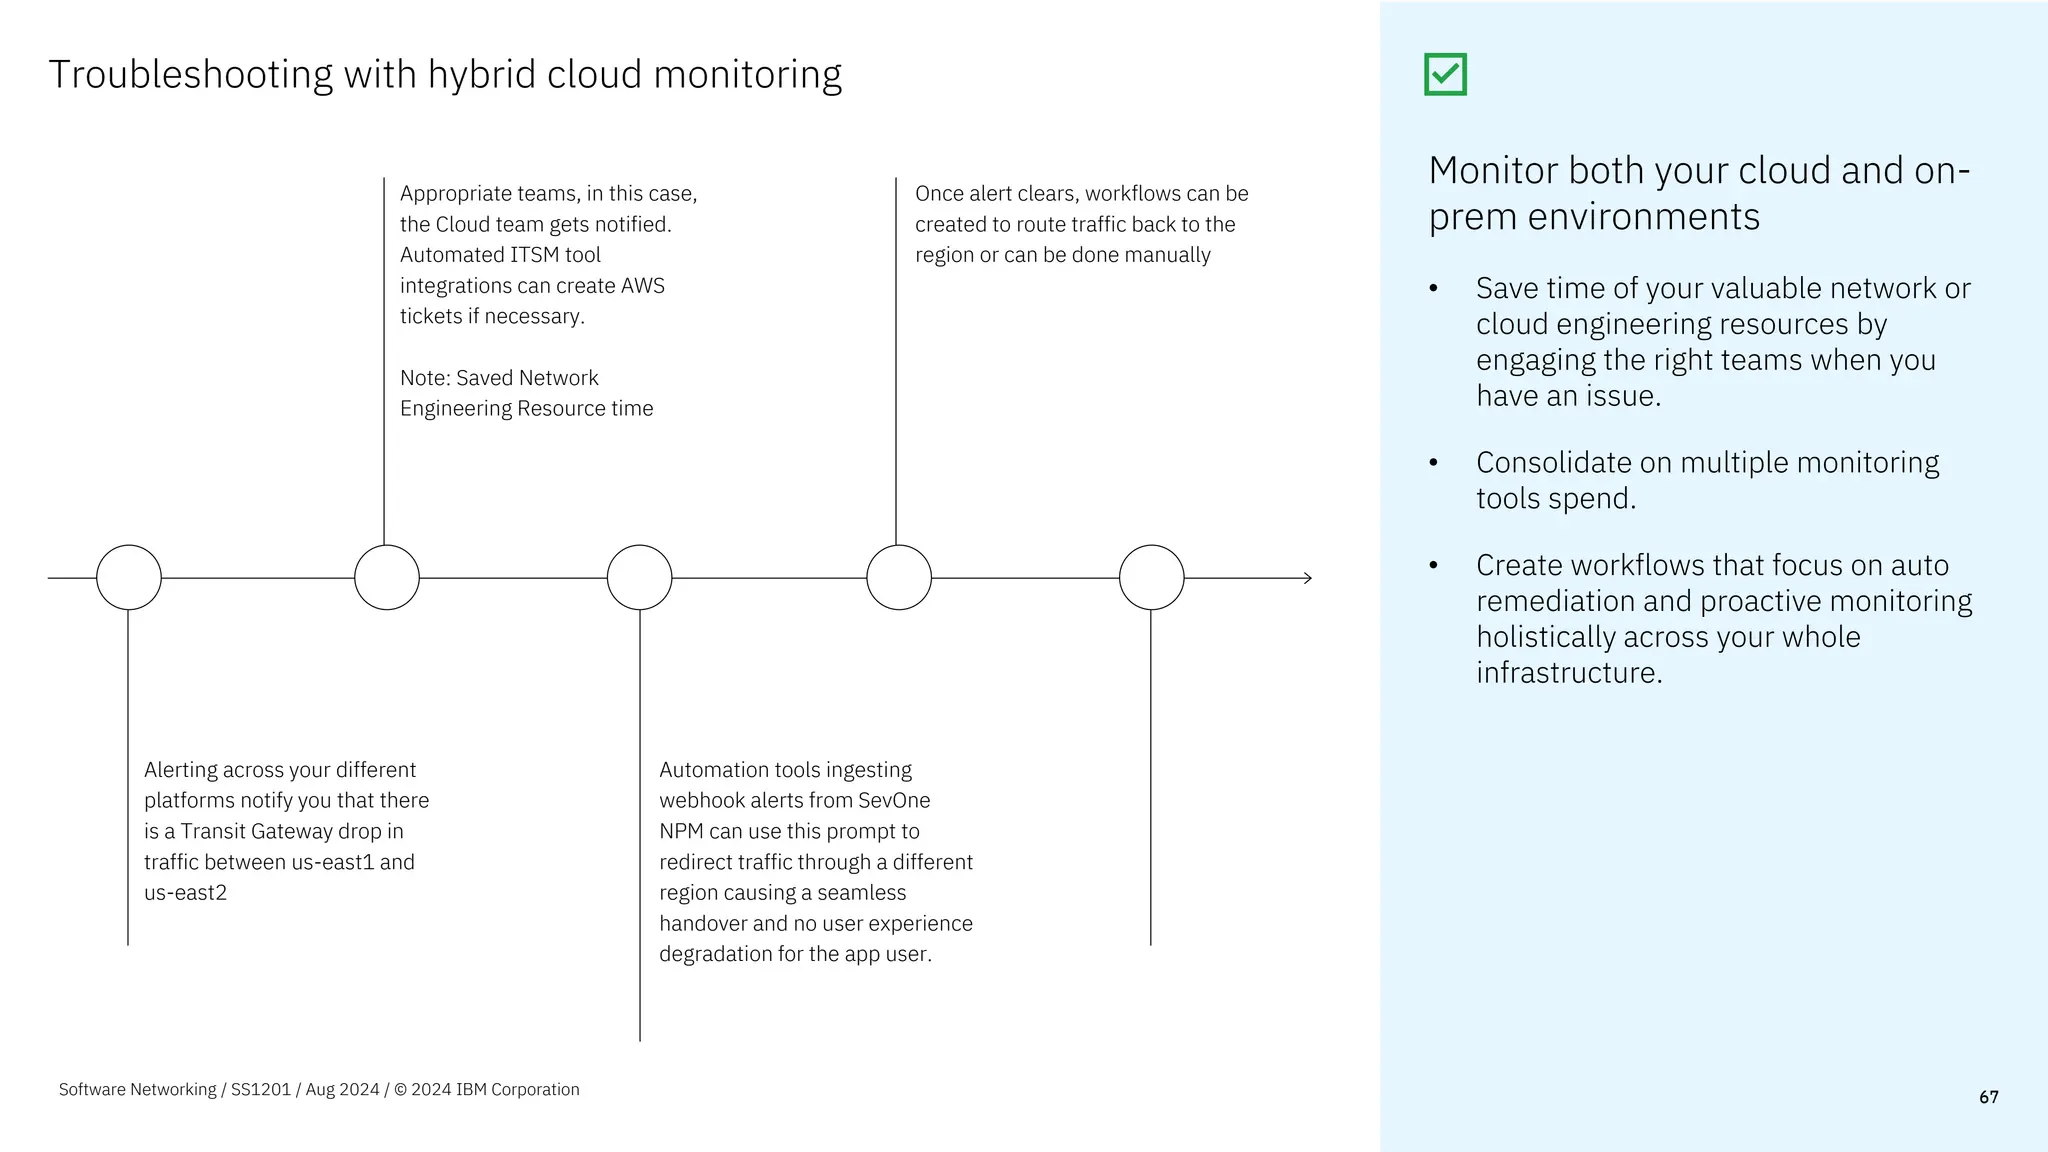
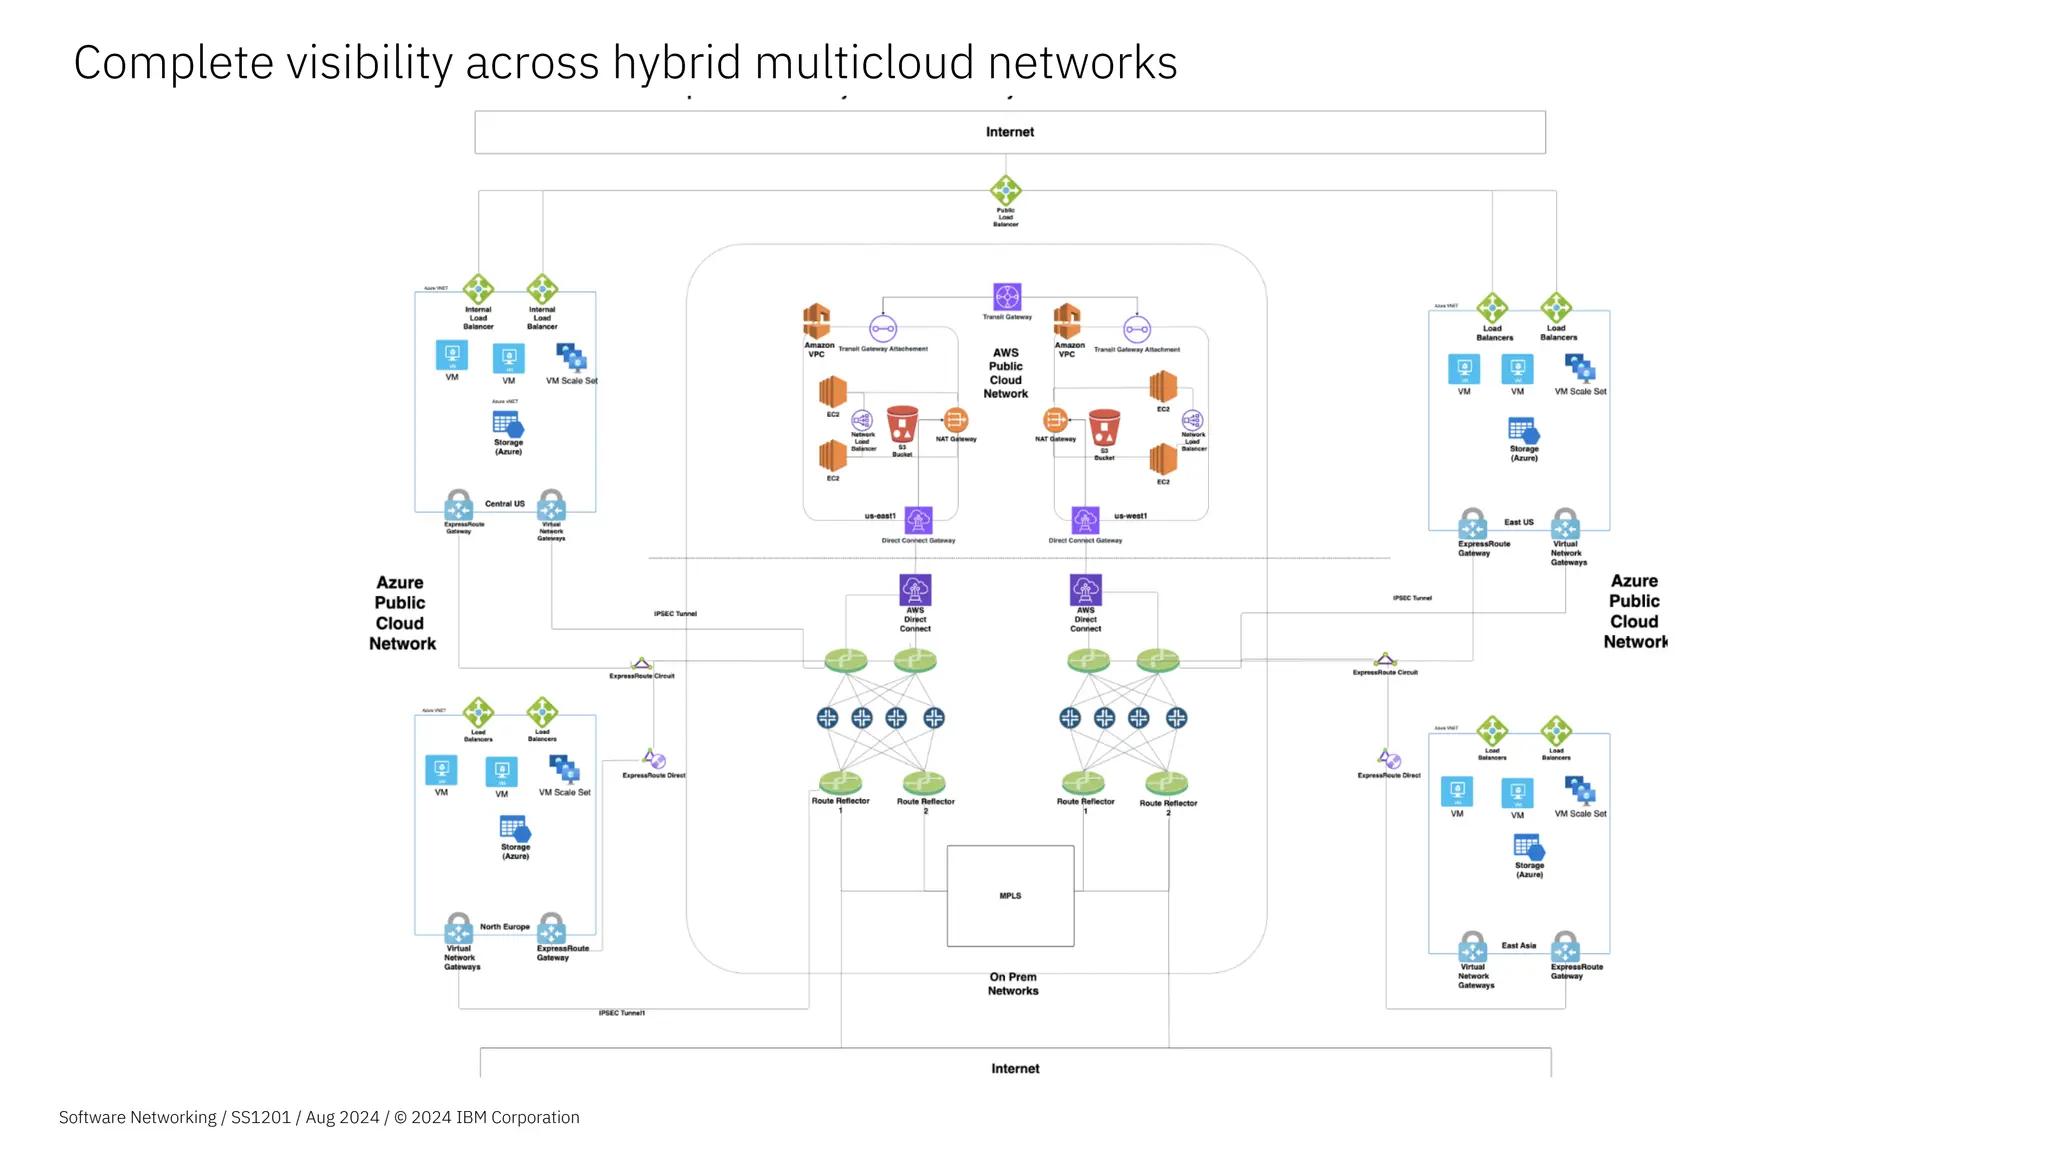
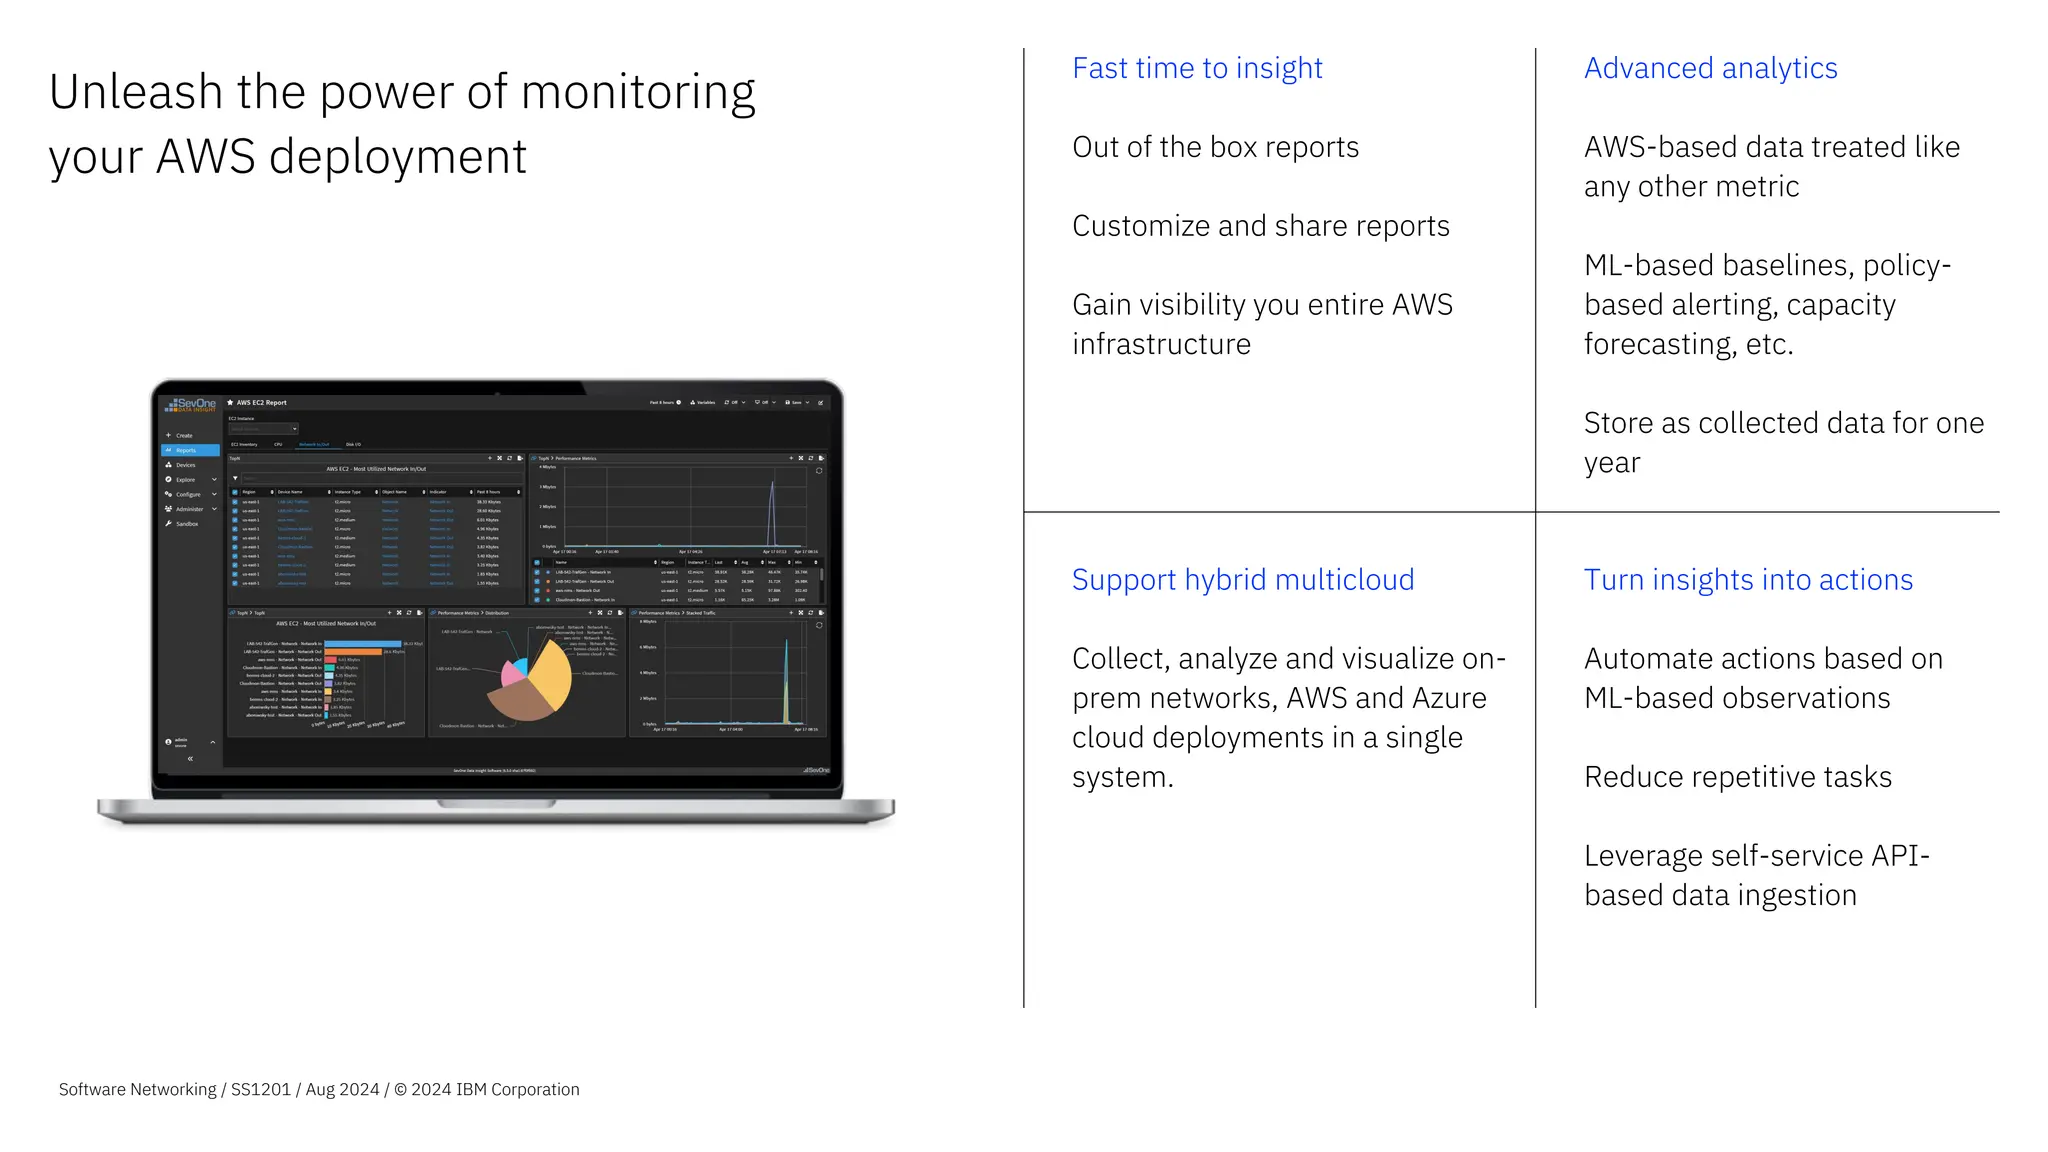
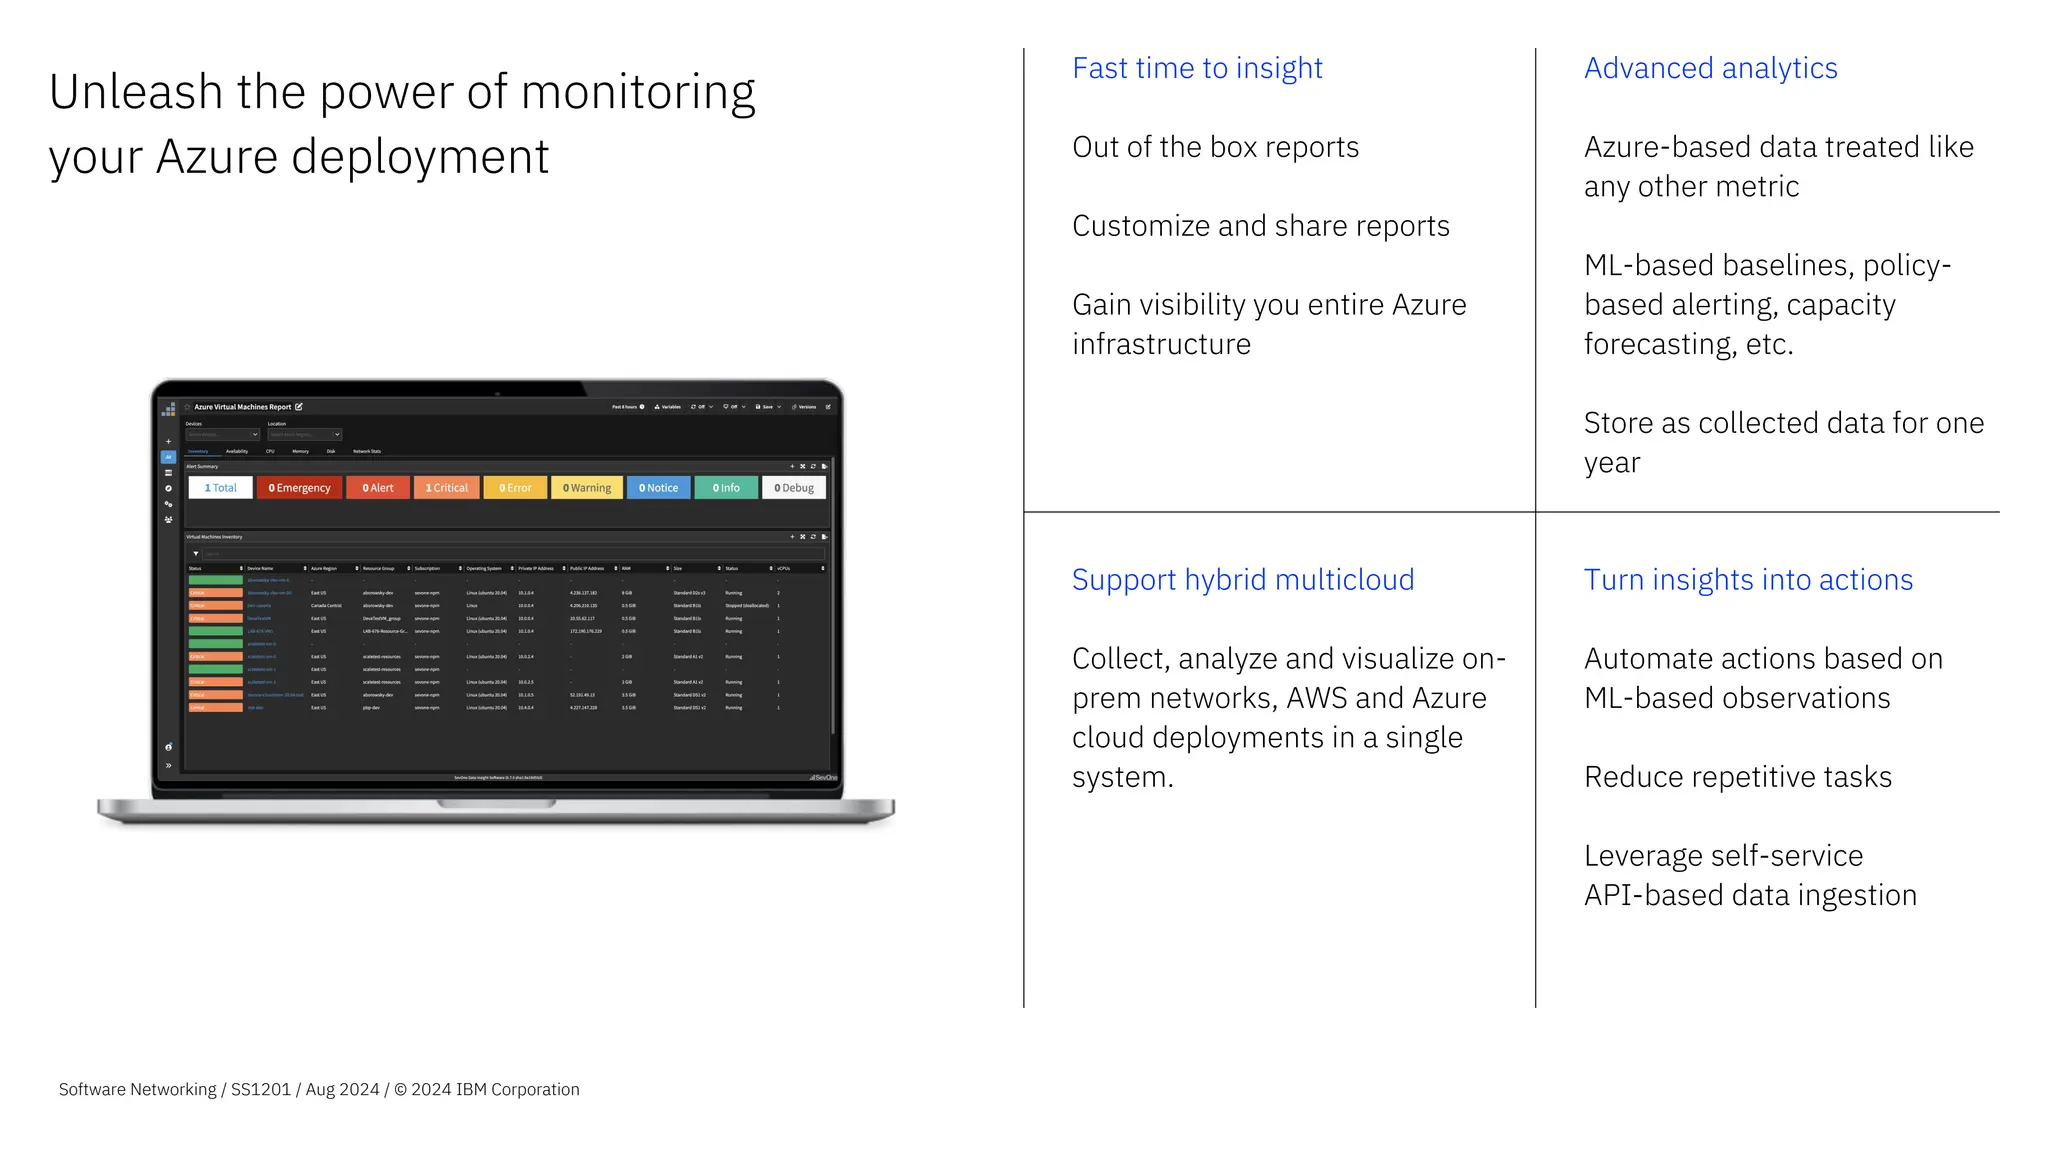
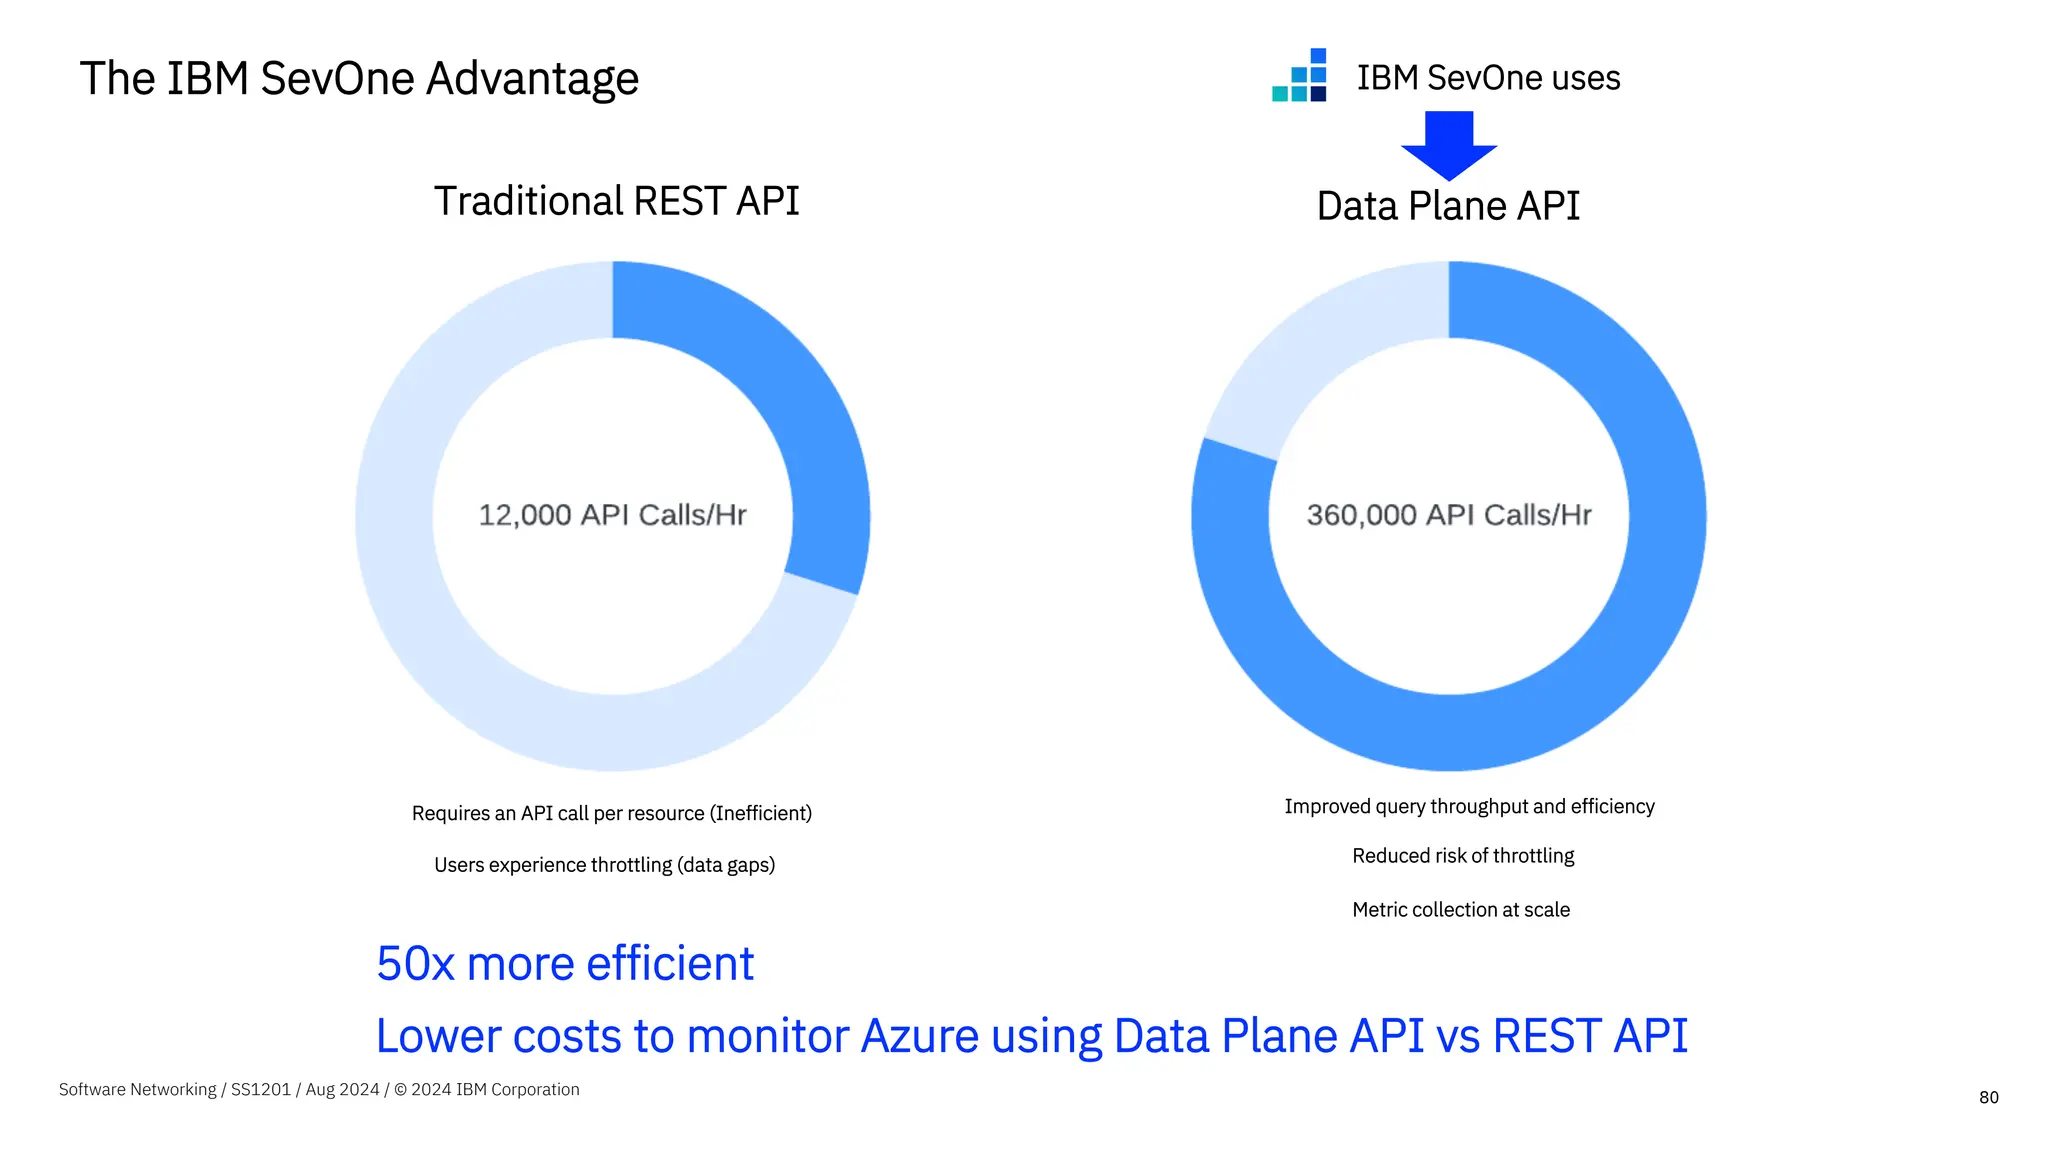
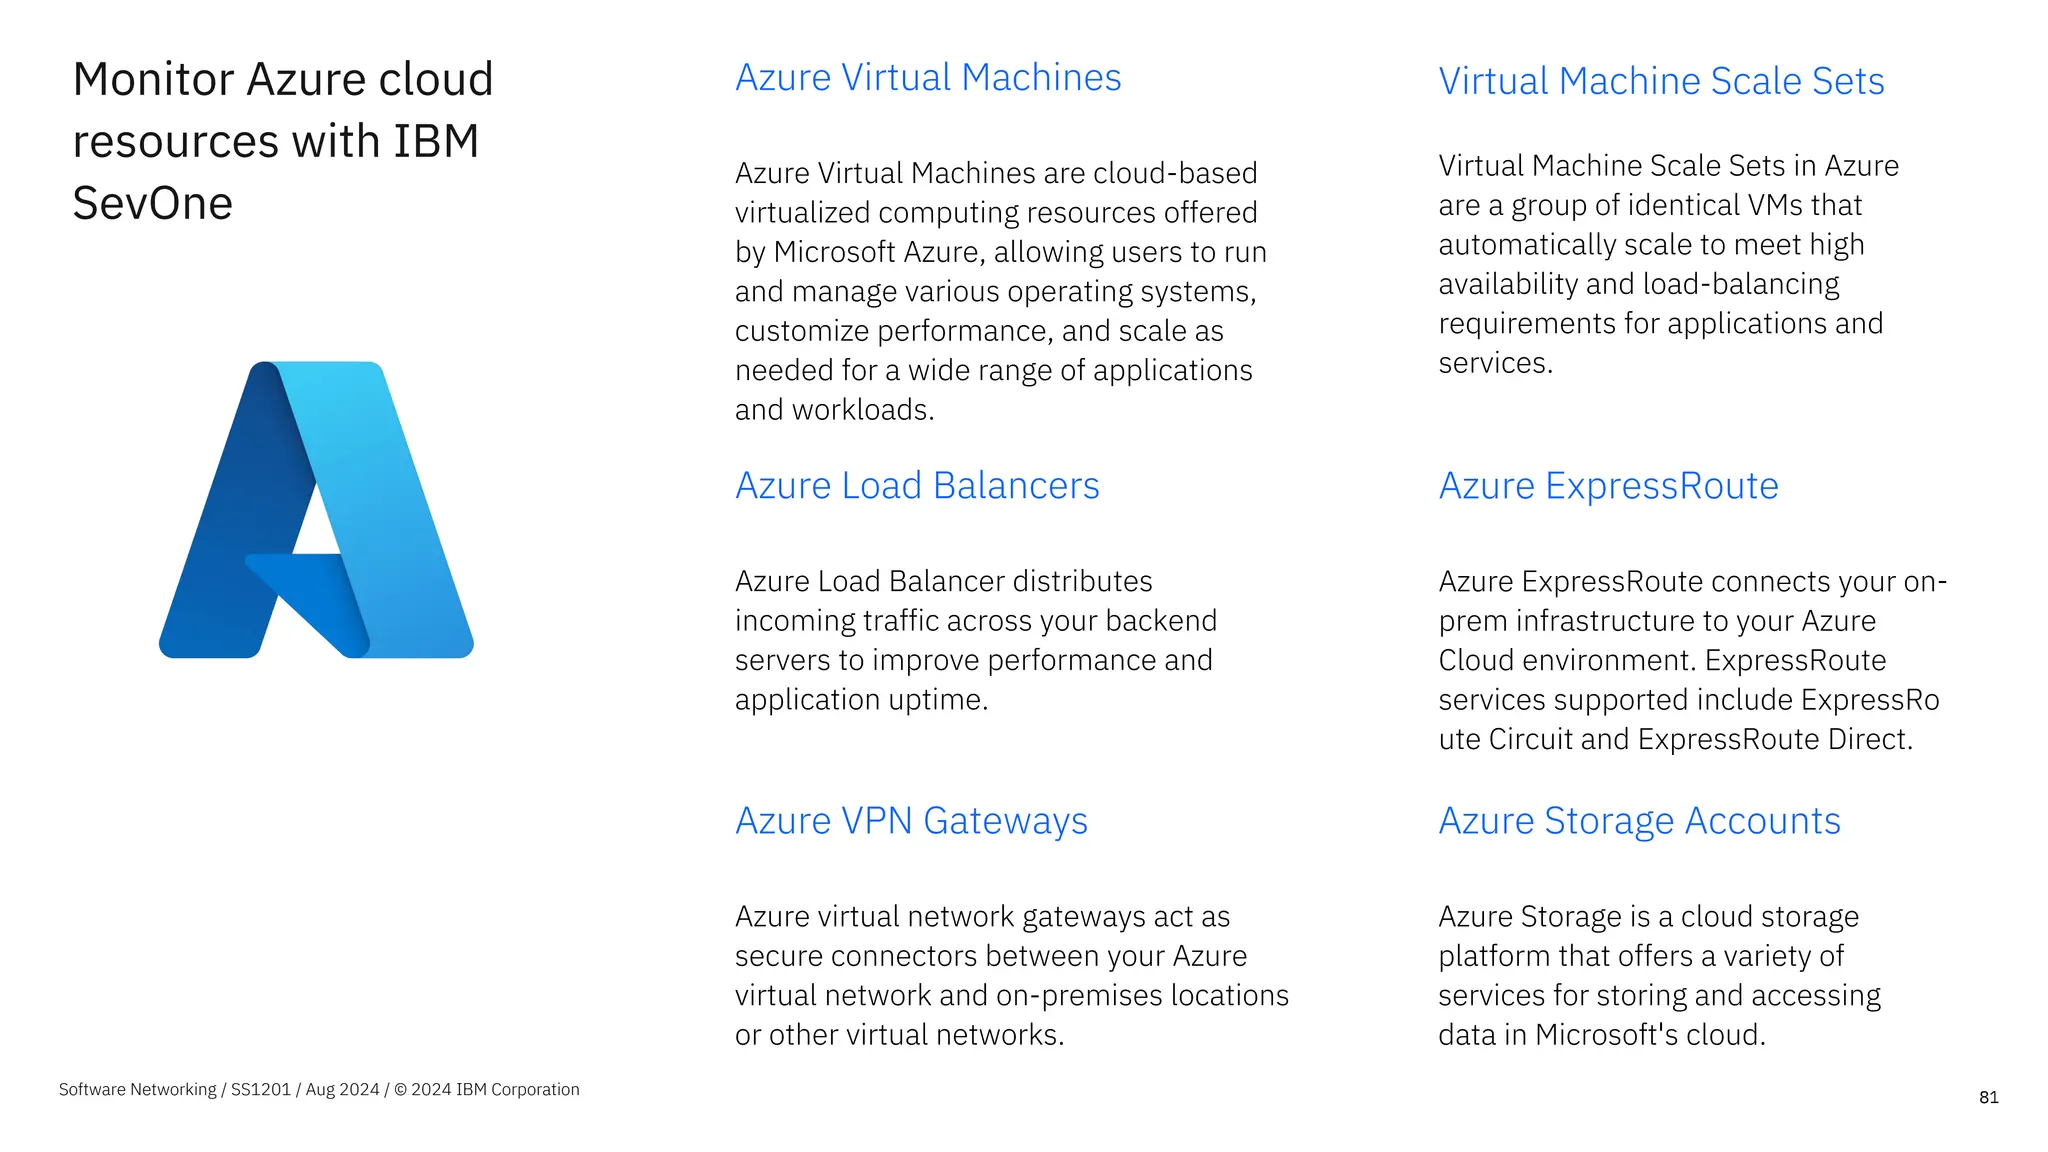
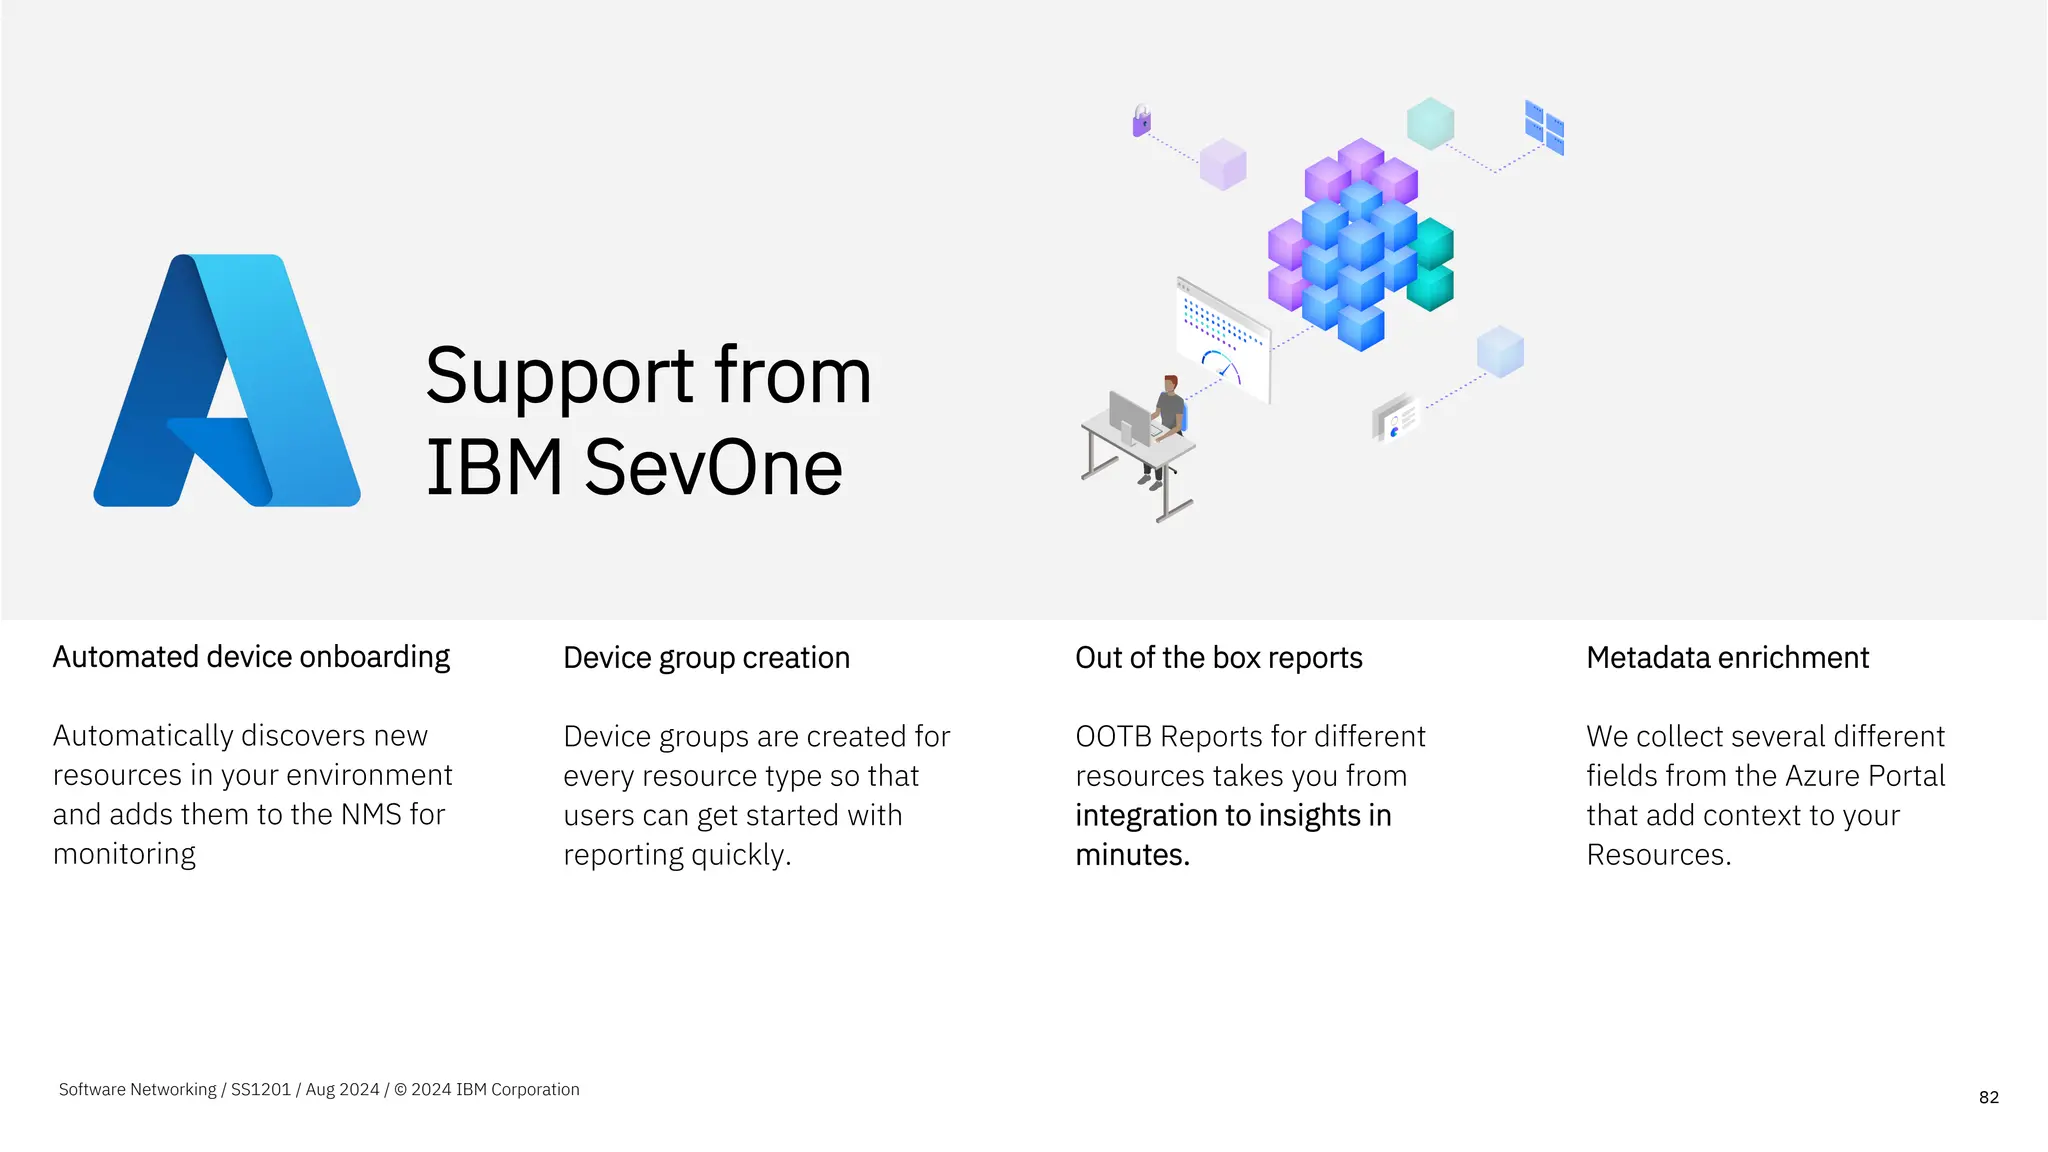
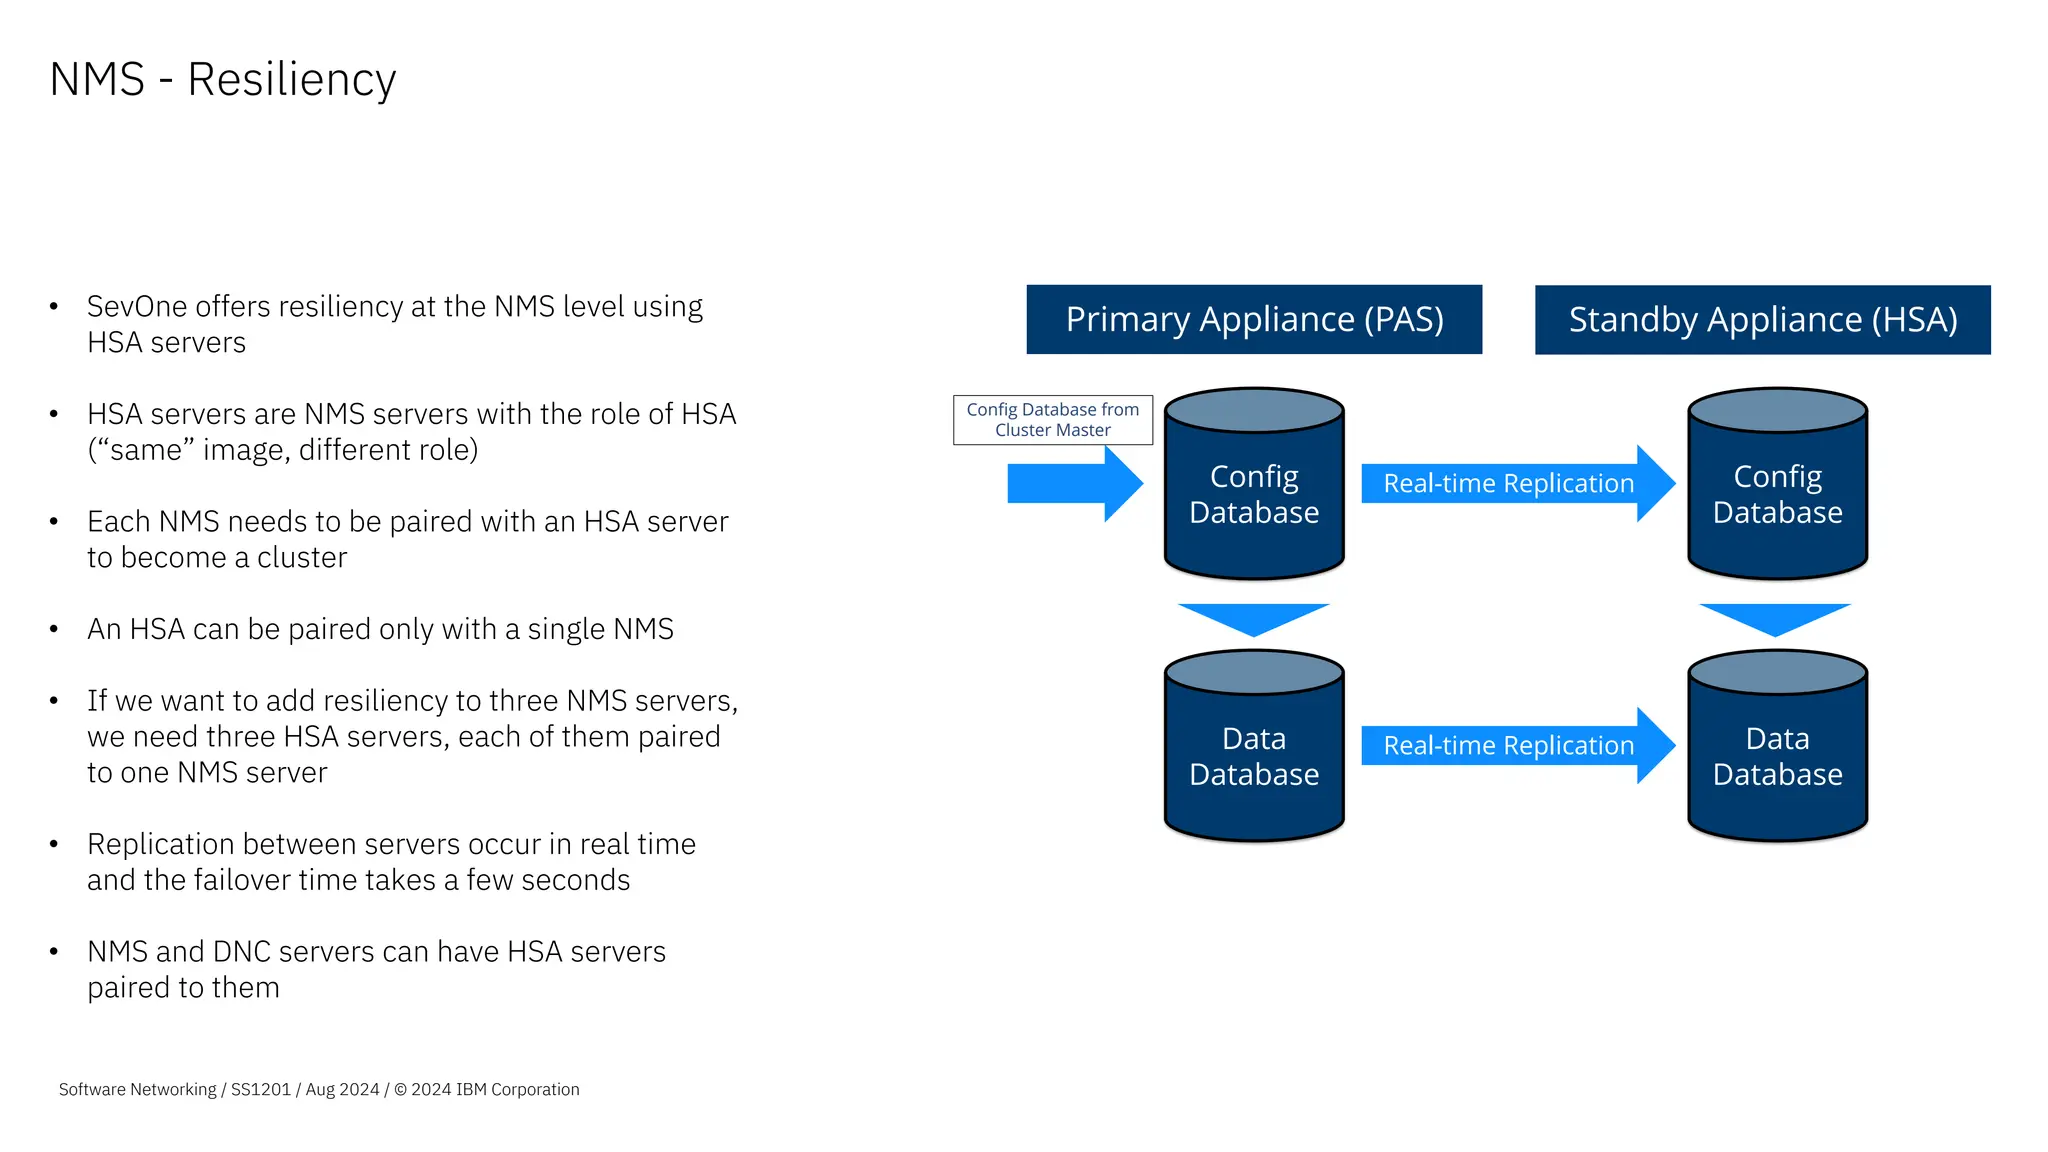
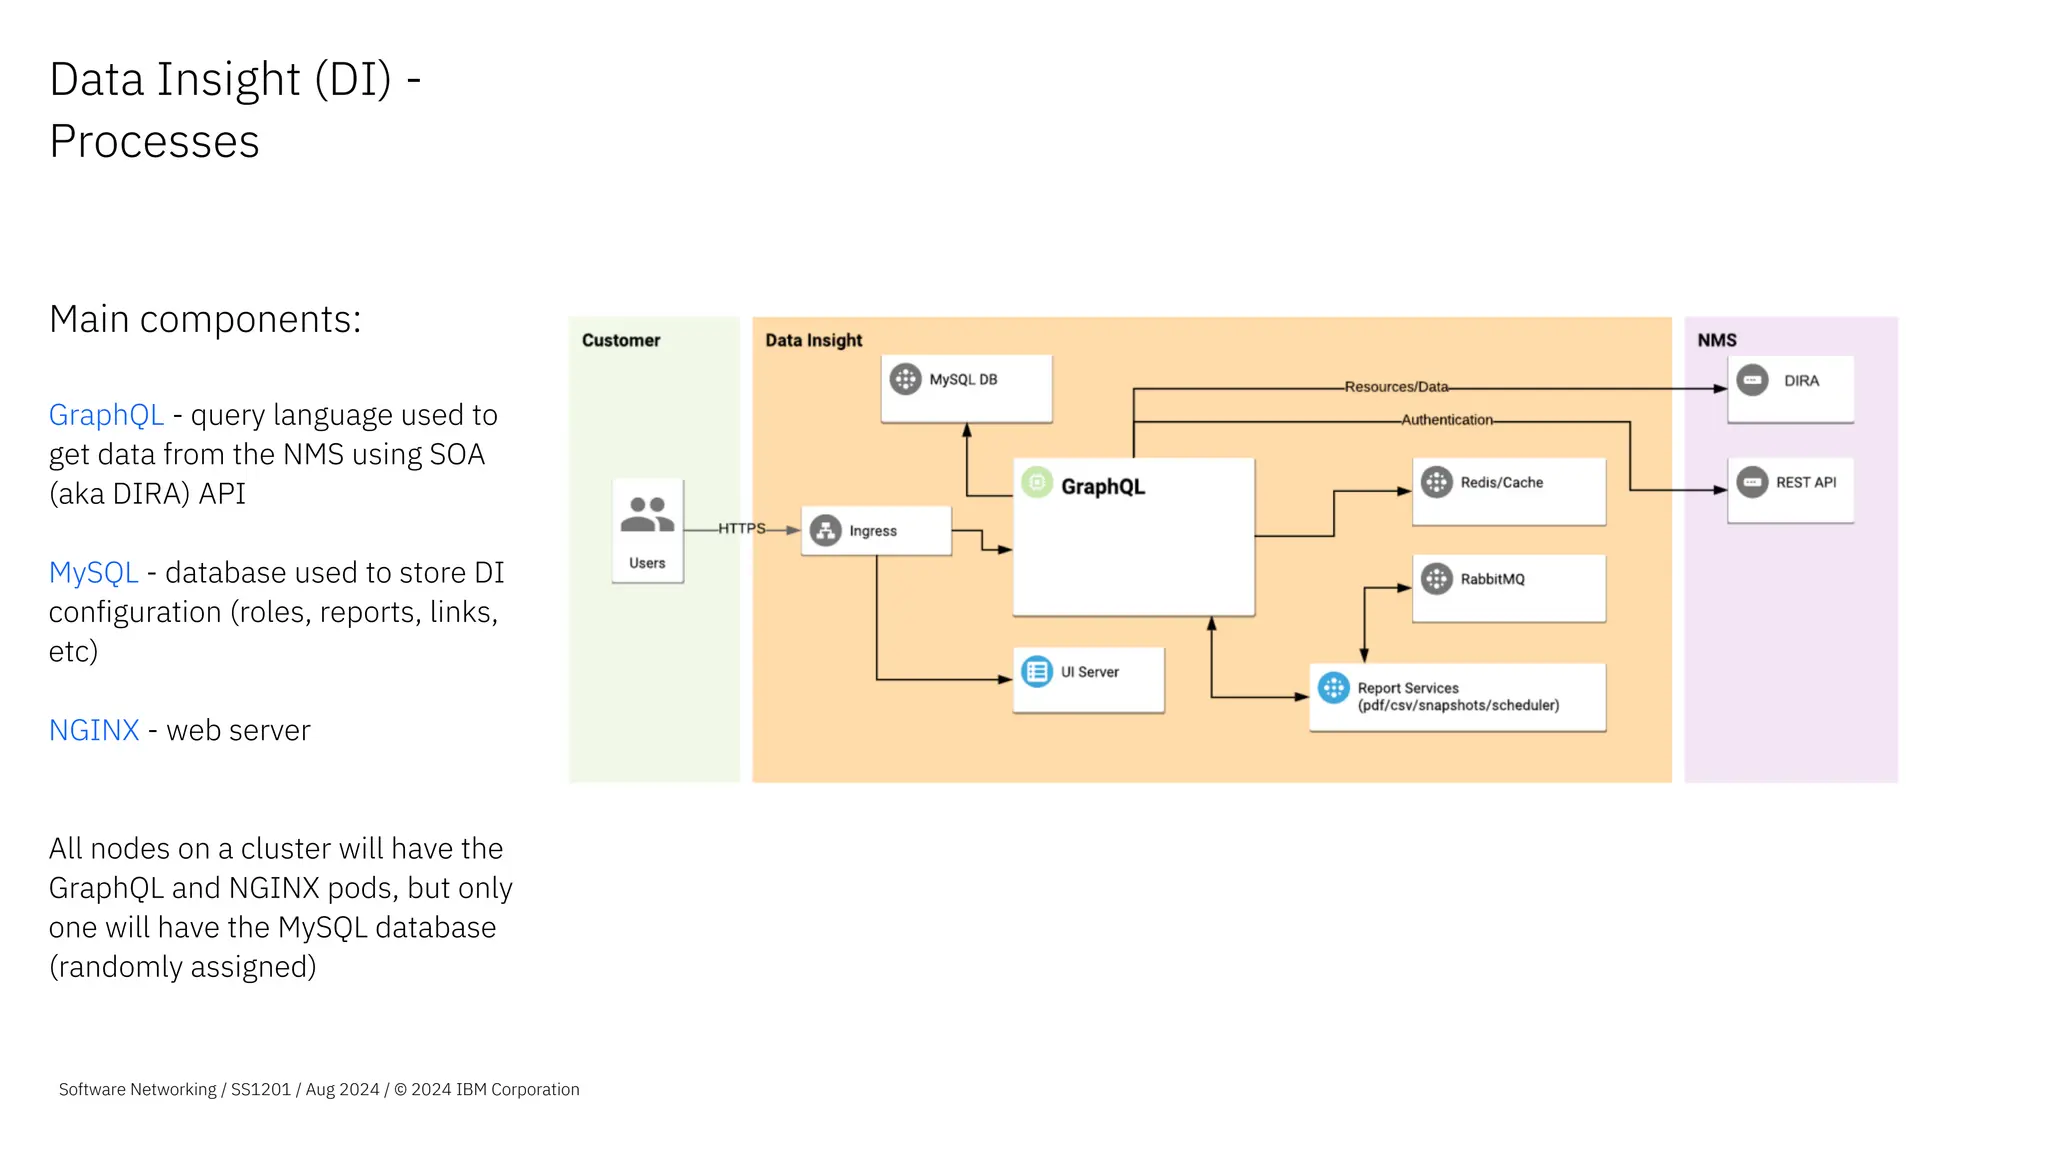
IBM SevOne
a closer look
Contents Best practices
Network visibility
ML analytics
Visualization
Automated actions
Leveraging flow analytics
How it works
Use cases
Hybrid cloud
How it works
Use ases
Packaging & architecture
IBM SevOne packaging
IBM NPM architecture
IBM RNA architecture
Integration of NPM + RNA
2
Software Networking / SS1201 / Aug 2024 / © 2024 IBM Corporation
IBM SevOne
Best practices for
continuous network
performance
FULL VISIBILITY | ANY NETWORK | ANY SCALE
MPLS WAN
SD-WAN
Wi-Fi
Campus
Branch
SDN
Hybrid
Multi-Cloud
Datacenter
4G/5G
Tower To Core
CSP & MSP
Networks
Monitoring
& Troubleshooting
SLA Management
Compliance
Capacity &
Service Planning
Tools
Consolidation
Application
Flow Data
Polled
Metrics
Network
Operations
& Engineering
Security
Operations
Service
Management
Incident
Management
Compliance
Management
Alerting, ITSM, AIOps
& Log Unification
Non-Standard
Data
Answer any question about your network and
act intelligently by turning insights into automated actions
Automated, application-centric network observability
Complete
Network Visibility
Advanced
Visualization
Automated
Actions
Streamed
Metrics
Closed Loop
Automation
Self-Service
API-based
Data Ingestion
Machine Learning
Analytics
IBM SevOne®
Software Networking / S1101 / June 2024 / © 2024 IBM Corporation
Complete
Network Visibility
Machine Learning
Analytics
Advanced
Visualization
Automated
Actions
Complete Network Visibility
• 250+ vendors metrics & flow, multi-
Domain
• 10 Day SLA new SNMP device
• Hybrid multicloud, SD-WAN, SDN, Wi-
Fi, next gen branch 5G
• Self-service API-based data extraction
• One year as polled retention
Best practices for continuous network performance
Step 1 – Complete network visibility
© 2022 IBM Corporation
Software Networking / April SS1201 / Aug 2024 / © 2024
Software Networking / SS1201 / Aug 2024 / © 2024 IBM Corporation
Network Metric Collection - 100%
Application Flow Collection - 100%
Next Gen Network Collection Ready- 100%
High Availability Monitoring
Insight via Baselining, Analytics & Alerting
Executive Reports and Troubleshooting
Workflows
Automated Actions
Public Cloud Campus Networks
Software-Defined
WAN + Datacenters
4G/5G Mobile Networks
Branch Networks
Enterprise
Wi-Fi
HTTP
APIs
Application Flow Data
Non-Standard Data
DNS
Windows WMI
ICMP
SNMP
Polled Metrics
NetFlow Jflow AppFlow
sFlow
IPFIX
CSV
Metadata
Deferred Data
Get The Network Data
Support Today – Enable Tomorrow
JSON
Software Networking / SS1201 / Aug 2024 / © 2024 IBM Corporation
Streaming Metrics
Public Cloud SD-WAN
HTTP
Self-Service Data Extraction
APIs
Kafka
IPSLA
XML
250+ Vendors
For Your Network Today
10 Business Day SLA
Vendors Supported “Out of the box”
– Cisco
– Juniper
– Palo Alto
– F5
– Aruba
– Fortinet
– Arista
– Nokia
– Versa
– VMware
– EMC
– Motorola
– and more!
IBM SevOne
will certify new SNMP devices in your network
in 10 business days or less.
Software Networking / SS1201 / Aug 2024 / © 2024 IBM Corporation
Static Networks
Complicated, time-consuming manual processes
configuring vendor specific UI/APIs
Dynamic, On-Demand Networks
Across datacenter, wide-area networks
& hybrid multicloud
Plus, the Networks of Tomorrow
SD-WAN
SDN
Wifi
Multicloud
Software Networking / SS1201 / Aug 2024 / © 2024 IBM Corporation
Complete
Network Visibility
Machine Learning
Analytics
Advanced
Visualization
Automated
Actions
Insights
• Baselines, standard deviations,
• Top N, dynamic capacity analysis,
• Custom calculations, synthetic
indicators, static/dynamic thresholds,
• Maintenance windows, grouping &
alert policies
Best practices for continuous network performance
Step 2- ML-based advanced analytics
© 2022 IBM Corporation
Software Networking / SS1201 / Aug 2024 / © 2024 IBM Corporation
Network Metric Collection - 100%
Application Flow Collection - 100%
Next Gen Network Collection Ready- 100%
High Availability Monitoring
Insight via Baselining, Analytics & Alerting
Executive Reports and Troubleshooting Workflows
Automated Actions
Machine Learning-
based Baselines
Machine learning to
help you automatically
know what is NORMAL
and WHAT IS NOT.
Automatically calculates
baselines for EVERY
METRIC collected
Automatically calculates
baselines
for EVERY METRIC collected
Software Networking / SS1201 / Aug 2024 / © 2024 IBM Corporation
Alert Subscriptions
What Is It & Why Does
It Matter?
– Alert Subscriptions allow
users to automatically be
notified when thresholds are
violated. Alert subscriptions
are customizable.
– Users can quickly assess
device health by severity,
and immediately identify the
number and duration of
outages.
Use Case
With one click, users have
complete visibility into the
performance information
needed to quickly isolate,
assess, and resolve issues
before they impact your end-
users.
Software Networking / SS1201 / Aug 2024 / © 2024 IBM Corporation
Dynamic Alerting
Policy based thresholding
– Dynamic alerting policies to detect
anomalies like floods, DoS, failover
– Conditions and rulesets to ensure
actionable alerting
– Webhooks enable IBM SevOne
–
– alerts to enrich upstream AIOps
systems
– API enables IBM SevOne
–
– to act a trigger or feedback loop to
enable automated actions
Software Networking / SS1201 / Aug 2024 / © 2024 IBM Corporation
Capacity Planning
Automatically Project
Your Future Needs
Leverage your real-time
and historical data
patterns
Software Networking / SS1201 / Aug 2024 / © 2024 IBM Corporation
Top N Reporting
What Is It & Why Does
It Matter?
–Allows customers to sort data
by any given KPI.
–Allows customers to easily
set up dashboards & view
their infrastructure based on
what they care about most!
Use Case
An MSP used TopN to discover
10,000 under utilized ports, all
of which could be considered
for consolidation. The MSP
was able to properly reallocate
resources, and reduced
delivery time for customers.
Software Networking / SS1201 / Aug 2024 / © 2024 IBM Corporation
Programmatic Goal
Lines
What Is It &
Why Does It Matter?
–Administrators can now
enhance the performance
visibility across their
organization by using
metadata to automatically
define and adjust
performance goal lines.
–Enables teams to have
metadata such as Service
Level Agreements, that can
change over time, to be
automatically reflected in
their reporting and
workflows.
Software Networking / SS1201 / Aug 2024 / © 2024 IBM Corporation
Time and Count
Over Threshold
What Is It & Why Does
It Matter?
- Configure policies based on
the number of threshold
violations or the amount of
time thresholds have violated
over a timespan.
- Used to alert when KPIs
exceed threshold more/less
often with specific sensitivity
and reduce false positives
Use Case
Alert based on user defined
conditions. Alert when CPU
load on an app critical server is
consistently elevated over time
but do not trigger for a brief but
substantial spike in load that
would skew the average over
the evaluation timespan.
ALERT ON THIS
IGNORE THIS
Software Networking / SS1201 / Aug 2024 / © 2024 IBM Corporation
Slope Alerting
Automatically get alerted when
there are excessive increases
or decreases in traffic.
Some increases are normal –
But excessive increases are
not.
Excessive
increase in
traffic
Software Networking / SS1201 / Aug 2024 / © 2024 IBM Corporation
Excessive
increase in
traffic
Synthetic
Indicators
What Is It & Why Does
It Matter?
- Allows users to create brand
new KPIs that don’t exist on
devices by default.
- Users don’t have to settle on
the “default” KPIs on
hardware. New ones can be
created!
Use Case
–KPIs such as Percent Usage,
Percent Loss, Percent Error,
& Percent Idle can be created
through Synthetic Indicators
when they don’t exist by
default.
–Synthetic Indicators could be
used to monitor & compare
ratios of items such as,
connections succeeded vs.
connections failed, packets
sent, vs. errors received
Software Networking / SS1201 / Aug 2024 / © 2024 IBM Corporation
Custom
Calculations
What Is It & Why Does
It Matter?
–Allows users to combine
multiple metrics from
different data sources, in
order to generate a
completely new, business
relevant metric.
Use Case
–Customers leverage Custom
Calculations to determine the
total amount of traffic going
over an interface. They do
this by combining the
inbound & outbound traffic
together.
Software Networking / SS1201 / Aug 2024 / © 2024 IBM Corporation
Maintenance
Windows
What Is It & Why Does
It Matter?
–Allows users to temporarily
filter out predictable changes
in network activity.
–Used in order to avoid
changes to the baselining
and/or alerting systems.
Use Case
Generally used during
preventative maintenance
periods but can be created at
any time. Some customers
utilize Maintenance Windows
during anticipated events that
will generate sudden &
temporary traffic changes
(such as a sports game).
Software Networking / SS1201 / Aug 2024 / © 2024 IBM Corporation
Grouping
What Is It & Why Does
It Matter?
–Process of combining data
sets together to provide some
type of value.
–Grouping allows users to
organize their data in a very
simplistic & easy-to-
understand way.
Use Case
Users can group by geographic
location, by manufacturer,
naming convention, etc.
A customer could monitor the
Total Network Volume across
their network by grouping their
entire network together and
creating a report to show Total
Network Volume.
Software Networking / SS1201 / Aug 2024 / © 2024 IBM Corporation
Complete
Network Visibility
Machine Learning
Analytics
Advanced
Visualization
Automated
Actions
Executive Reports &
Troubleshooting Workflows
• Day one reporting,
• Troubleshooting workflows,
• Live Maps, heat maps, geo-topology &
custom backgrounds,
• Multi-tenant ready, & more
Best practices for continuous network performance
Step 3 – Executive reports and troubleshooting workflows
Software Networking / SS1201 / Aug 2024 / © 2024 IBM Corporation
Network Metric Collection - 100%
Application Flow Collection - 100%
Next Gen Network Collection Ready- 100%
High Availability Monitoring
Insight via Baselining, Analytics & Alerting
Executive Reports and Troubleshooting Workflows
Automated Actions
Powerful Reporting
and Analysis
Out of the box, day one
reporting, with a series
of auto-populating
reports for common
network performance
reporting needs.
- Easily edit and extend any of
the out-of-the-box reports or
create new reports from
scratch - in both dark and
light mode.
- Then reuse them for different
regions/offices, saving hours
of report building, while
enabling consistent insights
across multi-site operations
teams.
- Embed operational expertise
reducing the learning curve
with curated reporting and
workflows
Software Networking / SS1201 / Aug 2024 / © 2024 IBM Corporation
Troubleshooting
Workflows
What Is It & Why Does
It Matter?
Users can easily create
customizable visualizations
and workflows that can be
shared by any consumer across
an organization, from line of
business owners to engineers
and operations teams.
Use Case
– SevOne users can deliver the
right insight to the right
person, at the right time.
– Users do not need to send
outdated reports, and instead
share live data, allowing for
more accurate decision
making.
Software Networking / SS1201 / Aug 2024 / © 2024 IBM Corporation
Instant Graphs What is it & Why
Does It Matter?
Instant Graphs workspace
for ad-hoc multivariant
analysis
• Flexibly select large sets
of resources.
• Pivot the resources
across multiple charts
for easier visual analysis.
Use Case
Speed up Exploration &
Investigation
• Find the data you need for
your investigation using Data
Insight’s expanded resource
capabilities.
Efficient & Effective Visual
Analysis
• Split or combine data
indicators on graphs.
• Change the layout on screen
to review data correlations.
Quickly tell a Story
• Using the new Stash feature
build your exploration /
investigation story.
25
Software Networking / SS1201 / Aug 2024 / © 2024 IBM Corporation
Stashing Widgets What is it & Why Does It
Matter?
Stash provides the ability to
copy visualizations from reports
and Instant Graphs into a
staging area.
Use Case
Expanded Availability
• Now available in reporting as
well as Instant Graphs.
• Available to use on existing
reports and new reports.
Quick Visual Analysis
• Build your exploration /
investigation story by adding
visualizations to a new or
existing report.
26
Software Networking / SS1201 / Aug 2024 / © 2024 IBM Corporation
Take visualizations with you
Build your story
Add devices
• Add new devices directly from Data Insight.
Import bulk devices
• Import devices in bulk using SNMP version
specific CSVs.
Edit devices
• Adjust polling settings, change descriptions,
and pin devices to specific device groups.
Plug
• Plugins can be configured in full directly from
Data Insight:
• SNMP
• ICMP
• WMI
Device Manager
Software Networking / SS1201 / Aug 2024 / © 2024 IBM Corporation
LiveMaps
What Is It & Why Does
It Matter?
- Easily create a single-source
reporting map for physical
and logical infrastructure.
- Leverage network topology
for every device, and device
group, with built-in
dimensions offering greater
visibility into metrics and
alerting.
Use Case
This visualization tool helps
users quickly see status across
large, complicated networks
enabling them to respond to
network issues before they
become critical
Software Networking / SS1201 / Aug 2024 / © 2024 IBM Corporation
LiveMaps
Leveraging
Topology
LiveMaps is a powerful way
IBM SevOne clients summarize
network performance. Easily
pivot from a geographic view of
your network to a topological
showing connectivity details.
Take it further and embed your
maps into the reporting to
create powerful workflows to
troubleshoot and understand
where to act faster.
Software Networking / SS1201 / Aug 2024 / © 2024 IBM Corporation
App-Centric
Network Analysis
via Flow
Better understand your
application traffic running on
your network.
Available today:
− BGP routing ASN details
− Country of Origin
− Enhanced Application ID for
IPFIX
− NBAR Resolution
Software Networking / SS1201 / Aug 2024 / © 2024 IBM Corporation
Custom
Backgrounds
What Is It & Why Does
It Matter?
–Users can customize
LiveMaps backgrounds with
business specific images for
custom contextual insights.
Use Case
Visualize network status based
on custom images such as floor
plans, server rooms, etc.
Software Networking / SS1201 / Aug 2024 / © 2024 IBM Corporation
Team Dashboards
What Is It & Why Does it
Matter?
–Administrators can now
organize users into teams
and share a standard set of
reports for use by all the
members of the team
–IBM SevOne administrators
have finer control over the
user experience of larger
organizations, aligning their
operational approach across
the business while speeding
the time to value for new
members of each team.
Team A
Team B
Software Networking / SS1201 / Aug 2024 / © 2024 IBM Corporation
Multi-Tenant Ready
What Is It & Why Does
It Matter?
–Enable visual consistency and
common starting points
across tenants with tenant-
specific home page reports
and UI options such as logos,
background colors, and
foreground colors for data
insight menus and
dashboards.
Use Case
MSP on-boarding and
enterprise operations teams
can create an unlimited
number of themes for
tenants/users to choose from,
customizing the look and feel
of their IBM SevOne
instance.
Software Networking / SS1201 / Aug 2024 / © 2024 IBM Corporation
Complete
Network Visibility
Machine Learning
Analytics
Advanced
Visualization
Automated
Actions
Automated Actions
• Automate tasks and process through from
1000+drag and drop low-code building
blocks.
• Day one automation workflow templates to
turn insights into actions for closed loop
automation.
• Secure API abstraction, webhooks and
streaming metrics to accelerate IT system
integration
Best practices for continuous network performance
Step 4 –Extended value with automated actions
Software Networking / SS1201 / Aug 2024 / © 2024 IBM Corporation
Network Metric Collection - 100%
Application Flow Collection - 100%
Next Gen Network Collection Ready- 100%
High Availability Monitoring
Insight via Baselining, Analytics & Alerting
Executive Reports and Troubleshooting Workflows
Automated Actions
Software Networking SS1201 / Aug 2024 / © 2024 IBM Corporation
35
Actions via API
Retrieve data
Push data
3rd Party
Data
IT System
Mgmt. Apps
Network
Devices
Client Environment
Observe
Alert
trigger
Push
data
Cloud
Resources
Building Blocks
Leverage 1000s of pre-built building blocks for interacting with network devices,
cloud resources, applications, ITSMs, 3rd party data and more.
Edit them and/or create your own building blocks
Assemble building blocks to create automation workflows
Automation Workflows
Leverage a series of curated workflow templates from IBM TechXchange
Edit them and/or stitch your own workflows using building blocks.
Trade-up comes with license to use/create 10 workflows
Applications
Extended Value with Automated Actions
Collaborate
Visualize Unify
Enrich Store
Extract
IBM SevOne NPM
Stream
Webhooks
APIs
3rd Party Data
2
Reduce repetitive tasks
through automation
Extended value
with automated
actions
Software Networking SS1201 / Aug 2024 / © 2024 IBM Corporation
1
Automate network actions
based on ML observations
3
Leverage self-service API-
based data extraction
36
Extended value with
automated actions
Example curated workflow templates:
Software Networking SS1201 / Aug 2024 / © 2024 IBM Corporation
Automatically:
1.Modify active, actionable QoS policies
2.Automate the configuration of NetFlow on Network
device
3.Utilize SevOne APIs for predictive alerting
4.Run additional analytics, including starting high
frequency polling
5.Create ServiceNow tickets with enriched IBM SevOne
data
37
1
Automate network actions based on ML
observations
• Turn insights into actions for closed loop
automation
• Automatically configure, provision, manage and
test network devices, and more.
Software Networking SS1201 / Aug 2024 / © 2024 IBM Corporation
38
Automate network actions based on ML observations
Example: Automate config scripts without scripting knowledge
Problem
• Configuring QoS perfectly at the first chance is almost
impossible, as there will be always some tweaking
required.
• In complex networks with thousands of interfaces and
QoS configurations, detecting where QoS could be
optimized is very difficult task.
• In this use-case there is one class that is having lots of
packet drops.
• On the IBM SevOne
•
• dashboards there is a clear correlation of the QoS
bytes maxing out and packet loss.
QoS Section
QoS Drops
1
Software Networking SS1201 / Aug 2024 / © 2024 IBM Corporation
39
Solution
• Use IBM SevOne
•
• to analyze all captured data and understand normal behaviour and
detect QoS misconfigurations.
• Using automated workflows we will be able to reconfigure all the
misconfigurations automatically in a consistent way.
• As seen in the image, when the traffic is lower, the amount of packet
loss reduces. Indicating that more bandwidth will reduce packet loss.
• In order to detect this type of issue automatically, a policy is created
to trigger an alert when there are consistent QoS drops on important
QoS classes.
• A workflow is triggered using a webhook on the alert with the device
details provided as input.
• The workflow goes back to the device and QoS class, gets the normal
(CurrentBW) QoS traffic out and increases it by 10% (NewBW).
• All the packets that were previously dropped now is sent without the
intervention of a person.
Automate network actions based on ML observations
Example: Automate config scripts without scripting knowledge
Updated bandwidth
Triggered alert
Correlation
Triggered alert
Correlation
Drops in network traffic correlated to drop in packet loss. Alert is for continuous
packet loss.
1
Software Networking SS1201 / Aug 2024 / © 2024 IBM Corporation
40
Benefit
• Extend automation across your network using the pre-build building
blocks and leveraging pre-built workflow templates or build your own
automation.
• Reduce downtime by proactively adding closed loop automation to you
network powered by ML observations.
• Incorporate third party platforms such as ITSM software or simple email
communication to keep track of automated changes in your network.
• Low-code workflows with advanced API abstraction allows for easy
adaption to your specific network and faster time to closed loop
automation.
Automate network actions based on ML observations
Example: Automate config scripts without scripting knowledge
No drops after change
Higher traffic going out than usual
Once implemented, no packet loss even with increased traffic
1
Want to see a demonstration of automated network
actions? Click here to view a video of this use-case.
Extended value with
automated actions
Example curated workflow templates:
Software Networking SS1201 / Aug 2024 / © 2024 IBM Corporation
Automatically:
1. De-duplicate and update SevOne alerts to ServiceNow
2. Import device metadata into IBM SevOne such as geo-
coordinates
3. Synchronize IBM SevOne inventory with ServiceNow
4. Update SNMP community strings on devices
5. Check Devices Not Monitored Correctly in IBM SevOne
41
2
Reduce repetitive tasks through
automation
• Seamless importing of device metadata
and geo coordinates, and more.
• Get a head start on building your own
automation workflows using 1000s of
building blocks .
Software Networking 2024 / s101 / Aug 2024 / © 2024 IBM Corporation
42
Automate repetitive tasks
Example: Pre-built workflow to import geo coordinate data into IBM SevOne
Problem
• Existing edge devices within IBM SevOne
•
• does not have latitude and longitude metadata associated with it.
• Although these two deceives are located in the US they display in
Africa on the map.
• You have this metadata stored in an Excel spreadsheet, CSV file or
CMDB.
• Manually copying the data from the spreadsheet is time-consuming
and error prone.
• The coordinates provided are somewhat inaccurate and can be
improved.
• We do have the Zip code available for exact location in the data file.
2
Software Networking SS1201 / Aug 2024 / © 2024 IBM Corporation
43
Solution
• In this case we have our metadata in a Excel spreadsheet.
• Out-of-the box integration with Excel and IBM SevOne APIs allow for easy
workflow creation with drag and drop actions with low-code building
blocks.
• The workflow loops through the devices in the spreadsheet.
• It takes the ZIP code and makes an API call to a third party for more
precise location.
• The workflow updates the device metadata via the IBM SevOne API.
• Simple logic in the process can determine if the device exist in IBM
SevOne and possibly update your file by deleting it if it doesn’t exist.
Fetch and loop through all the devices
Metadata added and visible in the SevOne UI after import
Many pre-build abstracted APIs ready
for drag and drop use in your workflows
Automate repetitive tasks
Example: Pre-built workflow to import geo coordinate data into IBM SevOne
2
Software Networking SS1201 / Aug 2024 / © 2024 IBM Corporation
44
Benefit
• Out-of-the box integration with IBM SevOne, Excel and other well
known platforms allows speed to value.
• No detailed scripts required.
• Due to easy low-code integration, a third party services can be used
to enrich the data – in this case significantly improve location
accuracy.
• Initiate processes with input data from IBM SevOne and enrich the
data at any point in the process.
• Push and pull data to any of your platforms at any point in the
workflow.
• Automate you repetitive tasks enabling your team to focus on higher-
value initiatives.
Automate repetitive tasks
Example: Pre-built workflow to import geo coordinate data into IBM SevOne
Updated map view of the devices in IBM SevOne with accurate locations
2
Want to see a demo of how to streamline operations by
reducing repetitive tasks? View a video on this use-case.
Extended value with
automated actions
Example curated workflow templates:
Software Networking SS1201 / Aug 2024 / © 2024 IBM Corporation
Collect data from:
1.Monitoring a container in SevOne – Openshift
2.IBM Cloud workloads
3.KPIs From SevOne Data Insight
4.Non-standard devices using IBM SevOne deferred data
API
45
3
Leverage self-service API-based data
extraction
• Self-service data import using the IBM
SevOne universal collection framework.
• Start collecting data from Kubernetes-
based systems, IBM Cloud, and more, or
build your own workflows.
Note: Using a dedicated single node on-prem server, up to
200 indicators per second was ingested using a self-
service API-based data extraction workflow.
Software Networking SS1201 / Aug 2024 / © 2024 IBM Corporation
46
Automate with self-service data extraction
Example: Pre-built workflow template for collecting IBM Cloud data
Problem
• IBM SevOne (as-of-yet) does not support monitoring IBM Cloud
out of the box.
• IBM SevOne can still monitor technologies like IBM Cloud using
the IBM SevOne universal collection framework.
• This typically requires a professional services engagement to
build scripts to capture and ingest the data.
• This might be a timely, complex and expensive activity
depending on the data being extracted.
3
Software Networking SS1201 / Aug 2024 / © 2024 IBM Corporation
47
Solution
• Using the drag and drop functionality construct a workflow to
automate the collection and import of the data.
• Using the built-in API actions for IBM SevOne and custom REST API
blocks for IBM cloud, data can be collected and ingested securely.
• Provide each block with the required API information and credentials
and build the logic and process. No need to write complex scripts.
• Easily incorporate logic into flows such as branching flows if a device
exist and looping through devices.
• Use built-in action blocks to format the collected data and provide it
back to the IBM SevOne in a consumable format via the API.
• Re-use workflows as elements in your workflow (Sub-flows) and
further increase efficiency by reusing previously created flows.
• Set workflow to run as often as you require to fetch information.
Main workflow
OOTB SevOne API
Actions
Sub-flow
Perform logic
actions based on
data received
Abstracted Search device API – Configure
and use the SevOne API without writing
any code
Automate with self-service data extraction
Example: Pre-built workflow template for collecting IBM Cloud data
3
Note: Using a dedicated single node on-prem server, up to 200 indicators per second was extracted and
imported into IBM SevOne using a self-service API-based data extraction workflow.
Software Networking SS1201 / Aug 2024 / © 2024 IBM Corporation
48
Automate with self-service data extraction
Example: Pre-built workflow template for collecting IBM Cloud data
3
Defining which metrics and units to be captured
Software Networking SS1201 / Aug 2024 / © 2024 IBM Corporation
49
Benefit
• Low-code platform allows for quickly monitoring new technologies.
• Extend powerful network performance management to any of your
technologies, future proofing your monitoring.
• Reduce dependency on skilled expensive resources with abstracted APIs
in a drag and drop UI.
• Format data to meet the need of any of your applications.
• Quick turnaround for any required changes in data collection and
ingesting.
Areas monitored for IBM cloud in SevOne NPM using the workflow
Standard SevOne NPM functionally becomes available for IBM Cloud such as
correlating all the information together or filter metrics for comparisons
Automate with self-service data extraction
Example: Pre-built workflow template for collecting IBM Cloud data
3
Want to see a demo of how to automate with self-service
data extraction? You can find a demonstration of this use-
case here.
Visualize 3rd party data sources alongside
network performance data in the same dashboard
3rd party data
sources
Widget Dev Kit
Collaborate
Visualize Unify
Enrich Store
Extract
IBM SevOne NPM
Stream
Webhooks
APIs
3rd Party Data
Splunk
ELK
Simple Unification
of Data
Software Networking / SS1201 / Aug 2024 / © 2024 IBM Corporation
Stream Network Performance Data to Your 3rd Party
Business Intelligence Systems
Kafka 3rd Party Business
Intelligence Systems
Collaborate
Visualize Unify
Enrich Store
Extract
IBM SevOne NPM
Stream
Webhooks
APIs
3rd Party Data
Simple Unification
of Data
Software Networking / SS1201 / Aug 2024 / © 2024 IBM Corporation
IBM SevOne
Leveraging flow analytics
for application centricity
Our journey to application centricity
4
6.1/6.2
− Application Bandwidth Alerts
− NBAR Table Updates
6.4
− ASN Network Enrichment
− Country Enrichment
− Metric to Flow
Improvements
6.6
− SaaS Application Enrichment
− Application Categories
− Flow to Metric Workflows
− Application Views
6.3
− Service Profile Enrichment
6.5
− Application ID & Resolution
You are here!
6.7
− Application Report Variables
− SaaS Application Enrichment -
IPv6 support
− Flow to Metric Chain
Enhancement
Software Networking / SS1201 / Aug 2024 / © 2024 IBM Corporation
7.0
− Kubernetes monitoring via eBPF
− Visibility into k8s network traffic
− Instant visibility in to flows between
− Pod, Namespace, Node
− IP, Port, Protocol
− ‘One Click’ deploy via RedHat
Marketplace available
− Per conversation RTT/latency
How does NetFlow work?
Supported by market leading vendors:
• Cisco
• Versa
• Juniper
• Alcatel-Lucent
• Arista
• Citrix NetScaler
• VMware ESX
54
Observe traffic behavior from the network
Visualize network flow traffic as it enters or exits
an interface revealing traffic patterns and
country of origin.
Analyze the data and determine the cause of
congestion or bandwidth utilization per
application.
Software Networking / SS1201 / Aug 2024 / © 2024 IBM Corporation
App-Aware Flow
Analytics at-a-Glance
Support for the broadest set of
technologies
• Cisco, Juniper, Alcatel-
Lucent, Citrix, VMware and
many others.
• Support for NetFlow v5 v9,
v10, IPFIX, cFlow, jFlow,
sFlow and AppFlow OOTB
• SDWAN vendor field and
resolution support
Deep visibility without external
probes
• Cisco NBAR and AVC
• IPFIX Variable Length Fields
• Flow metadata via Option
Templates and Enterprise
Fields
• Template ID lookups to
provide human readable
results
App-Aware NPM
• Automatic SaaS application
identification
• Define your own
applications to enrich
internal network traffic
• Application grouping to
assess network capacity for
budgeting and more.
• Country/ASN point of origin
enrichment and flags
Application Centric Workflows
• Query and report on popular
applications
• Troubleshoot performance
issues using Metric to Flow
and Flow to Metric
workflows.
• Drill down to understand
infrastructure dependencies
• Identify bandwidth hogs
using application bandwidth
alerts
Fast, distributed flow reporting
• High speed Flow database
to provide faster report
performance
• Clustered architecture that
can scale with your
infrastructure growth
• Easy to use UI
• OOTB application centric
views and dashboards
Real-time edge analytics on
flow data
• Create policies and
thresholds on flow data
• Display real-time alerts on
top of Status Maps
• Integrate alerts with other
systems via Traps or
WebHooks
55
Software Networking / SS1201 / Aug 2024 / © 2024 IBM Corporation
Flow analytics and
application-first
workflows
1. Application, Port, Bandwidth and
Response Time Visibility
2. Identify application impacting
behaviors and events
3. Gain insights into infrastructure
use and cut down your
troubleshooting time
4. Query and drill down from flow to
understand infrastructure
dependencies
5. Use flexible application
grouping i.e., collaboration tools),
easily assess network capacity
for budgeting purposes and
more.
Software Networking / SS1201 / Aug 2024 / © 2024 IBM Corporation
Application
Context
Drill down to understand
infrastructure dependencies using
flexible application grouping (i.e.,
collaboration tools) to quickly
assess bandwidth, alerts, network
capacity for budgeting purposes and
more.
Software Networking / SS1201 / Aug 2024 / © 2024 IBM Corporation
Flow to Metric Drill
Down
Start with the network flow data and
view the supporting infrastructure
with a single click.
NetFlow Analytics – Business Benefits
Packet analytics without
probes
Visibility into application and
infrastructure behaviors
without the cost of dedicated
traffic probe solutions
Application traffic
awareness
Gain deeper understanding of
traffic patterns, application
usage and types of service.
Automatic SaaS application
identification and grouping
Plan capacity with
confidence
Understand bandwidth use
down to protocols and
conversations to better target
capacity increases and
infrastructure optimization
Operational Insights
into your applications
Turn your deeper
understanding of your
infrastructure into actionable
Operational Insights with real-
time analytics.
58
Software Networking / SS1201 / Aug 2024 / © 2024 IBM Corporation
NetFlow Analytics – SevOne Unique Advantages
Flow Analytics with
Speed at Scale
Cluster Architecture and fast
raw data store allows you to
monitor thousands of
interfaces and report in
seconds.
Broad Visibility for
Operations and the
Business
Support for most NetFlow
formats out of the box to
provide unmatched visibility
Actionable Insights to
the Business and your
Users
Real-time analytics to help you
determine behaviors in your
application infrastructure and
categories
Operational Simplicity
and Efficiency
Deploys simply, integrates
deeply. SevOne’s unique
Metric-to-Flow, Flow-to-Metric
and Metric-to-Log workflows
allow you to cut
troubleshooting time in half.
59
Software Networking / SS1201 / Aug 2024 / © 2024 IBM Corporation
Global
Manufacturing and
Mining – EMEA
The Situation We offer an IP Exchange service and had no visibility into
customer traffic, the tools we had made it a very painful
process to get the data out so we could copy it to Excel.
Because of this, reports took forever and weren’t customer
friendly or accurate.
The Solution Deploy IBM SevOne for Flow and Metrics analytics
• Analyze and visualize flows from dedicated and shared
interfaces
• Monitor infrastructure end to end
• Automatically provide customers with easy-to-
understand reports
The Outcome Our customers know exactly what their traffic consumption
is and for what services. They trust our reports which has
reduced the number of incidents where our customers
challenged their bill based on their perception.
60
Software Networking / SS1201 / Aug 2024 / © 2024 IBM Corporation
Tier 1 Service
Provider – EMEA
The Situation As a global organization we have over 400 sites connected
via a variety of providers, while our application
infrastructure is centralized, our users are not. We had a
variety of tools that we used to manage capacity but had
limited visibility into traffic and application use to better
optimize our infrastructure.
The Solution Deploy IBM SevOne for Flow and Metrics analytics
• Analyze and visualize flows from WAN interfaces
• Monitor infrastructure end to end
• Use the reports to better plan capacity and improve
customer experience
The Outcome Our IT and Engineering departments now have up to the
minute visibility into bandwidth, traffic and application use
over WAN links, we can now properly forecast capacity,
match application use to QoS configurations and ensure our
WAN providers comply with their SLAs.
61
Software Networking / SS1201 / Aug 2024 / © 2024 IBM Corporation
Top University –
Americas
The Situation We offer a series of applications to our students and faculty
members, from internal communications to content sharing
to telepresence in order to give our users the tools they
need to excel. We had no visibility into application use so
when problems occurred, we spent too much time finger
pointing leading to long resolution times
The Solution Deploy IBM SevOne for Flow and Metrics analytics
• Analyze and visualize flows towards and from the
datacenter and application servers
• Combine with other metrics to understand
infrastructure utilization
• Report on application use to determine normal
behaviors and proactively resolve issues
The Outcome Now we can see our infrastructure from a single screen and
understand application and infrastructure utilization. This
has led to an average reduction in MTTR of over 50%
62
Software Networking / SS1201 / Aug 2024 / © 2024 IBM Corporation
IBM SevOne
Hybrid cloud
observability
Why SevOne for hybrid cloud
monitoring?
64
Tool consolidation
Address disjointed alerting that
arises from using myriad of
different tools or your hybrid
cloud network
End to end visualization
Visualize end to end network
performance across different
underlying technologies.
Reduce silos
Reduce silos across different
teams and gain holistic insights
Faster troubleshooting
Reduce mean time to resolution
with insight across your on-prem
and cloud-based infrastructure
Software Networking / SS1201 / Aug 2024 / © 2024 IBM Corporation
Use Cases
Multi and
Hybrid Cloud Monitoring
• Track availability and performance
across different cloud platforms.
• Do a comparison to see where your
applications perform the best.
Track your
migration status
• Executive reporting to show
aggregated traffic on-prem vs
Azure or AWS
• Make better, data driven
decisions.
Right size your
environment based
on usage:
• IBM SevOne allows you to find
out underutilized resources that a
user may be paying for at a full
cost.
• With these insights users can
make better decisions on which
VM/Instance size they should be
using
65
Software Networking / SS1201 / Aug 2024 / © 2024 IBM Corporation
Our approach to
monitoring cloud is
different and better
66
Using IBM SevOne to
monitor AWS CloudWatch
you will reduce the costs
incurred by recurring API
calls to CloudWatch to get
overtime metrics. This
results in up to 70% lower
cost compared to other
approaches of data
collection.
IBM SevOne integration
with Azure uses the newly
introduced Data Plane API
that has an improved query
limit allowing clients to
collect large data sets in a
cost effective and scalable
way.
IBM SevOne enriches the
metrics collected with
metadata from API polls,
so you can do things like
filter on an account or
region and see every
resource across different
resources.
No plugins required, No
hassle of an external
collector to ingest data to
your platform. The
plugins are built into the
NMS and configuration and
onboarding is easy
Software Networking / SS1201 / Aug 2024 / © 2024 IBM Corporation
Reduce Cost
Data
Enrichment
Easy to get
started
Troubleshooting with hybrid cloud monitoring
67
67
Alerting across your different
platforms notify you that there
is a Transit Gateway drop in
traffic between us-east1 and
us-east2
Automation tools ingesting
webhook alerts from SevOne
NPM can use this prompt to
redirect traffic through a different
region causing a seamless
handover and no user experience
degradation for the app user.
Appropriate teams, in this case,
the Cloud team gets notified.
Automated ITSM tool
integrations can create AWS
tickets if necessary.
Note: Saved Network
Engineering Resource time
Once alert clears, workflows can be
created to route traffic back to the
region or can be done manually
Monitor both your cloud and on-
prem environments
• Save time of your valuable network or
cloud engineering resources by
engaging the right teams when you
have an issue.
• Consolidate on multiple monitoring
tools spend.
• Create workflows that focus on auto
remediation and proactive monitoring
holistically across your whole
infrastructure.
Software Networking / SS1201 / Aug 2024 / © 2024 IBM Corporation
Complete visibility across hybrid multicloud networks
Software Networking / SS1201 / Aug 2024 / © 2024 IBM Corporation
A closer look at monitoring AWS
69
Unleash the power of monitoring
your AWS deployment
Fast time to insight
Out of the box reports
Customize and share reports
Gain visibility you entire AWS
infrastructure
Advanced analytics
AWS-based data treated like
any other metric
ML-based baselines, policy-
based alerting, capacity
forecasting, etc.
Store as collected data for one
year
Support hybrid multicloud
Collect, analyze and visualize on-
prem networks, AWS and Azure
cloud deployments in a single
system.
Turn insights into actions
Automate actions based on
ML-based observations
Reduce repetitive tasks
Leverage self-service API-
based data ingestion
Software Networking / SS1201 / Aug 2024 / © 2024 IBM Corporation
How can you get a holistic view
of your entire infrastructure?
– Users now have a way to monitor performance in
their on-prem networks and monitor performance
of different parts of public clouds.
– As you migrate workloads to the cloud, you get
powerful reporting capability to understand
various aspects of the environment:
– How is your migration is going?
– What percentage of workloads have been
migrated?
– How is your application performance ‘on-
prem’ vs in the public cloud.
71
Extended
Visibility
Software Networking / SS1201 / Aug 2024 / © 2024 IBM Corporation
72
Architecture for monitoring AWS
AWS Cloudwatch feeds
metrics streams to S3
S3 Buckets store metric
streams for different
Cloudwatch namespaces
with lifecycle policies
SQS Queue notifies SevOne
of new metrics available in
metric streams
SevOne pulls new metrics
from S3 Buckets
Metadata gets populated
by API polling to different
AWS components
Software Networking / SS1201 / Aug 2024 / © 2024 IBM Corporation
Onboarding Process SevOne provides two options of onboarding:
– Automated process with a Terraform template that spins up AWS
resources required for the integration to work.
– Manual process of configuration using the AWS console.
Step 1 – Setup AWS Roles
Creating roles in AWS for our Terraform template to use. This can be done
using the AWS console or can be done with the provided Terraform
template.
Step 2 – Create AWS Infrastructure
Creating the Infrastructure needed in AWS by running the terraform
template from the NMS.
Step 3 -(Use NMS UX to integrate with AWS)
Use the onboarding UX to select the AWS Regions you would like to
monitor for any specific Account ID.
That’s it! With this ~9 Minute process, you have completed the AWS
integration
The Terraform template provided does the following:
– Creates metric streams from different CloudWatch Namespaces.
– Creates S3 Buckets that will store the metric streams with appropriate
lifecycle policies.
– Creates a SQS queue that will notify the plugin of new metric
availability.
73
Software Networking / SS1201 / Aug 2024 / © 2024 IBM Corporation
AWS Services
Monitored today
+
Software Networking / SS1201 / Aug 2024 / © 2024 IBM Corporation
Monitor AWS cloud
resources
EC2 instances
EC2, or Elastic Compute Cloud, is an
AWS web service that provides
resizable compute capacity in the
cloud. EC2 is a fundamental
building block of AWS and allows
users to efficiently and cost-
effectively run their applications and
workloads in the cloud.
S3 buckets
Amazon S3, or Simple Storage
Service, is an object storage service
offered by AWS that provides highly
scalable and secure storage for a
wide range of data types and use
cases.
Transit Gateways
AWS Transit Gateway is a fully
managed service that enables
customers to connect their Amazon
Virtual Private Clouds (VPCs) and
on-premises networks to a single
gateway.
Direct Connect
AWS Direct Connect is a network
service that provides dedicated and
private connectivity between a
customer’s on-premises
infrastructure and AWS.
NAT Gateways
A network address translation (NAT)
gateway is a highly available,
managed AWS service that enables
resources in a private subnet to
access the internet or other AWS
services but prevents inbound
traffic from the internet.
AWS Site-to-Site VPNs
Site-to-site VPNs in AWS are used
to establish secure connections
between on-premises networks and
VPCs in the AWS cloud. Gain
insights on how your site-to-site
VPNs in AWS are performing.
75
Elastic Block Store
Elastic Block Store (EBS) is a block
storage offered by AWS for use with
EC2 instances. Get metrics like
burst balance, read/write Ops and
volume queue length to monitor the
performance of block storage.
Network Load Balancers
Network Load Balancers (NLB) are a
type of load balancing service that
can distribute incoming traffic to
multiple targets like EC2 instances,
lambda functions, containers and
more within a VPC. Granular metrics
like active flow count broken down
by packet type and packets per
second give deep insights into load
balancing service performance.
– Read the solution
brief: Hybrid
Cloud Monitoring
with SevOne NPM
Software Networking / SS1201 / Aug 2024 / © 2024 IBM Corporation
Use Case - Visualize on-prem and AWS infrastructure in a single Report
Software Networking / SS1201 / Aug 2024 / © 2024 IBM Corporation
More Use Cases 1
Capacity Planning on Direct
Connects, Transit Gateway
attachments, and VPN Tunnels
2
Analyze Performance
Bottlenecks of Applications by
drilling into several different
AWS Resources monitored.
3
Visualize your Cloud Migration
Status with Reports showing
Legacy Transport and Direct
Connects/Transit Gateways
4
Track SLAs provided by AWS
for different services from a
vendor agnostic tool
5
Make better decisions on where
to host specific infrastructure. For
example, infrastructure that
needs autoscaling can be on
AWS, however Infrastructure that
has a lot of cross region traffic
can be on-prem to optimize cost
6
Application Dependency
mapping. Use the VPC filtering
option to visualize All instances
performing a specific task as a
part of an application.
77
Software Networking / SS1201 / Aug 2024 / © 2024 IBM Corporation
A closer look at monitoring Azure
78
Unleash the power of monitoring
your Azure deployment
Fast time to insight
Out of the box reports
Customize and share reports
Gain visibility you entire Azure
infrastructure
Advanced analytics
Azure-based data treated like
any other metric
ML-based baselines, policy-
based alerting, capacity
forecasting, etc.
Store as collected data for one
year
Support hybrid multicloud
Collect, analyze and visualize on-
prem networks, AWS and Azure
cloud deployments in a single
system.
Turn insights into actions
Automate actions based on
ML-based observations
Reduce repetitive tasks
Leverage self-service
API-based data ingestion
Software Networking / SS1201 / Aug 2024 / © 2024 IBM Corporation
The IBM SevOne Advantage
80
Traditional REST API Data Plane API
IBM SevOne uses
Improved query throughput and efficiency
Reduced risk of throttling
Metric collection at scale
Requires an API call per resource (Inefficient)
Users experience throttling (data gaps)
50x more efficient
Lower costs to monitor Azure using Data Plane API vs REST API
Software Networking / SS1201 / Aug 2024 / © 2024 IBM Corporation
Monitor Azure cloud
resources with IBM
SevOne
Azure Virtual Machines
Azure Virtual Machines are cloud-based
virtualized computing resources offered
by Microsoft Azure, allowing users to run
and manage various operating systems,
customize performance, and scale as
needed for a wide range of applications
and workloads.
Virtual Machine Scale Sets
Virtual Machine Scale Sets in Azure
are a group of identical VMs that
automatically scale to meet high
availability and load-balancing
requirements for applications and
services.
81
Software Networking / SS1201 / Aug 2024 / © 2024 IBM Corporation
Azure Load Balancers
Azure Load Balancer distributes
incoming traffic across your backend
servers to improve performance and
application uptime.
Azure ExpressRoute
Azure ExpressRoute connects your on-
prem infrastructure to your Azure
Cloud environment. ExpressRoute
services supported include ExpressRo
ute Circuit and ExpressRoute Direct.
Azure VPN Gateways
Azure virtual network gateways act as
secure connectors between your Azure
virtual network and on-premises locations
or other virtual networks.
Azure Storage Accounts
Azure Storage is a cloud storage
platform that offers a variety of
services for storing and accessing
data in Microsoft's cloud.
Automated device onboarding
Automatically discovers new
resources in your environment
and adds them to the NMS for
monitoring
Device group creation
Device groups are created for
every resource type so that
users can get started with
reporting quickly.
Out of the box reports
OOTB Reports for different
resources takes you from
integration to insights in
minutes.
Metadata enrichment
We collect several different
fields from the Azure Portal
that add context to your
Resources.
82
Support from
IBM SevOne
Software Networking / SS1201 / Aug 2024 / © 2024 IBM Corporation
Azure Reports
Read the solution
brief:
Hybrid Cloud
Monitoring with
IBM SevOne
Software Networking / SS1201 / Aug 2024 / © 2024 IBM Corporation
IBM SevOne
Packaging &
Architecture
IBM SevOne
Automated Network Observability
IBM SevOne NPM
IBM SevOne offerings
Two main packages
IBM SevOne Automated Network Observability (SANO)
• A bundle of
• IBM SevOne Network Performance Mgmt (NPM)
• IBM Rapid Network Automation (RNA)
• Licensed by device
• Includes all features described in this deck
• Includes 10 workflows of IBM Rapid Network
Automation
• Additional Rapid Network Automation (RNA)
workflows are available using RNA per workflow
SKUs
IBM SevOne NPM
• Licensed by device
• Includes all features described in this deck,
except features enabled by IBM Rapid
Network Automation:
• automated actions
• low-code/no-code automation engine
• workflow building blocks and
• self-service API-based data ingestion
Existing IBM SevOne NPM customers can
trade-up to IBM SevOne Automated Network
Observability
85
Software Networking / SS1201 / Aug 2024 / © 2024 IBM Corporation
IBM SevOne
Architecture
IBM SevOne Automated
Network Observability
(IBM SevOne NPM +Rapid Network Automation)
SevOne NPM
Architecture
The main servers involved in a
SevOne NPM deployment:
NMS - Central component of SevOne NPM
Collects data, stored data in the database,
generates alerts, etc.
HSA - Brings HA to the NMS server
DNC - NMS server dedicated to monitor flow
data
Data Insight - Reporting, dashboards and
workflow
Special collectors - Some technologies require
stand alone servers that will collect data from
those specific technologies
Software Networking / SS1201 / Aug 2024 / © 2024 IBM Corporation
NMS - Introduction
The NMS is a self-contained software
appliance that performs
• Collection of data (except some plugins)
• Alerting
• Reporting through SURF
• Database
The IBM SevOne platform could work
with a single NMS (cluster master)
If we require better reporting, resiliency or some
specific solutions, we might need more NMSs or
other servers (such as DI)
We can add “unlimited” peers to the
cluster master, allowing us to expand the
IBM SevOne platform
Software Networking / SS1201 / Aug 2024 / © 2024 IBM Corporation
DNC – Dedicated
NetFlow Collector
The Dedicated NetFlow
Collector (DNC) server is
similar to the NMS server, but it
can only collect NetFlow data,
whereas the NMS can collect
metrics from other protocols
(SNMP, ICMP, etc) as well as
NetFlow.
On deployments where
NetFlow data is a heavy
component required, it is
recommended deploying
dedicated DNC servers for
NetFlow data.
Nulla eu mattis elit, efficitur
scelerisque velit. Vestibulum
viverra, ante ac placerat.
Lorem ipsum dolor sit amet,
consectetur adipiscing elit. Sed
at sem erat. Vivamus a pulvinar
sapien. Orci varius natoque pen
et magnis dis parturi montes,
nasce ridiculus mus nonamus
totalis ellimatus est.
Software Networking / SS1201 / Aug 2024 / © 2024 IBM Corporation
NMS - Resiliency
• SevOne offers resiliency at the NMS level using
HSA servers
• HSA servers are NMS servers with the role of HSA
(“same” image, different role)
• Each NMS needs to be paired with an HSA server
to become a cluster
• An HSA can be paired only with a single NMS
• If we want to add resiliency to three NMS servers,
we need three HSA servers, each of them paired
to one NMS server
• Replication between servers occur in real time
and the failover time takes a few seconds
• NMS and DNC servers can have HSA servers
paired to them
Stream
Primary Appliance (PAS) Standby Appliance (HSA)
Config
Database
Data
Database
Real-time Replication
Config
Database
Data
Database
Config Database from
Cluster Master
Software Networking / SS1201 / Aug 2024 / © 2024 IBM Corporation
NMS & DNC
Models and Capacity Model Objects Max Indicators /sec
Specs
(for virtual machine)
vPAS5k 5,000 333 CPU: 2 cores
RAM: 8GB
Disk: 150GB
vPAS20k 20,000 1,333 CPU: 8 cores
RAM: 24GB
Disk: 600GB
vPAS60k 60,000 4,000 CPU: 8 cores
RAM: 44GB
Disk: 150GB and 1.3TB
vPAS100k 100,000 6,666 CPU: 8 cores
RAM: 96GB
Disk: 500GB and 2TB
vPAS200k 200,000 13,333 CPU: 16 cores
RAML 220GB
Disk: 600GB and 4TB
Model Flow Interfaces Max Flows/ sec
Specs
(for virtual machine)
vDNC100 100 30,000 CPU: 8 cores
RAM: 16GB
Disk: 150GB and 400GB
vDNC300 300 80,000 CPU: 16 cores
RAM: 48GB
Disk: 150GB and 800GB
vDNC1000 1000 80,000 CPU: 24 cores
RAM: 96GB
Disk: 150GB and 1.5TB
vDNC1500 1500 80,000 CPU: 24 cores
RAM: 128GB
Disk: 150GB and 3.0TB
When
collecting
metrics
When
collecting
flows
Software Networking / SS1201 / Aug 2024 / © 2024 IBM Corporation
NMS - Processes
While several processes
run on the NMS, these
are the main ones.
1
Apache Web Server
Apache2 is the web server for
SevOne and provides access to
the SevOne GUI and API
2
MYSQL Database
With two main databases
(config and data) stores the
configuration and polled data
3
Netflow Collector
“SevOne netflowd” is used to
receive NetFlow data from
network devices
4
Scheduler
“SevOne polld” is our standard
polling daemon and is used
when polling devices at a
frequency of greater than 60
seconds
5
Trap Collector
“SevOne trapd” is the process
used to receive traps in to
SevOne. Small to medium
businesses may use SevOne as
a simple FMS tool
6
continued next slide
92
Software Networking / SS1201 / Aug 2024 / © 2024 IBM Corporation
NMS – Processes continued
Name Process Runs On… Process Information
Apache2 Web Server /usr/sbin/apache2 Master+Slave Apache2 is the web server for SevOne and provides access to the SevOne GUI and API
MySQL Config Database /usr/bin/mysqld Master+Slave SevOne uses MySQL as its datastore for both configuration data and polled data. This is the MySQL process supporting our configuration database. This contains device details,
SevOne settings etc.
MySQL Data Database /usr/bin/mysqld Master+Slave SevOne uses MySQL as its datastore for both configuration data and polled data. This is the MySQL process supporting our data database. This contains polled data
SSH Daemon /usr/sbin/sshd Master+Slave SSHd is the Secure Shell daemon and is used for administrative access to the SevOne system
Syslog /usr/sbin/syslog-ng Master+Slave Syslog-NG is the logging daemon that processes logs from the various processes within the system. It ca also be used to forward logs to another host if required
sFlow Converter /usr/local/bin/sflowtool Master+Slave (Optional Process, Licensed) sFlow Converter is an optional process used for converting sFlow data to Netflow. This process is used when SevOne is used as a sFlow receiver
Traffic Samplicator /usr/local/bin/samplicate Master (Optional Process, Licensed) Samplicator is an optional process used for redirecting netflow traffic from one port to another
SevOne Backfill Daemon /usr/local/bin/SevOne-backfilld Master (Optional Process, Licensed) xStats is SevOnes technology that allows us to take data from any source and insert it in to SevOne. The backfill process is used to insert data into
SevOne that is >2 hours old
SevOne Call Daemon /usr/local/bin/SevOne-calld Master (Optional Process, Licensed) SevOne calld is a process used for receiving CMR, CDR and call quality records from Cisco CallManager and Avaya PBX systems. This is used for
SevOnes telephony feature
SevOne Data Daemon /usr/local/bin/SevOne-datad Master SevOne datad is the data extraction handing process that receives data from all other system processes and processes it before sending to the memory buffer
SevOne Master/Slave Monitor /usr/local/bin/SevOne-
masterslaved
Master+Slave SevOne masterslaved is the process that handles which appliance becomes master and which becomes slave. It also handles failover and heartbeat checking between the
appliances
SevOne Message Aggregator /usr/local/bin/messageswitch Master Messageswitch is for passing alert messages between peers in the cluster. If a policy or threshold alert is triggered on a peer then it is sent to the cluster master via
messageswitch for further processing
SevOne MIB Daemon /usr/local/bin/SevOne-mibd Master+Slave SevOne mibd is a process that syncronises mibs between the database and the filesystem for use within SevOne (e.g. for polling etc)
SevOne NetFlow Collector /usr/local/bin/SevOne-netflowd Master (Optional Process, Licensed) SevOne netflowd is used to receive netflow data from network devices. This data is then visible within the FlowFalcon reporting feature within
SevOne
SevOne Realtime Scheduler /usr/local/bin/SevOne-highpolld Master SevOne highpolld is our high frequency polling daemon and is used when polling devices at a frequency of less than 60 seconds. This process supports all plugins (e.g. not just
SNMP polling)
SevOne Request Daemon /usr/local/bin/SevOne-requestd Master+Slave SevOne requestd is a key process which is used for communications between all cluster members. It is used to communicate status, data, graphs etc between peers within the
SevOne cluster
SevOne Scheduler /usr/local/bin/SevOne-polld Master SevOne polld is our standard polling daemon and is used when polling devices at a frequency of greater than 60 seconds. This process supports all plugins (e.g. not just SNMP
polling)
SevOne Stats /usr/local/bin/SevOne-statsd Master+Slave SevOne statsd publishes system statistics via SNMP. These statistics can be viewed via the selfmon system in the GUI
SevOne Trap Collector /usr/local/bin/SevOne-trapd Master SevOne trapd is the process used to RECEIVE traps in to SevOne. Small to medium businesses may use SevOne as a simple FMS tool
SevOne xStats Backfill Insertion
Daemon
/usr/local/bin/SevOne-insert-
backfilld
Master (Optional Process, Licensed) xStats is SevOnes technology that allows us to take data from any source and insert it in to SevOne. The backfill process is used to insert data into
SevOne that is >2 hours old
SevOne xStats Dispatch
Daemon
/usr/local/bin/SevOne-dispatchd Master (Optional Process, Licensed) xStats is SevOnes technology that allows us to take data from any source and insert it in to SevOne. The dispatch process ………??
SevOne xStats File Collector /usr/local/bin/SevOne-fcad Master (Optional Process, Licensed) xStats is SevOnes technology that allows us to take data from any source and insert it in to SevOne. The file collector process moves files between
the xStats processing folders
SevOne Insertion Daemon /usr/local/bin/SevOne-insertd Master (Optional Process, Licensed) xStats is SevOnes technology that allows us to take data from any source and insert it in to SevOne. The insertion daemon is used to insert data into
SevOne that is <2 hours old
SevOne Search Daemon /usr/local/bin/SevOne-searchd Master+Slave SevOne searchd is a process that indexes the data within the system for faster lookups
Software Networking / SS1201 / Aug 2024 / © 2024 IBM Corporation
WMI Proxy
In order to monitor WMI data
from Windows servers, it is
required to install one or more
WMI proxy servers on Windows
machines
The WMI proxy installed on
those Windows machines will
be the ones querying WMI data
to the targeted Windows
servers, and send the data
back to the NMS server
There is no HA option for the
WMI proxy
Software Networking / SS1201 / Aug 2024 / © 2024 IBM Corporation
Collectors
SevOne offers specific
solutions for technologies such
as Wifi, SDWAN and SDN.
These solutions require a
special type of collector
installed in a dedicated server.
The requirements for each
solution depends on the
solution itself and the version
of the software.
Several workers (servers) can
be added to the solution to
expand the capacity, i.e.,
monitor more devices.
* There are no HA options for
these collectors (updated July
2021)
Software Networking / SS1201 / Aug 2024 / © 2024 IBM Corporation
Data Insight (DI)
DI is the reporting tool for the NMS. Without this
server, the NMS has very little reporting capabilities.
It gets all the data from the NMS (from the cluster
master) using fast API calls (SOA).
There is no HA option for DI, only multiple workers
managed by the master DI.
• Multiple instances can be deployed pointing to the
same NMS cluster. It requires configuring all DI
settings twice as there is no connection between
DI instances.
For bigger deployments, it is possible to deploy
workers (servers) to increase the performance of the
tool when several users are connected and running
reports.
Software Networking / SS1201 / Aug 2024 / © 2024 IBM Corporation
Data Insight (DI) -
Architecture
A DI Cluster can be composed of one or more DI
servers in a Master-Worker node relationship.
If a DI cluster is configured with multiple servers, the
master node handles the initial incoming nginx (web
server) requests and then randomly sends the
requests to the other DI appliances for load
balancing.
Each node will use a container management system
(Kubernetes) to manage each internal pod.
Software Networking / SS1201 / Aug 2024 / © 2024 IBM Corporation
Data Insight (DI) -
Processes
Main components:
GraphQL - query language used to
get data from the NMS using SOA
(aka DIRA) API
MySQL - database used to store DI
configuration (roles, reports, links,
etc)
NGINX - web server
All nodes on a cluster will have the
GraphQL and NGINX pods, but only
one will have the MySQL database
(randomly assigned)
Software Networking / SS1201 / Aug 2024 / © 2024 IBM Corporation
IBM Rapid Network Automation Architecture
The new automation features in SevOne Automated Network Observability
are delivered by IBM Rapid Network Automation. Rapid Network Automation
is separate software from IBM SevOne. Downloaded separately, Rapid
Network Automation also has its own deployment requirements.
Rapid Network Automation is an advanced API-driven orchestration platform
that automates, integrates, and connects across the network and business.
Using a low-code approach and transforming API code into deployment-
ready action blocks, it facilitates, integrates, and secures communication up
and down the technology stack between platforms, services, and
applications.
The automation platform is a containerized microservices application that
runs on top of a Kubernetes platform. The exact platform varies depending on
the needs of the deployment. It supports running on a single-node
Kubernetes K3s cluster, a three-node cluster running K3s. Kubernetes
provides the container management layer that enables scaling and availability
of the microservices.
Regardless of the underlying Kubernetes flavor, the instance uses the same
installation scripts and configuration files for deployment and upgrade.
Software Networking / SS1201 / Aug 2024 / © 2024 IBM Corporation
100
IBM Rapid Network Automation– Platform overview
Management UI Plugin Extension UI Third-party Apps UI Webhooks Inbound
User Interface – UI is deployed in its own separate container, easily customizable and upgradable
REST API – Fully Open API-Compliant REST API is easily consumed by UI and client services
Configuration
management
Authentication Provider Workflow Scheduler Events Gateway
Core System
Message Bus – Easily allows the platform to scale both horizontally and vertically
Execution System – Full role-based access control (RBAC) on a per action block basis, enables
secure execution of API commands
Workflow engine
Cloud Ticketing & ITSM Controller
Infrastructure Telemetry & Analysis Test & Measurement
Integrations – Integration generate workflow building blocks using low-code interface
to simplify API programming for automation and execution
Software Networking / SS1201 / Aug 2024 / © 2024 IBM Corporation
101
Actions via API
Retrieve data
Push data
3rd Party
Data
IT System
Mgmt. Apps
Network
Devices
Client Environment
Observe
Alert
trigger
Push
data
Cloud
Resources
Building Blocks
Leverage 1000s of pre-built building blocks for interacting with network devices,
cloud resources, applications, ITSMs, 3rd party data and more.
Edit them and/or create your own building blocks
Assemble building blocks to create automation workflows
Automation Workflows
Leverage a series of curated workflow templates from IBM TechXchange
Edit them and/or stitch your own workflows using building blocks.
Trade-up comes with license to use/create 10 workflows
Applications
How does Rapid Network Automation work with SevOne NPM?
Collaborate
Visualize Unify
Enrich Store
Extract
IBM SevOne NPM
Stream
Webhooks
APIs
3rd Party Data
IBM
Rapid
Network
Automation
Software Networking / SS1201 / Aug 2024 / © 2024 IBM Corporation
IBM SevOne for network and systems monitoring

IBM SevOne for network and systems monitoring

  • 1.
  • 2.
    Contents Best practices Networkvisibility ML analytics Visualization Automated actions Leveraging flow analytics How it works Use cases Hybrid cloud How it works Use ases Packaging & architecture IBM SevOne packaging IBM NPM architecture IBM RNA architecture Integration of NPM + RNA 2 Software Networking / SS1201 / Aug 2024 / © 2024 IBM Corporation
  • 3.
    IBM SevOne Best practicesfor continuous network performance
  • 4.
    FULL VISIBILITY |ANY NETWORK | ANY SCALE MPLS WAN SD-WAN Wi-Fi Campus Branch SDN Hybrid Multi-Cloud Datacenter 4G/5G Tower To Core CSP & MSP Networks Monitoring & Troubleshooting SLA Management Compliance Capacity & Service Planning Tools Consolidation Application Flow Data Polled Metrics Network Operations & Engineering Security Operations Service Management Incident Management Compliance Management Alerting, ITSM, AIOps & Log Unification Non-Standard Data Answer any question about your network and act intelligently by turning insights into automated actions Automated, application-centric network observability Complete Network Visibility Advanced Visualization Automated Actions Streamed Metrics Closed Loop Automation Self-Service API-based Data Ingestion Machine Learning Analytics IBM SevOne® Software Networking / S1101 / June 2024 / © 2024 IBM Corporation
  • 5.
    Complete Network Visibility Machine Learning Analytics Advanced Visualization Automated Actions CompleteNetwork Visibility • 250+ vendors metrics & flow, multi- Domain • 10 Day SLA new SNMP device • Hybrid multicloud, SD-WAN, SDN, Wi- Fi, next gen branch 5G • Self-service API-based data extraction • One year as polled retention Best practices for continuous network performance Step 1 – Complete network visibility © 2022 IBM Corporation Software Networking / April SS1201 / Aug 2024 / © 2024 Software Networking / SS1201 / Aug 2024 / © 2024 IBM Corporation Network Metric Collection - 100% Application Flow Collection - 100% Next Gen Network Collection Ready- 100% High Availability Monitoring Insight via Baselining, Analytics & Alerting Executive Reports and Troubleshooting Workflows Automated Actions
  • 6.
    Public Cloud CampusNetworks Software-Defined WAN + Datacenters 4G/5G Mobile Networks Branch Networks Enterprise Wi-Fi HTTP APIs Application Flow Data Non-Standard Data DNS Windows WMI ICMP SNMP Polled Metrics NetFlow Jflow AppFlow sFlow IPFIX CSV Metadata Deferred Data Get The Network Data Support Today – Enable Tomorrow JSON Software Networking / SS1201 / Aug 2024 / © 2024 IBM Corporation Streaming Metrics Public Cloud SD-WAN HTTP Self-Service Data Extraction APIs Kafka IPSLA XML
  • 7.
    250+ Vendors For YourNetwork Today 10 Business Day SLA Vendors Supported “Out of the box” – Cisco – Juniper – Palo Alto – F5 – Aruba – Fortinet – Arista – Nokia – Versa – VMware – EMC – Motorola – and more! IBM SevOne will certify new SNMP devices in your network in 10 business days or less. Software Networking / SS1201 / Aug 2024 / © 2024 IBM Corporation
  • 8.
    Static Networks Complicated, time-consumingmanual processes configuring vendor specific UI/APIs Dynamic, On-Demand Networks Across datacenter, wide-area networks & hybrid multicloud Plus, the Networks of Tomorrow SD-WAN SDN Wifi Multicloud Software Networking / SS1201 / Aug 2024 / © 2024 IBM Corporation
  • 9.
    Complete Network Visibility Machine Learning Analytics Advanced Visualization Automated Actions Insights •Baselines, standard deviations, • Top N, dynamic capacity analysis, • Custom calculations, synthetic indicators, static/dynamic thresholds, • Maintenance windows, grouping & alert policies Best practices for continuous network performance Step 2- ML-based advanced analytics © 2022 IBM Corporation Software Networking / SS1201 / Aug 2024 / © 2024 IBM Corporation Network Metric Collection - 100% Application Flow Collection - 100% Next Gen Network Collection Ready- 100% High Availability Monitoring Insight via Baselining, Analytics & Alerting Executive Reports and Troubleshooting Workflows Automated Actions
  • 10.
    Machine Learning- based Baselines Machinelearning to help you automatically know what is NORMAL and WHAT IS NOT. Automatically calculates baselines for EVERY METRIC collected Automatically calculates baselines for EVERY METRIC collected Software Networking / SS1201 / Aug 2024 / © 2024 IBM Corporation
  • 11.
    Alert Subscriptions What IsIt & Why Does It Matter? – Alert Subscriptions allow users to automatically be notified when thresholds are violated. Alert subscriptions are customizable. – Users can quickly assess device health by severity, and immediately identify the number and duration of outages. Use Case With one click, users have complete visibility into the performance information needed to quickly isolate, assess, and resolve issues before they impact your end- users. Software Networking / SS1201 / Aug 2024 / © 2024 IBM Corporation
  • 12.
    Dynamic Alerting Policy basedthresholding – Dynamic alerting policies to detect anomalies like floods, DoS, failover – Conditions and rulesets to ensure actionable alerting – Webhooks enable IBM SevOne – – alerts to enrich upstream AIOps systems – API enables IBM SevOne – – to act a trigger or feedback loop to enable automated actions Software Networking / SS1201 / Aug 2024 / © 2024 IBM Corporation
  • 13.
    Capacity Planning Automatically Project YourFuture Needs Leverage your real-time and historical data patterns Software Networking / SS1201 / Aug 2024 / © 2024 IBM Corporation
  • 14.
    Top N Reporting WhatIs It & Why Does It Matter? –Allows customers to sort data by any given KPI. –Allows customers to easily set up dashboards & view their infrastructure based on what they care about most! Use Case An MSP used TopN to discover 10,000 under utilized ports, all of which could be considered for consolidation. The MSP was able to properly reallocate resources, and reduced delivery time for customers. Software Networking / SS1201 / Aug 2024 / © 2024 IBM Corporation
  • 15.
    Programmatic Goal Lines What IsIt & Why Does It Matter? –Administrators can now enhance the performance visibility across their organization by using metadata to automatically define and adjust performance goal lines. –Enables teams to have metadata such as Service Level Agreements, that can change over time, to be automatically reflected in their reporting and workflows. Software Networking / SS1201 / Aug 2024 / © 2024 IBM Corporation
  • 16.
    Time and Count OverThreshold What Is It & Why Does It Matter? - Configure policies based on the number of threshold violations or the amount of time thresholds have violated over a timespan. - Used to alert when KPIs exceed threshold more/less often with specific sensitivity and reduce false positives Use Case Alert based on user defined conditions. Alert when CPU load on an app critical server is consistently elevated over time but do not trigger for a brief but substantial spike in load that would skew the average over the evaluation timespan. ALERT ON THIS IGNORE THIS Software Networking / SS1201 / Aug 2024 / © 2024 IBM Corporation
  • 17.
    Slope Alerting Automatically getalerted when there are excessive increases or decreases in traffic. Some increases are normal – But excessive increases are not. Excessive increase in traffic Software Networking / SS1201 / Aug 2024 / © 2024 IBM Corporation Excessive increase in traffic
  • 18.
    Synthetic Indicators What Is It& Why Does It Matter? - Allows users to create brand new KPIs that don’t exist on devices by default. - Users don’t have to settle on the “default” KPIs on hardware. New ones can be created! Use Case –KPIs such as Percent Usage, Percent Loss, Percent Error, & Percent Idle can be created through Synthetic Indicators when they don’t exist by default. –Synthetic Indicators could be used to monitor & compare ratios of items such as, connections succeeded vs. connections failed, packets sent, vs. errors received Software Networking / SS1201 / Aug 2024 / © 2024 IBM Corporation
  • 19.
    Custom Calculations What Is It& Why Does It Matter? –Allows users to combine multiple metrics from different data sources, in order to generate a completely new, business relevant metric. Use Case –Customers leverage Custom Calculations to determine the total amount of traffic going over an interface. They do this by combining the inbound & outbound traffic together. Software Networking / SS1201 / Aug 2024 / © 2024 IBM Corporation
  • 20.
    Maintenance Windows What Is It& Why Does It Matter? –Allows users to temporarily filter out predictable changes in network activity. –Used in order to avoid changes to the baselining and/or alerting systems. Use Case Generally used during preventative maintenance periods but can be created at any time. Some customers utilize Maintenance Windows during anticipated events that will generate sudden & temporary traffic changes (such as a sports game). Software Networking / SS1201 / Aug 2024 / © 2024 IBM Corporation
  • 21.
    Grouping What Is It& Why Does It Matter? –Process of combining data sets together to provide some type of value. –Grouping allows users to organize their data in a very simplistic & easy-to- understand way. Use Case Users can group by geographic location, by manufacturer, naming convention, etc. A customer could monitor the Total Network Volume across their network by grouping their entire network together and creating a report to show Total Network Volume. Software Networking / SS1201 / Aug 2024 / © 2024 IBM Corporation
  • 22.
    Complete Network Visibility Machine Learning Analytics Advanced Visualization Automated Actions ExecutiveReports & Troubleshooting Workflows • Day one reporting, • Troubleshooting workflows, • Live Maps, heat maps, geo-topology & custom backgrounds, • Multi-tenant ready, & more Best practices for continuous network performance Step 3 – Executive reports and troubleshooting workflows Software Networking / SS1201 / Aug 2024 / © 2024 IBM Corporation Network Metric Collection - 100% Application Flow Collection - 100% Next Gen Network Collection Ready- 100% High Availability Monitoring Insight via Baselining, Analytics & Alerting Executive Reports and Troubleshooting Workflows Automated Actions
  • 23.
    Powerful Reporting and Analysis Outof the box, day one reporting, with a series of auto-populating reports for common network performance reporting needs. - Easily edit and extend any of the out-of-the-box reports or create new reports from scratch - in both dark and light mode. - Then reuse them for different regions/offices, saving hours of report building, while enabling consistent insights across multi-site operations teams. - Embed operational expertise reducing the learning curve with curated reporting and workflows Software Networking / SS1201 / Aug 2024 / © 2024 IBM Corporation
  • 24.
    Troubleshooting Workflows What Is It& Why Does It Matter? Users can easily create customizable visualizations and workflows that can be shared by any consumer across an organization, from line of business owners to engineers and operations teams. Use Case – SevOne users can deliver the right insight to the right person, at the right time. – Users do not need to send outdated reports, and instead share live data, allowing for more accurate decision making. Software Networking / SS1201 / Aug 2024 / © 2024 IBM Corporation
  • 25.
    Instant Graphs Whatis it & Why Does It Matter? Instant Graphs workspace for ad-hoc multivariant analysis • Flexibly select large sets of resources. • Pivot the resources across multiple charts for easier visual analysis. Use Case Speed up Exploration & Investigation • Find the data you need for your investigation using Data Insight’s expanded resource capabilities. Efficient & Effective Visual Analysis • Split or combine data indicators on graphs. • Change the layout on screen to review data correlations. Quickly tell a Story • Using the new Stash feature build your exploration / investigation story. 25 Software Networking / SS1201 / Aug 2024 / © 2024 IBM Corporation
  • 26.
    Stashing Widgets Whatis it & Why Does It Matter? Stash provides the ability to copy visualizations from reports and Instant Graphs into a staging area. Use Case Expanded Availability • Now available in reporting as well as Instant Graphs. • Available to use on existing reports and new reports. Quick Visual Analysis • Build your exploration / investigation story by adding visualizations to a new or existing report. 26 Software Networking / SS1201 / Aug 2024 / © 2024 IBM Corporation Take visualizations with you Build your story
  • 27.
    Add devices • Addnew devices directly from Data Insight. Import bulk devices • Import devices in bulk using SNMP version specific CSVs. Edit devices • Adjust polling settings, change descriptions, and pin devices to specific device groups. Plug • Plugins can be configured in full directly from Data Insight: • SNMP • ICMP • WMI Device Manager Software Networking / SS1201 / Aug 2024 / © 2024 IBM Corporation
  • 28.
    LiveMaps What Is It& Why Does It Matter? - Easily create a single-source reporting map for physical and logical infrastructure. - Leverage network topology for every device, and device group, with built-in dimensions offering greater visibility into metrics and alerting. Use Case This visualization tool helps users quickly see status across large, complicated networks enabling them to respond to network issues before they become critical Software Networking / SS1201 / Aug 2024 / © 2024 IBM Corporation
  • 29.
    LiveMaps Leveraging Topology LiveMaps is apowerful way IBM SevOne clients summarize network performance. Easily pivot from a geographic view of your network to a topological showing connectivity details. Take it further and embed your maps into the reporting to create powerful workflows to troubleshoot and understand where to act faster. Software Networking / SS1201 / Aug 2024 / © 2024 IBM Corporation
  • 30.
    App-Centric Network Analysis via Flow Betterunderstand your application traffic running on your network. Available today: − BGP routing ASN details − Country of Origin − Enhanced Application ID for IPFIX − NBAR Resolution Software Networking / SS1201 / Aug 2024 / © 2024 IBM Corporation
  • 31.
    Custom Backgrounds What Is It& Why Does It Matter? –Users can customize LiveMaps backgrounds with business specific images for custom contextual insights. Use Case Visualize network status based on custom images such as floor plans, server rooms, etc. Software Networking / SS1201 / Aug 2024 / © 2024 IBM Corporation
  • 32.
    Team Dashboards What IsIt & Why Does it Matter? –Administrators can now organize users into teams and share a standard set of reports for use by all the members of the team –IBM SevOne administrators have finer control over the user experience of larger organizations, aligning their operational approach across the business while speeding the time to value for new members of each team. Team A Team B Software Networking / SS1201 / Aug 2024 / © 2024 IBM Corporation
  • 33.
    Multi-Tenant Ready What IsIt & Why Does It Matter? –Enable visual consistency and common starting points across tenants with tenant- specific home page reports and UI options such as logos, background colors, and foreground colors for data insight menus and dashboards. Use Case MSP on-boarding and enterprise operations teams can create an unlimited number of themes for tenants/users to choose from, customizing the look and feel of their IBM SevOne instance. Software Networking / SS1201 / Aug 2024 / © 2024 IBM Corporation
  • 34.
    Complete Network Visibility Machine Learning Analytics Advanced Visualization Automated Actions AutomatedActions • Automate tasks and process through from 1000+drag and drop low-code building blocks. • Day one automation workflow templates to turn insights into actions for closed loop automation. • Secure API abstraction, webhooks and streaming metrics to accelerate IT system integration Best practices for continuous network performance Step 4 –Extended value with automated actions Software Networking / SS1201 / Aug 2024 / © 2024 IBM Corporation Network Metric Collection - 100% Application Flow Collection - 100% Next Gen Network Collection Ready- 100% High Availability Monitoring Insight via Baselining, Analytics & Alerting Executive Reports and Troubleshooting Workflows Automated Actions
  • 35.
    Software Networking SS1201/ Aug 2024 / © 2024 IBM Corporation 35 Actions via API Retrieve data Push data 3rd Party Data IT System Mgmt. Apps Network Devices Client Environment Observe Alert trigger Push data Cloud Resources Building Blocks Leverage 1000s of pre-built building blocks for interacting with network devices, cloud resources, applications, ITSMs, 3rd party data and more. Edit them and/or create your own building blocks Assemble building blocks to create automation workflows Automation Workflows Leverage a series of curated workflow templates from IBM TechXchange Edit them and/or stitch your own workflows using building blocks. Trade-up comes with license to use/create 10 workflows Applications Extended Value with Automated Actions Collaborate Visualize Unify Enrich Store Extract IBM SevOne NPM Stream Webhooks APIs 3rd Party Data
  • 36.
    2 Reduce repetitive tasks throughautomation Extended value with automated actions Software Networking SS1201 / Aug 2024 / © 2024 IBM Corporation 1 Automate network actions based on ML observations 3 Leverage self-service API- based data extraction 36
  • 37.
    Extended value with automatedactions Example curated workflow templates: Software Networking SS1201 / Aug 2024 / © 2024 IBM Corporation Automatically: 1.Modify active, actionable QoS policies 2.Automate the configuration of NetFlow on Network device 3.Utilize SevOne APIs for predictive alerting 4.Run additional analytics, including starting high frequency polling 5.Create ServiceNow tickets with enriched IBM SevOne data 37 1 Automate network actions based on ML observations • Turn insights into actions for closed loop automation • Automatically configure, provision, manage and test network devices, and more.
  • 38.
    Software Networking SS1201/ Aug 2024 / © 2024 IBM Corporation 38 Automate network actions based on ML observations Example: Automate config scripts without scripting knowledge Problem • Configuring QoS perfectly at the first chance is almost impossible, as there will be always some tweaking required. • In complex networks with thousands of interfaces and QoS configurations, detecting where QoS could be optimized is very difficult task. • In this use-case there is one class that is having lots of packet drops. • On the IBM SevOne • • dashboards there is a clear correlation of the QoS bytes maxing out and packet loss. QoS Section QoS Drops 1
  • 39.
    Software Networking SS1201/ Aug 2024 / © 2024 IBM Corporation 39 Solution • Use IBM SevOne • • to analyze all captured data and understand normal behaviour and detect QoS misconfigurations. • Using automated workflows we will be able to reconfigure all the misconfigurations automatically in a consistent way. • As seen in the image, when the traffic is lower, the amount of packet loss reduces. Indicating that more bandwidth will reduce packet loss. • In order to detect this type of issue automatically, a policy is created to trigger an alert when there are consistent QoS drops on important QoS classes. • A workflow is triggered using a webhook on the alert with the device details provided as input. • The workflow goes back to the device and QoS class, gets the normal (CurrentBW) QoS traffic out and increases it by 10% (NewBW). • All the packets that were previously dropped now is sent without the intervention of a person. Automate network actions based on ML observations Example: Automate config scripts without scripting knowledge Updated bandwidth Triggered alert Correlation Triggered alert Correlation Drops in network traffic correlated to drop in packet loss. Alert is for continuous packet loss. 1
  • 40.
    Software Networking SS1201/ Aug 2024 / © 2024 IBM Corporation 40 Benefit • Extend automation across your network using the pre-build building blocks and leveraging pre-built workflow templates or build your own automation. • Reduce downtime by proactively adding closed loop automation to you network powered by ML observations. • Incorporate third party platforms such as ITSM software or simple email communication to keep track of automated changes in your network. • Low-code workflows with advanced API abstraction allows for easy adaption to your specific network and faster time to closed loop automation. Automate network actions based on ML observations Example: Automate config scripts without scripting knowledge No drops after change Higher traffic going out than usual Once implemented, no packet loss even with increased traffic 1 Want to see a demonstration of automated network actions? Click here to view a video of this use-case.
  • 41.
    Extended value with automatedactions Example curated workflow templates: Software Networking SS1201 / Aug 2024 / © 2024 IBM Corporation Automatically: 1. De-duplicate and update SevOne alerts to ServiceNow 2. Import device metadata into IBM SevOne such as geo- coordinates 3. Synchronize IBM SevOne inventory with ServiceNow 4. Update SNMP community strings on devices 5. Check Devices Not Monitored Correctly in IBM SevOne 41 2 Reduce repetitive tasks through automation • Seamless importing of device metadata and geo coordinates, and more. • Get a head start on building your own automation workflows using 1000s of building blocks .
  • 42.
    Software Networking 2024/ s101 / Aug 2024 / © 2024 IBM Corporation 42 Automate repetitive tasks Example: Pre-built workflow to import geo coordinate data into IBM SevOne Problem • Existing edge devices within IBM SevOne • • does not have latitude and longitude metadata associated with it. • Although these two deceives are located in the US they display in Africa on the map. • You have this metadata stored in an Excel spreadsheet, CSV file or CMDB. • Manually copying the data from the spreadsheet is time-consuming and error prone. • The coordinates provided are somewhat inaccurate and can be improved. • We do have the Zip code available for exact location in the data file. 2
  • 43.
    Software Networking SS1201/ Aug 2024 / © 2024 IBM Corporation 43 Solution • In this case we have our metadata in a Excel spreadsheet. • Out-of-the box integration with Excel and IBM SevOne APIs allow for easy workflow creation with drag and drop actions with low-code building blocks. • The workflow loops through the devices in the spreadsheet. • It takes the ZIP code and makes an API call to a third party for more precise location. • The workflow updates the device metadata via the IBM SevOne API. • Simple logic in the process can determine if the device exist in IBM SevOne and possibly update your file by deleting it if it doesn’t exist. Fetch and loop through all the devices Metadata added and visible in the SevOne UI after import Many pre-build abstracted APIs ready for drag and drop use in your workflows Automate repetitive tasks Example: Pre-built workflow to import geo coordinate data into IBM SevOne 2
  • 44.
    Software Networking SS1201/ Aug 2024 / © 2024 IBM Corporation 44 Benefit • Out-of-the box integration with IBM SevOne, Excel and other well known platforms allows speed to value. • No detailed scripts required. • Due to easy low-code integration, a third party services can be used to enrich the data – in this case significantly improve location accuracy. • Initiate processes with input data from IBM SevOne and enrich the data at any point in the process. • Push and pull data to any of your platforms at any point in the workflow. • Automate you repetitive tasks enabling your team to focus on higher- value initiatives. Automate repetitive tasks Example: Pre-built workflow to import geo coordinate data into IBM SevOne Updated map view of the devices in IBM SevOne with accurate locations 2 Want to see a demo of how to streamline operations by reducing repetitive tasks? View a video on this use-case.
  • 45.
    Extended value with automatedactions Example curated workflow templates: Software Networking SS1201 / Aug 2024 / © 2024 IBM Corporation Collect data from: 1.Monitoring a container in SevOne – Openshift 2.IBM Cloud workloads 3.KPIs From SevOne Data Insight 4.Non-standard devices using IBM SevOne deferred data API 45 3 Leverage self-service API-based data extraction • Self-service data import using the IBM SevOne universal collection framework. • Start collecting data from Kubernetes- based systems, IBM Cloud, and more, or build your own workflows. Note: Using a dedicated single node on-prem server, up to 200 indicators per second was ingested using a self- service API-based data extraction workflow.
  • 46.
    Software Networking SS1201/ Aug 2024 / © 2024 IBM Corporation 46 Automate with self-service data extraction Example: Pre-built workflow template for collecting IBM Cloud data Problem • IBM SevOne (as-of-yet) does not support monitoring IBM Cloud out of the box. • IBM SevOne can still monitor technologies like IBM Cloud using the IBM SevOne universal collection framework. • This typically requires a professional services engagement to build scripts to capture and ingest the data. • This might be a timely, complex and expensive activity depending on the data being extracted. 3
  • 47.
    Software Networking SS1201/ Aug 2024 / © 2024 IBM Corporation 47 Solution • Using the drag and drop functionality construct a workflow to automate the collection and import of the data. • Using the built-in API actions for IBM SevOne and custom REST API blocks for IBM cloud, data can be collected and ingested securely. • Provide each block with the required API information and credentials and build the logic and process. No need to write complex scripts. • Easily incorporate logic into flows such as branching flows if a device exist and looping through devices. • Use built-in action blocks to format the collected data and provide it back to the IBM SevOne in a consumable format via the API. • Re-use workflows as elements in your workflow (Sub-flows) and further increase efficiency by reusing previously created flows. • Set workflow to run as often as you require to fetch information. Main workflow OOTB SevOne API Actions Sub-flow Perform logic actions based on data received Abstracted Search device API – Configure and use the SevOne API without writing any code Automate with self-service data extraction Example: Pre-built workflow template for collecting IBM Cloud data 3 Note: Using a dedicated single node on-prem server, up to 200 indicators per second was extracted and imported into IBM SevOne using a self-service API-based data extraction workflow.
  • 48.
    Software Networking SS1201/ Aug 2024 / © 2024 IBM Corporation 48 Automate with self-service data extraction Example: Pre-built workflow template for collecting IBM Cloud data 3 Defining which metrics and units to be captured
  • 49.
    Software Networking SS1201/ Aug 2024 / © 2024 IBM Corporation 49 Benefit • Low-code platform allows for quickly monitoring new technologies. • Extend powerful network performance management to any of your technologies, future proofing your monitoring. • Reduce dependency on skilled expensive resources with abstracted APIs in a drag and drop UI. • Format data to meet the need of any of your applications. • Quick turnaround for any required changes in data collection and ingesting. Areas monitored for IBM cloud in SevOne NPM using the workflow Standard SevOne NPM functionally becomes available for IBM Cloud such as correlating all the information together or filter metrics for comparisons Automate with self-service data extraction Example: Pre-built workflow template for collecting IBM Cloud data 3 Want to see a demo of how to automate with self-service data extraction? You can find a demonstration of this use- case here.
  • 50.
    Visualize 3rd partydata sources alongside network performance data in the same dashboard 3rd party data sources Widget Dev Kit Collaborate Visualize Unify Enrich Store Extract IBM SevOne NPM Stream Webhooks APIs 3rd Party Data Splunk ELK Simple Unification of Data Software Networking / SS1201 / Aug 2024 / © 2024 IBM Corporation
  • 51.
    Stream Network PerformanceData to Your 3rd Party Business Intelligence Systems Kafka 3rd Party Business Intelligence Systems Collaborate Visualize Unify Enrich Store Extract IBM SevOne NPM Stream Webhooks APIs 3rd Party Data Simple Unification of Data Software Networking / SS1201 / Aug 2024 / © 2024 IBM Corporation
  • 52.
    IBM SevOne Leveraging flowanalytics for application centricity
  • 53.
    Our journey toapplication centricity 4 6.1/6.2 − Application Bandwidth Alerts − NBAR Table Updates 6.4 − ASN Network Enrichment − Country Enrichment − Metric to Flow Improvements 6.6 − SaaS Application Enrichment − Application Categories − Flow to Metric Workflows − Application Views 6.3 − Service Profile Enrichment 6.5 − Application ID & Resolution You are here! 6.7 − Application Report Variables − SaaS Application Enrichment - IPv6 support − Flow to Metric Chain Enhancement Software Networking / SS1201 / Aug 2024 / © 2024 IBM Corporation 7.0 − Kubernetes monitoring via eBPF − Visibility into k8s network traffic − Instant visibility in to flows between − Pod, Namespace, Node − IP, Port, Protocol − ‘One Click’ deploy via RedHat Marketplace available − Per conversation RTT/latency
  • 54.
    How does NetFlowwork? Supported by market leading vendors: • Cisco • Versa • Juniper • Alcatel-Lucent • Arista • Citrix NetScaler • VMware ESX 54 Observe traffic behavior from the network Visualize network flow traffic as it enters or exits an interface revealing traffic patterns and country of origin. Analyze the data and determine the cause of congestion or bandwidth utilization per application. Software Networking / SS1201 / Aug 2024 / © 2024 IBM Corporation
  • 55.
    App-Aware Flow Analytics at-a-Glance Supportfor the broadest set of technologies • Cisco, Juniper, Alcatel- Lucent, Citrix, VMware and many others. • Support for NetFlow v5 v9, v10, IPFIX, cFlow, jFlow, sFlow and AppFlow OOTB • SDWAN vendor field and resolution support Deep visibility without external probes • Cisco NBAR and AVC • IPFIX Variable Length Fields • Flow metadata via Option Templates and Enterprise Fields • Template ID lookups to provide human readable results App-Aware NPM • Automatic SaaS application identification • Define your own applications to enrich internal network traffic • Application grouping to assess network capacity for budgeting and more. • Country/ASN point of origin enrichment and flags Application Centric Workflows • Query and report on popular applications • Troubleshoot performance issues using Metric to Flow and Flow to Metric workflows. • Drill down to understand infrastructure dependencies • Identify bandwidth hogs using application bandwidth alerts Fast, distributed flow reporting • High speed Flow database to provide faster report performance • Clustered architecture that can scale with your infrastructure growth • Easy to use UI • OOTB application centric views and dashboards Real-time edge analytics on flow data • Create policies and thresholds on flow data • Display real-time alerts on top of Status Maps • Integrate alerts with other systems via Traps or WebHooks 55 Software Networking / SS1201 / Aug 2024 / © 2024 IBM Corporation
  • 56.
    Flow analytics and application-first workflows 1.Application, Port, Bandwidth and Response Time Visibility 2. Identify application impacting behaviors and events 3. Gain insights into infrastructure use and cut down your troubleshooting time 4. Query and drill down from flow to understand infrastructure dependencies 5. Use flexible application grouping i.e., collaboration tools), easily assess network capacity for budgeting purposes and more. Software Networking / SS1201 / Aug 2024 / © 2024 IBM Corporation
  • 57.
    Application Context Drill down tounderstand infrastructure dependencies using flexible application grouping (i.e., collaboration tools) to quickly assess bandwidth, alerts, network capacity for budgeting purposes and more. Software Networking / SS1201 / Aug 2024 / © 2024 IBM Corporation Flow to Metric Drill Down Start with the network flow data and view the supporting infrastructure with a single click.
  • 58.
    NetFlow Analytics –Business Benefits Packet analytics without probes Visibility into application and infrastructure behaviors without the cost of dedicated traffic probe solutions Application traffic awareness Gain deeper understanding of traffic patterns, application usage and types of service. Automatic SaaS application identification and grouping Plan capacity with confidence Understand bandwidth use down to protocols and conversations to better target capacity increases and infrastructure optimization Operational Insights into your applications Turn your deeper understanding of your infrastructure into actionable Operational Insights with real- time analytics. 58 Software Networking / SS1201 / Aug 2024 / © 2024 IBM Corporation
  • 59.
    NetFlow Analytics –SevOne Unique Advantages Flow Analytics with Speed at Scale Cluster Architecture and fast raw data store allows you to monitor thousands of interfaces and report in seconds. Broad Visibility for Operations and the Business Support for most NetFlow formats out of the box to provide unmatched visibility Actionable Insights to the Business and your Users Real-time analytics to help you determine behaviors in your application infrastructure and categories Operational Simplicity and Efficiency Deploys simply, integrates deeply. SevOne’s unique Metric-to-Flow, Flow-to-Metric and Metric-to-Log workflows allow you to cut troubleshooting time in half. 59 Software Networking / SS1201 / Aug 2024 / © 2024 IBM Corporation
  • 60.
    Global Manufacturing and Mining –EMEA The Situation We offer an IP Exchange service and had no visibility into customer traffic, the tools we had made it a very painful process to get the data out so we could copy it to Excel. Because of this, reports took forever and weren’t customer friendly or accurate. The Solution Deploy IBM SevOne for Flow and Metrics analytics • Analyze and visualize flows from dedicated and shared interfaces • Monitor infrastructure end to end • Automatically provide customers with easy-to- understand reports The Outcome Our customers know exactly what their traffic consumption is and for what services. They trust our reports which has reduced the number of incidents where our customers challenged their bill based on their perception. 60 Software Networking / SS1201 / Aug 2024 / © 2024 IBM Corporation
  • 61.
    Tier 1 Service Provider– EMEA The Situation As a global organization we have over 400 sites connected via a variety of providers, while our application infrastructure is centralized, our users are not. We had a variety of tools that we used to manage capacity but had limited visibility into traffic and application use to better optimize our infrastructure. The Solution Deploy IBM SevOne for Flow and Metrics analytics • Analyze and visualize flows from WAN interfaces • Monitor infrastructure end to end • Use the reports to better plan capacity and improve customer experience The Outcome Our IT and Engineering departments now have up to the minute visibility into bandwidth, traffic and application use over WAN links, we can now properly forecast capacity, match application use to QoS configurations and ensure our WAN providers comply with their SLAs. 61 Software Networking / SS1201 / Aug 2024 / © 2024 IBM Corporation
  • 62.
    Top University – Americas TheSituation We offer a series of applications to our students and faculty members, from internal communications to content sharing to telepresence in order to give our users the tools they need to excel. We had no visibility into application use so when problems occurred, we spent too much time finger pointing leading to long resolution times The Solution Deploy IBM SevOne for Flow and Metrics analytics • Analyze and visualize flows towards and from the datacenter and application servers • Combine with other metrics to understand infrastructure utilization • Report on application use to determine normal behaviors and proactively resolve issues The Outcome Now we can see our infrastructure from a single screen and understand application and infrastructure utilization. This has led to an average reduction in MTTR of over 50% 62 Software Networking / SS1201 / Aug 2024 / © 2024 IBM Corporation
  • 63.
  • 64.
    Why SevOne forhybrid cloud monitoring? 64 Tool consolidation Address disjointed alerting that arises from using myriad of different tools or your hybrid cloud network End to end visualization Visualize end to end network performance across different underlying technologies. Reduce silos Reduce silos across different teams and gain holistic insights Faster troubleshooting Reduce mean time to resolution with insight across your on-prem and cloud-based infrastructure Software Networking / SS1201 / Aug 2024 / © 2024 IBM Corporation
  • 65.
    Use Cases Multi and HybridCloud Monitoring • Track availability and performance across different cloud platforms. • Do a comparison to see where your applications perform the best. Track your migration status • Executive reporting to show aggregated traffic on-prem vs Azure or AWS • Make better, data driven decisions. Right size your environment based on usage: • IBM SevOne allows you to find out underutilized resources that a user may be paying for at a full cost. • With these insights users can make better decisions on which VM/Instance size they should be using 65 Software Networking / SS1201 / Aug 2024 / © 2024 IBM Corporation
  • 66.
    Our approach to monitoringcloud is different and better 66 Using IBM SevOne to monitor AWS CloudWatch you will reduce the costs incurred by recurring API calls to CloudWatch to get overtime metrics. This results in up to 70% lower cost compared to other approaches of data collection. IBM SevOne integration with Azure uses the newly introduced Data Plane API that has an improved query limit allowing clients to collect large data sets in a cost effective and scalable way. IBM SevOne enriches the metrics collected with metadata from API polls, so you can do things like filter on an account or region and see every resource across different resources. No plugins required, No hassle of an external collector to ingest data to your platform. The plugins are built into the NMS and configuration and onboarding is easy Software Networking / SS1201 / Aug 2024 / © 2024 IBM Corporation Reduce Cost Data Enrichment Easy to get started
  • 67.
    Troubleshooting with hybridcloud monitoring 67 67 Alerting across your different platforms notify you that there is a Transit Gateway drop in traffic between us-east1 and us-east2 Automation tools ingesting webhook alerts from SevOne NPM can use this prompt to redirect traffic through a different region causing a seamless handover and no user experience degradation for the app user. Appropriate teams, in this case, the Cloud team gets notified. Automated ITSM tool integrations can create AWS tickets if necessary. Note: Saved Network Engineering Resource time Once alert clears, workflows can be created to route traffic back to the region or can be done manually Monitor both your cloud and on- prem environments • Save time of your valuable network or cloud engineering resources by engaging the right teams when you have an issue. • Consolidate on multiple monitoring tools spend. • Create workflows that focus on auto remediation and proactive monitoring holistically across your whole infrastructure. Software Networking / SS1201 / Aug 2024 / © 2024 IBM Corporation
  • 68.
    Complete visibility acrosshybrid multicloud networks Software Networking / SS1201 / Aug 2024 / © 2024 IBM Corporation
  • 69.
    A closer lookat monitoring AWS 69
  • 70.
    Unleash the powerof monitoring your AWS deployment Fast time to insight Out of the box reports Customize and share reports Gain visibility you entire AWS infrastructure Advanced analytics AWS-based data treated like any other metric ML-based baselines, policy- based alerting, capacity forecasting, etc. Store as collected data for one year Support hybrid multicloud Collect, analyze and visualize on- prem networks, AWS and Azure cloud deployments in a single system. Turn insights into actions Automate actions based on ML-based observations Reduce repetitive tasks Leverage self-service API- based data ingestion Software Networking / SS1201 / Aug 2024 / © 2024 IBM Corporation
  • 71.
    How can youget a holistic view of your entire infrastructure? – Users now have a way to monitor performance in their on-prem networks and monitor performance of different parts of public clouds. – As you migrate workloads to the cloud, you get powerful reporting capability to understand various aspects of the environment: – How is your migration is going? – What percentage of workloads have been migrated? – How is your application performance ‘on- prem’ vs in the public cloud. 71 Extended Visibility Software Networking / SS1201 / Aug 2024 / © 2024 IBM Corporation
  • 72.
    72 Architecture for monitoringAWS AWS Cloudwatch feeds metrics streams to S3 S3 Buckets store metric streams for different Cloudwatch namespaces with lifecycle policies SQS Queue notifies SevOne of new metrics available in metric streams SevOne pulls new metrics from S3 Buckets Metadata gets populated by API polling to different AWS components Software Networking / SS1201 / Aug 2024 / © 2024 IBM Corporation
  • 73.
    Onboarding Process SevOneprovides two options of onboarding: – Automated process with a Terraform template that spins up AWS resources required for the integration to work. – Manual process of configuration using the AWS console. Step 1 – Setup AWS Roles Creating roles in AWS for our Terraform template to use. This can be done using the AWS console or can be done with the provided Terraform template. Step 2 – Create AWS Infrastructure Creating the Infrastructure needed in AWS by running the terraform template from the NMS. Step 3 -(Use NMS UX to integrate with AWS) Use the onboarding UX to select the AWS Regions you would like to monitor for any specific Account ID. That’s it! With this ~9 Minute process, you have completed the AWS integration The Terraform template provided does the following: – Creates metric streams from different CloudWatch Namespaces. – Creates S3 Buckets that will store the metric streams with appropriate lifecycle policies. – Creates a SQS queue that will notify the plugin of new metric availability. 73 Software Networking / SS1201 / Aug 2024 / © 2024 IBM Corporation
  • 74.
    AWS Services Monitored today + SoftwareNetworking / SS1201 / Aug 2024 / © 2024 IBM Corporation
  • 75.
    Monitor AWS cloud resources EC2instances EC2, or Elastic Compute Cloud, is an AWS web service that provides resizable compute capacity in the cloud. EC2 is a fundamental building block of AWS and allows users to efficiently and cost- effectively run their applications and workloads in the cloud. S3 buckets Amazon S3, or Simple Storage Service, is an object storage service offered by AWS that provides highly scalable and secure storage for a wide range of data types and use cases. Transit Gateways AWS Transit Gateway is a fully managed service that enables customers to connect their Amazon Virtual Private Clouds (VPCs) and on-premises networks to a single gateway. Direct Connect AWS Direct Connect is a network service that provides dedicated and private connectivity between a customer’s on-premises infrastructure and AWS. NAT Gateways A network address translation (NAT) gateway is a highly available, managed AWS service that enables resources in a private subnet to access the internet or other AWS services but prevents inbound traffic from the internet. AWS Site-to-Site VPNs Site-to-site VPNs in AWS are used to establish secure connections between on-premises networks and VPCs in the AWS cloud. Gain insights on how your site-to-site VPNs in AWS are performing. 75 Elastic Block Store Elastic Block Store (EBS) is a block storage offered by AWS for use with EC2 instances. Get metrics like burst balance, read/write Ops and volume queue length to monitor the performance of block storage. Network Load Balancers Network Load Balancers (NLB) are a type of load balancing service that can distribute incoming traffic to multiple targets like EC2 instances, lambda functions, containers and more within a VPC. Granular metrics like active flow count broken down by packet type and packets per second give deep insights into load balancing service performance. – Read the solution brief: Hybrid Cloud Monitoring with SevOne NPM Software Networking / SS1201 / Aug 2024 / © 2024 IBM Corporation
  • 76.
    Use Case -Visualize on-prem and AWS infrastructure in a single Report Software Networking / SS1201 / Aug 2024 / © 2024 IBM Corporation
  • 77.
    More Use Cases1 Capacity Planning on Direct Connects, Transit Gateway attachments, and VPN Tunnels 2 Analyze Performance Bottlenecks of Applications by drilling into several different AWS Resources monitored. 3 Visualize your Cloud Migration Status with Reports showing Legacy Transport and Direct Connects/Transit Gateways 4 Track SLAs provided by AWS for different services from a vendor agnostic tool 5 Make better decisions on where to host specific infrastructure. For example, infrastructure that needs autoscaling can be on AWS, however Infrastructure that has a lot of cross region traffic can be on-prem to optimize cost 6 Application Dependency mapping. Use the VPC filtering option to visualize All instances performing a specific task as a part of an application. 77 Software Networking / SS1201 / Aug 2024 / © 2024 IBM Corporation
  • 78.
    A closer lookat monitoring Azure 78
  • 79.
    Unleash the powerof monitoring your Azure deployment Fast time to insight Out of the box reports Customize and share reports Gain visibility you entire Azure infrastructure Advanced analytics Azure-based data treated like any other metric ML-based baselines, policy- based alerting, capacity forecasting, etc. Store as collected data for one year Support hybrid multicloud Collect, analyze and visualize on- prem networks, AWS and Azure cloud deployments in a single system. Turn insights into actions Automate actions based on ML-based observations Reduce repetitive tasks Leverage self-service API-based data ingestion Software Networking / SS1201 / Aug 2024 / © 2024 IBM Corporation
  • 80.
    The IBM SevOneAdvantage 80 Traditional REST API Data Plane API IBM SevOne uses Improved query throughput and efficiency Reduced risk of throttling Metric collection at scale Requires an API call per resource (Inefficient) Users experience throttling (data gaps) 50x more efficient Lower costs to monitor Azure using Data Plane API vs REST API Software Networking / SS1201 / Aug 2024 / © 2024 IBM Corporation
  • 81.
    Monitor Azure cloud resourceswith IBM SevOne Azure Virtual Machines Azure Virtual Machines are cloud-based virtualized computing resources offered by Microsoft Azure, allowing users to run and manage various operating systems, customize performance, and scale as needed for a wide range of applications and workloads. Virtual Machine Scale Sets Virtual Machine Scale Sets in Azure are a group of identical VMs that automatically scale to meet high availability and load-balancing requirements for applications and services. 81 Software Networking / SS1201 / Aug 2024 / © 2024 IBM Corporation Azure Load Balancers Azure Load Balancer distributes incoming traffic across your backend servers to improve performance and application uptime. Azure ExpressRoute Azure ExpressRoute connects your on- prem infrastructure to your Azure Cloud environment. ExpressRoute services supported include ExpressRo ute Circuit and ExpressRoute Direct. Azure VPN Gateways Azure virtual network gateways act as secure connectors between your Azure virtual network and on-premises locations or other virtual networks. Azure Storage Accounts Azure Storage is a cloud storage platform that offers a variety of services for storing and accessing data in Microsoft's cloud.
  • 82.
    Automated device onboarding Automaticallydiscovers new resources in your environment and adds them to the NMS for monitoring Device group creation Device groups are created for every resource type so that users can get started with reporting quickly. Out of the box reports OOTB Reports for different resources takes you from integration to insights in minutes. Metadata enrichment We collect several different fields from the Azure Portal that add context to your Resources. 82 Support from IBM SevOne Software Networking / SS1201 / Aug 2024 / © 2024 IBM Corporation
  • 83.
    Azure Reports Read thesolution brief: Hybrid Cloud Monitoring with IBM SevOne Software Networking / SS1201 / Aug 2024 / © 2024 IBM Corporation
  • 84.
    IBM SevOne Packaging & Architecture IBMSevOne Automated Network Observability IBM SevOne NPM
  • 85.
    IBM SevOne offerings Twomain packages IBM SevOne Automated Network Observability (SANO) • A bundle of • IBM SevOne Network Performance Mgmt (NPM) • IBM Rapid Network Automation (RNA) • Licensed by device • Includes all features described in this deck • Includes 10 workflows of IBM Rapid Network Automation • Additional Rapid Network Automation (RNA) workflows are available using RNA per workflow SKUs IBM SevOne NPM • Licensed by device • Includes all features described in this deck, except features enabled by IBM Rapid Network Automation: • automated actions • low-code/no-code automation engine • workflow building blocks and • self-service API-based data ingestion Existing IBM SevOne NPM customers can trade-up to IBM SevOne Automated Network Observability 85 Software Networking / SS1201 / Aug 2024 / © 2024 IBM Corporation
  • 86.
    IBM SevOne Architecture IBM SevOneAutomated Network Observability (IBM SevOne NPM +Rapid Network Automation)
  • 87.
    SevOne NPM Architecture The mainservers involved in a SevOne NPM deployment: NMS - Central component of SevOne NPM Collects data, stored data in the database, generates alerts, etc. HSA - Brings HA to the NMS server DNC - NMS server dedicated to monitor flow data Data Insight - Reporting, dashboards and workflow Special collectors - Some technologies require stand alone servers that will collect data from those specific technologies Software Networking / SS1201 / Aug 2024 / © 2024 IBM Corporation
  • 88.
    NMS - Introduction TheNMS is a self-contained software appliance that performs • Collection of data (except some plugins) • Alerting • Reporting through SURF • Database The IBM SevOne platform could work with a single NMS (cluster master) If we require better reporting, resiliency or some specific solutions, we might need more NMSs or other servers (such as DI) We can add “unlimited” peers to the cluster master, allowing us to expand the IBM SevOne platform Software Networking / SS1201 / Aug 2024 / © 2024 IBM Corporation
  • 89.
    DNC – Dedicated NetFlowCollector The Dedicated NetFlow Collector (DNC) server is similar to the NMS server, but it can only collect NetFlow data, whereas the NMS can collect metrics from other protocols (SNMP, ICMP, etc) as well as NetFlow. On deployments where NetFlow data is a heavy component required, it is recommended deploying dedicated DNC servers for NetFlow data. Nulla eu mattis elit, efficitur scelerisque velit. Vestibulum viverra, ante ac placerat. Lorem ipsum dolor sit amet, consectetur adipiscing elit. Sed at sem erat. Vivamus a pulvinar sapien. Orci varius natoque pen et magnis dis parturi montes, nasce ridiculus mus nonamus totalis ellimatus est. Software Networking / SS1201 / Aug 2024 / © 2024 IBM Corporation
  • 90.
    NMS - Resiliency •SevOne offers resiliency at the NMS level using HSA servers • HSA servers are NMS servers with the role of HSA (“same” image, different role) • Each NMS needs to be paired with an HSA server to become a cluster • An HSA can be paired only with a single NMS • If we want to add resiliency to three NMS servers, we need three HSA servers, each of them paired to one NMS server • Replication between servers occur in real time and the failover time takes a few seconds • NMS and DNC servers can have HSA servers paired to them Stream Primary Appliance (PAS) Standby Appliance (HSA) Config Database Data Database Real-time Replication Real-time Replication Config Database Data Database Config Database from Cluster Master Software Networking / SS1201 / Aug 2024 / © 2024 IBM Corporation
  • 91.
    NMS & DNC Modelsand Capacity Model Objects Max Indicators /sec Specs (for virtual machine) vPAS5k 5,000 333 CPU: 2 cores RAM: 8GB Disk: 150GB vPAS20k 20,000 1,333 CPU: 8 cores RAM: 24GB Disk: 600GB vPAS60k 60,000 4,000 CPU: 8 cores RAM: 44GB Disk: 150GB and 1.3TB vPAS100k 100,000 6,666 CPU: 8 cores RAM: 96GB Disk: 500GB and 2TB vPAS200k 200,000 13,333 CPU: 16 cores RAML 220GB Disk: 600GB and 4TB Model Flow Interfaces Max Flows/ sec Specs (for virtual machine) vDNC100 100 30,000 CPU: 8 cores RAM: 16GB Disk: 150GB and 400GB vDNC300 300 80,000 CPU: 16 cores RAM: 48GB Disk: 150GB and 800GB vDNC1000 1000 80,000 CPU: 24 cores RAM: 96GB Disk: 150GB and 1.5TB vDNC1500 1500 80,000 CPU: 24 cores RAM: 128GB Disk: 150GB and 3.0TB When collecting metrics When collecting flows Software Networking / SS1201 / Aug 2024 / © 2024 IBM Corporation
  • 92.
    NMS - Processes Whileseveral processes run on the NMS, these are the main ones. 1 Apache Web Server Apache2 is the web server for SevOne and provides access to the SevOne GUI and API 2 MYSQL Database With two main databases (config and data) stores the configuration and polled data 3 Netflow Collector “SevOne netflowd” is used to receive NetFlow data from network devices 4 Scheduler “SevOne polld” is our standard polling daemon and is used when polling devices at a frequency of greater than 60 seconds 5 Trap Collector “SevOne trapd” is the process used to receive traps in to SevOne. Small to medium businesses may use SevOne as a simple FMS tool 6 continued next slide 92 Software Networking / SS1201 / Aug 2024 / © 2024 IBM Corporation
  • 93.
    NMS – Processescontinued Name Process Runs On… Process Information Apache2 Web Server /usr/sbin/apache2 Master+Slave Apache2 is the web server for SevOne and provides access to the SevOne GUI and API MySQL Config Database /usr/bin/mysqld Master+Slave SevOne uses MySQL as its datastore for both configuration data and polled data. This is the MySQL process supporting our configuration database. This contains device details, SevOne settings etc. MySQL Data Database /usr/bin/mysqld Master+Slave SevOne uses MySQL as its datastore for both configuration data and polled data. This is the MySQL process supporting our data database. This contains polled data SSH Daemon /usr/sbin/sshd Master+Slave SSHd is the Secure Shell daemon and is used for administrative access to the SevOne system Syslog /usr/sbin/syslog-ng Master+Slave Syslog-NG is the logging daemon that processes logs from the various processes within the system. It ca also be used to forward logs to another host if required sFlow Converter /usr/local/bin/sflowtool Master+Slave (Optional Process, Licensed) sFlow Converter is an optional process used for converting sFlow data to Netflow. This process is used when SevOne is used as a sFlow receiver Traffic Samplicator /usr/local/bin/samplicate Master (Optional Process, Licensed) Samplicator is an optional process used for redirecting netflow traffic from one port to another SevOne Backfill Daemon /usr/local/bin/SevOne-backfilld Master (Optional Process, Licensed) xStats is SevOnes technology that allows us to take data from any source and insert it in to SevOne. The backfill process is used to insert data into SevOne that is >2 hours old SevOne Call Daemon /usr/local/bin/SevOne-calld Master (Optional Process, Licensed) SevOne calld is a process used for receiving CMR, CDR and call quality records from Cisco CallManager and Avaya PBX systems. This is used for SevOnes telephony feature SevOne Data Daemon /usr/local/bin/SevOne-datad Master SevOne datad is the data extraction handing process that receives data from all other system processes and processes it before sending to the memory buffer SevOne Master/Slave Monitor /usr/local/bin/SevOne- masterslaved Master+Slave SevOne masterslaved is the process that handles which appliance becomes master and which becomes slave. It also handles failover and heartbeat checking between the appliances SevOne Message Aggregator /usr/local/bin/messageswitch Master Messageswitch is for passing alert messages between peers in the cluster. If a policy or threshold alert is triggered on a peer then it is sent to the cluster master via messageswitch for further processing SevOne MIB Daemon /usr/local/bin/SevOne-mibd Master+Slave SevOne mibd is a process that syncronises mibs between the database and the filesystem for use within SevOne (e.g. for polling etc) SevOne NetFlow Collector /usr/local/bin/SevOne-netflowd Master (Optional Process, Licensed) SevOne netflowd is used to receive netflow data from network devices. This data is then visible within the FlowFalcon reporting feature within SevOne SevOne Realtime Scheduler /usr/local/bin/SevOne-highpolld Master SevOne highpolld is our high frequency polling daemon and is used when polling devices at a frequency of less than 60 seconds. This process supports all plugins (e.g. not just SNMP polling) SevOne Request Daemon /usr/local/bin/SevOne-requestd Master+Slave SevOne requestd is a key process which is used for communications between all cluster members. It is used to communicate status, data, graphs etc between peers within the SevOne cluster SevOne Scheduler /usr/local/bin/SevOne-polld Master SevOne polld is our standard polling daemon and is used when polling devices at a frequency of greater than 60 seconds. This process supports all plugins (e.g. not just SNMP polling) SevOne Stats /usr/local/bin/SevOne-statsd Master+Slave SevOne statsd publishes system statistics via SNMP. These statistics can be viewed via the selfmon system in the GUI SevOne Trap Collector /usr/local/bin/SevOne-trapd Master SevOne trapd is the process used to RECEIVE traps in to SevOne. Small to medium businesses may use SevOne as a simple FMS tool SevOne xStats Backfill Insertion Daemon /usr/local/bin/SevOne-insert- backfilld Master (Optional Process, Licensed) xStats is SevOnes technology that allows us to take data from any source and insert it in to SevOne. The backfill process is used to insert data into SevOne that is >2 hours old SevOne xStats Dispatch Daemon /usr/local/bin/SevOne-dispatchd Master (Optional Process, Licensed) xStats is SevOnes technology that allows us to take data from any source and insert it in to SevOne. The dispatch process ………?? SevOne xStats File Collector /usr/local/bin/SevOne-fcad Master (Optional Process, Licensed) xStats is SevOnes technology that allows us to take data from any source and insert it in to SevOne. The file collector process moves files between the xStats processing folders SevOne Insertion Daemon /usr/local/bin/SevOne-insertd Master (Optional Process, Licensed) xStats is SevOnes technology that allows us to take data from any source and insert it in to SevOne. The insertion daemon is used to insert data into SevOne that is <2 hours old SevOne Search Daemon /usr/local/bin/SevOne-searchd Master+Slave SevOne searchd is a process that indexes the data within the system for faster lookups Software Networking / SS1201 / Aug 2024 / © 2024 IBM Corporation
  • 94.
    WMI Proxy In orderto monitor WMI data from Windows servers, it is required to install one or more WMI proxy servers on Windows machines The WMI proxy installed on those Windows machines will be the ones querying WMI data to the targeted Windows servers, and send the data back to the NMS server There is no HA option for the WMI proxy Software Networking / SS1201 / Aug 2024 / © 2024 IBM Corporation
  • 95.
    Collectors SevOne offers specific solutionsfor technologies such as Wifi, SDWAN and SDN. These solutions require a special type of collector installed in a dedicated server. The requirements for each solution depends on the solution itself and the version of the software. Several workers (servers) can be added to the solution to expand the capacity, i.e., monitor more devices. * There are no HA options for these collectors (updated July 2021) Software Networking / SS1201 / Aug 2024 / © 2024 IBM Corporation
  • 96.
    Data Insight (DI) DIis the reporting tool for the NMS. Without this server, the NMS has very little reporting capabilities. It gets all the data from the NMS (from the cluster master) using fast API calls (SOA). There is no HA option for DI, only multiple workers managed by the master DI. • Multiple instances can be deployed pointing to the same NMS cluster. It requires configuring all DI settings twice as there is no connection between DI instances. For bigger deployments, it is possible to deploy workers (servers) to increase the performance of the tool when several users are connected and running reports. Software Networking / SS1201 / Aug 2024 / © 2024 IBM Corporation
  • 97.
    Data Insight (DI)- Architecture A DI Cluster can be composed of one or more DI servers in a Master-Worker node relationship. If a DI cluster is configured with multiple servers, the master node handles the initial incoming nginx (web server) requests and then randomly sends the requests to the other DI appliances for load balancing. Each node will use a container management system (Kubernetes) to manage each internal pod. Software Networking / SS1201 / Aug 2024 / © 2024 IBM Corporation
  • 98.
    Data Insight (DI)- Processes Main components: GraphQL - query language used to get data from the NMS using SOA (aka DIRA) API MySQL - database used to store DI configuration (roles, reports, links, etc) NGINX - web server All nodes on a cluster will have the GraphQL and NGINX pods, but only one will have the MySQL database (randomly assigned) Software Networking / SS1201 / Aug 2024 / © 2024 IBM Corporation
  • 99.
    IBM Rapid NetworkAutomation Architecture The new automation features in SevOne Automated Network Observability are delivered by IBM Rapid Network Automation. Rapid Network Automation is separate software from IBM SevOne. Downloaded separately, Rapid Network Automation also has its own deployment requirements. Rapid Network Automation is an advanced API-driven orchestration platform that automates, integrates, and connects across the network and business. Using a low-code approach and transforming API code into deployment- ready action blocks, it facilitates, integrates, and secures communication up and down the technology stack between platforms, services, and applications. The automation platform is a containerized microservices application that runs on top of a Kubernetes platform. The exact platform varies depending on the needs of the deployment. It supports running on a single-node Kubernetes K3s cluster, a three-node cluster running K3s. Kubernetes provides the container management layer that enables scaling and availability of the microservices. Regardless of the underlying Kubernetes flavor, the instance uses the same installation scripts and configuration files for deployment and upgrade. Software Networking / SS1201 / Aug 2024 / © 2024 IBM Corporation
  • 100.
    100 IBM Rapid NetworkAutomation– Platform overview Management UI Plugin Extension UI Third-party Apps UI Webhooks Inbound User Interface – UI is deployed in its own separate container, easily customizable and upgradable REST API – Fully Open API-Compliant REST API is easily consumed by UI and client services Configuration management Authentication Provider Workflow Scheduler Events Gateway Core System Message Bus – Easily allows the platform to scale both horizontally and vertically Execution System – Full role-based access control (RBAC) on a per action block basis, enables secure execution of API commands Workflow engine Cloud Ticketing & ITSM Controller Infrastructure Telemetry & Analysis Test & Measurement Integrations – Integration generate workflow building blocks using low-code interface to simplify API programming for automation and execution Software Networking / SS1201 / Aug 2024 / © 2024 IBM Corporation
  • 101.
    101 Actions via API Retrievedata Push data 3rd Party Data IT System Mgmt. Apps Network Devices Client Environment Observe Alert trigger Push data Cloud Resources Building Blocks Leverage 1000s of pre-built building blocks for interacting with network devices, cloud resources, applications, ITSMs, 3rd party data and more. Edit them and/or create your own building blocks Assemble building blocks to create automation workflows Automation Workflows Leverage a series of curated workflow templates from IBM TechXchange Edit them and/or stitch your own workflows using building blocks. Trade-up comes with license to use/create 10 workflows Applications How does Rapid Network Automation work with SevOne NPM? Collaborate Visualize Unify Enrich Store Extract IBM SevOne NPM Stream Webhooks APIs 3rd Party Data IBM Rapid Network Automation Software Networking / SS1201 / Aug 2024 / © 2024 IBM Corporation