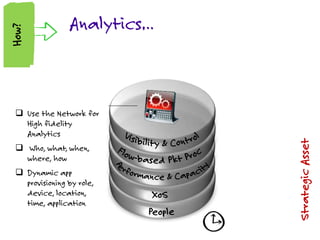
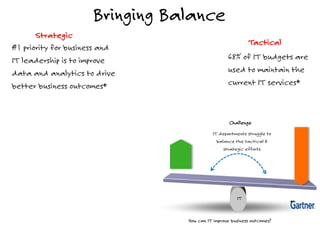
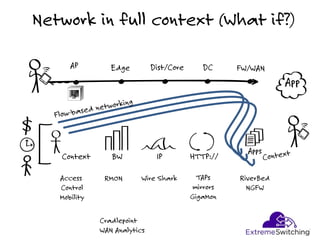
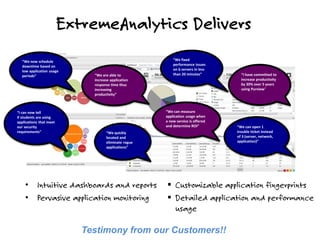
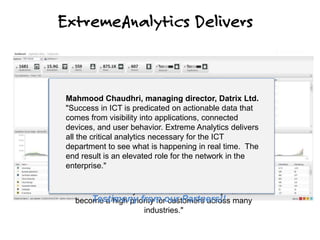
Ask your network for Analytics…
StrategicAsset
Analytics…
 Use the Network for
High fidelity
Analytics
 Who, what, when,
where, how
 Dynamic app
provisioning by role,
device, location,
time, application
Why?Why?How?
Bringing Balance
68% of IT budgets are
used to maintain the
current IT services*
Tactical
#1 priority for business and
IT leadership is to improve
data and analytics to drive
better business outcomes*
Strategic
IT departments struggle to
balance the tactical &
strategic efforts
Challenge
How can IT improve business outcomes?
IT
*
Network in full context (What if?)
App
AP Edge Dist/Core DC FW/WAN
Context BW IP HTTP://
Apps
Access
Control
Mobility
RMON Wire Shark TAPs
mirrors
GigaMon
RiverBed
NGFW
Cradlepoint
WAN Analytics
Challenges – Poor Network & Application Visibility
0
#1 Priority of CIOs and IT Directors:
Better Data and Analytics
CIO Magazine
How is Your Network Being Used?
Behavior
Application
Experience
Layer 1- L3 Through Layer 4 Through Layer L7
Historical analysis for top
flow information
 Drill-ins for more
detail
 Top applications by
bandwidth and flows
 Top servers by bandwidth and flows
 Flow alarms
 Suspicious traffic
 Undesirable traffic
Customizable application
fingerprints
 Accurate with signatures &
heuristics
 Over 14,000 fingerprints for over
7,000 applications out of the box
 Ability to fingerprint custom
applications
Behavior
Application
Experience
Layer 1- L3 Through Layer 4 Through Layer L7
Intuitive dashboards
Top Applications - Tree Map
Behavior
Application
Experience
Layer 1- L3 Through Layer 4 Through Layer L7
Who (and What) is on Your Network?
Behavior
Application
Experience
Layer 1- L3 Through Layer 4 Through Layer L7
Start Troubleshooting in the Right Place
Behavior
Application
Experience
Layer 1- L3 Through Layer 4 Through Layer L7
 Matt says his the network is slow while doing an online demo…. Purview says it is not
 However, the application is slow so focus troubleshooting there.
Super Bowl XLVIII (Over a Cisco Network)
Behavior
Application
Experience
Layer 1- L3 Through Layer 4 Through Layer L7
“Better Connections. Better Experiences.
For Everyone” can
Behavior
Application
Experience
Layer 1- L3 Through Layer 4 Through Layer L7
Reputation feed
Directly monitor the network without the use of a Purview Application Sensor
 Easily export Purview data to third party tools, such as Excel for additional
manipulation of application data
 Provide accurate count of clients on the network for marketing purposes
(provides insight into venue network usage) Application usage trend analysis per
client
Call Quality in Context
 MOS
 Start, End, Duration
 Caller, Callee, URI
 Location and Prioritized
Session Info
Measure and report adoption
usage and responsiveness of
applications
Behavior
Application
Experience
Layer 1- L3 Through Layer 4 Through Layer L7
Optimize network design to
improve user experience
Historical Network Analytics
Bandwidth & Flow
information
– Drill-ins for more
detail
– Top applications
– Top clients
– Top servers
• Aggregate flows
• Latest flows
• Flow alarms
– Suspicious traffic
– Undesirable
traffic
ExtremeAnalytics Delivers
• Intuitive dashboards and reports
• Pervasive application monitoring
“We can measure
application usage when
a new service is offered
and determine ROI”
“We are able to
increase application
response time thus
increasing
productivity”
“I have committed to
increase productivity
by 30% over 5 years
using Purview”
“We quickly
located and
eliminate rogue
applications”
“I can now tell
if students are using
applications that meet
our security
requirements”
“We fixed
performance issues
on 6 servers in less
than 20 minutes”
“We can open 1
trouble ticket instead
of 3 (server, network,
application)”
“We now schedule
downtime based on
low application usage
periods”
 Customizable application fingerprints
 Detailed application and performance
usage
Testimony from our Customers!!
Demand is Outpacing Spend
100%0%
2014 Enterprise IT Spend – Cross Industry Average*
13%19%68%
10%
Grow
Transform
Run
Source: Gartner
Percent Budget Spend
50%
0%
Annual Average Growth Rate
48%
40%
19%
10%
Storage
Network
Power
Servers
Core IT Resource Demand*
Source: Gartner
*
ExtremeAnalytics Delivers
Martin Jones, managing director, LAN3
"ExtremeAnalytics provides LAN3 with a higher
value proposition for our customers, enabling us to
demonstrate how the network can become a
strategic asset through added visibility into
applications, services and users. ExtremeAnalytics
is pervasive in its reach and places valuable insight,
data and actionable intelligence into the hands of
the company's CIO, facilitating the optimization of IT
assets. The new product award for Extreme
Networks is well deserved."
Peter Cooper, sales director, Vanix
"Extreme Networks has a singular solution in
ExtremeAnalytics, serving as a competitive
advantage for Vanix. Our customers can work with
us to implement and customize ExtremeAnalytics
in order to gain a better understanding of the
behavior, transactions and applications on their
networks. The Network Computing best new
product for 2015 further establishes
ExtremeAnalytics unique place in the market, as
business analytics and network visibility have
become a high priority for customers across many
industries."
Courtney Green, managing director,
NETconnection Systems Ltd
"Network Computing readers have rightfully
recognized Extreme Networks for bringing a ground-
breaking analytics solution to market and for changing
the way that organizations can assess and benefit
from their technology investments. Analytics,
stemming from both wired and wireless applications
and users, are crucial to enabling successful business
outcomes and Extreme Analytics truly hits the mark."
Mahmood Chaudhri, managing director, Datrix Ltd.
"Success in ICT is predicated on actionable data that
comes from visibility into applications, connected
devices, and user behavior. Extreme Analytics delivers
all the critical analytics necessary for the ICT
department to see what is happening in real time. The
end result is an elevated role for the network in the
enterprise."
Testimony from our Partners!!
Extreme Control & Analytics – End to End Visibility & Control
Data Center
Core
Distribution
Wired
Edge
Wireless
Edge  Control Center (Wired / Wireless)
 Identity (Access Control)
 Analytics (Application visibility)
 Connect (integration with systems
like data center management,
MDM, etc).
How we do it better!
70%
prioritize
business apps
52%
make unknown
become known
Deliver Business Value
71%
improve
troubleshooting
64%
improve user
experience
Why do this in the network?
Network Activity in Full Context
Business Value
App
AP Edge Dist/Core DC FW/WAN
Context BW IP HTTP:// Apps
PV-V-50K-SYS-2 (virtual): $19,995
 NMS-ADV-5
 PV-FPM-50K
 PV-FC-180: $15,995 US List 4 port SFP+ Purview Application Sensor
appliance (3) MGBIC-02 &(2) SSA-FB-AC-PS-B power supplies
PV-50K-SYS-2 (PV-A-300 hardware Included): $29,995
NetSight
NAC
DCM
Mobile IAM
Purview
IPS
SIEM
Access Layer
“The ability to report mean opinion scores (MOSs) for voice applications
means Extreme is one of the few vendors that can fully optimize the
access layer for any enterprise considering an "all wireless office"
decision.”
Handles Multivendor Environments
“Aruba's management and service applications (ClearPass, IMC, Meridian and
AirWave) support non-HP devices, which simplifies orchestration within multivendor
environments.”
No Unified Access Layer
“The level of integration between Juniper and its Open Convergence Framework
partners may impact customers' ability to implement a unified access layer with a
single policy, security and management interface.”
No Switching Portfolio
“Ruckus is WLAN-focused and does not have a wired switching portfolio. While it
has formed a partnership with Juniper, competing vendors may be used for
switching to provide a complete access layer solution.”

13.) analytics (user experience)

  • 1.
    Ask your networkfor Analytics…
  • 2.
    StrategicAsset Analytics…  Use theNetwork for High fidelity Analytics  Who, what, when, where, how  Dynamic app provisioning by role, device, location, time, application Why?Why?How?
  • 3.
    Bringing Balance 68% ofIT budgets are used to maintain the current IT services* Tactical #1 priority for business and IT leadership is to improve data and analytics to drive better business outcomes* Strategic IT departments struggle to balance the tactical & strategic efforts Challenge How can IT improve business outcomes? IT *
  • 4.
    Network in fullcontext (What if?) App AP Edge Dist/Core DC FW/WAN Context BW IP HTTP:// Apps Access Control Mobility RMON Wire Shark TAPs mirrors GigaMon RiverBed NGFW Cradlepoint WAN Analytics
  • 5.
    Challenges – PoorNetwork & Application Visibility 0 #1 Priority of CIOs and IT Directors: Better Data and Analytics CIO Magazine
  • 6.
    How is YourNetwork Being Used? Behavior Application Experience Layer 1- L3 Through Layer 4 Through Layer L7 Historical analysis for top flow information  Drill-ins for more detail  Top applications by bandwidth and flows  Top servers by bandwidth and flows  Flow alarms  Suspicious traffic  Undesirable traffic
  • 7.
    Customizable application fingerprints  Accuratewith signatures & heuristics  Over 14,000 fingerprints for over 7,000 applications out of the box  Ability to fingerprint custom applications Behavior Application Experience Layer 1- L3 Through Layer 4 Through Layer L7 Intuitive dashboards
  • 8.
    Top Applications -Tree Map Behavior Application Experience Layer 1- L3 Through Layer 4 Through Layer L7
  • 9.
    Who (and What)is on Your Network? Behavior Application Experience Layer 1- L3 Through Layer 4 Through Layer L7
  • 10.
    Start Troubleshooting inthe Right Place Behavior Application Experience Layer 1- L3 Through Layer 4 Through Layer L7  Matt says his the network is slow while doing an online demo…. Purview says it is not  However, the application is slow so focus troubleshooting there.
  • 11.
    Super Bowl XLVIII(Over a Cisco Network) Behavior Application Experience Layer 1- L3 Through Layer 4 Through Layer L7 “Better Connections. Better Experiences. For Everyone” can
  • 12.
    Behavior Application Experience Layer 1- L3Through Layer 4 Through Layer L7 Reputation feed Directly monitor the network without the use of a Purview Application Sensor  Easily export Purview data to third party tools, such as Excel for additional manipulation of application data  Provide accurate count of clients on the network for marketing purposes (provides insight into venue network usage) Application usage trend analysis per client
  • 13.
    Call Quality inContext  MOS  Start, End, Duration  Caller, Callee, URI  Location and Prioritized Session Info Measure and report adoption usage and responsiveness of applications Behavior Application Experience Layer 1- L3 Through Layer 4 Through Layer L7 Optimize network design to improve user experience
  • 14.
    Historical Network Analytics Bandwidth& Flow information – Drill-ins for more detail – Top applications – Top clients – Top servers • Aggregate flows • Latest flows • Flow alarms – Suspicious traffic – Undesirable traffic
  • 15.
    ExtremeAnalytics Delivers • Intuitivedashboards and reports • Pervasive application monitoring “We can measure application usage when a new service is offered and determine ROI” “We are able to increase application response time thus increasing productivity” “I have committed to increase productivity by 30% over 5 years using Purview” “We quickly located and eliminate rogue applications” “I can now tell if students are using applications that meet our security requirements” “We fixed performance issues on 6 servers in less than 20 minutes” “We can open 1 trouble ticket instead of 3 (server, network, application)” “We now schedule downtime based on low application usage periods”  Customizable application fingerprints  Detailed application and performance usage Testimony from our Customers!!
  • 16.
    Demand is OutpacingSpend 100%0% 2014 Enterprise IT Spend – Cross Industry Average* 13%19%68% 10% Grow Transform Run Source: Gartner Percent Budget Spend 50% 0% Annual Average Growth Rate 48% 40% 19% 10% Storage Network Power Servers Core IT Resource Demand* Source: Gartner *
  • 17.
    ExtremeAnalytics Delivers Martin Jones,managing director, LAN3 "ExtremeAnalytics provides LAN3 with a higher value proposition for our customers, enabling us to demonstrate how the network can become a strategic asset through added visibility into applications, services and users. ExtremeAnalytics is pervasive in its reach and places valuable insight, data and actionable intelligence into the hands of the company's CIO, facilitating the optimization of IT assets. The new product award for Extreme Networks is well deserved." Peter Cooper, sales director, Vanix "Extreme Networks has a singular solution in ExtremeAnalytics, serving as a competitive advantage for Vanix. Our customers can work with us to implement and customize ExtremeAnalytics in order to gain a better understanding of the behavior, transactions and applications on their networks. The Network Computing best new product for 2015 further establishes ExtremeAnalytics unique place in the market, as business analytics and network visibility have become a high priority for customers across many industries." Courtney Green, managing director, NETconnection Systems Ltd "Network Computing readers have rightfully recognized Extreme Networks for bringing a ground- breaking analytics solution to market and for changing the way that organizations can assess and benefit from their technology investments. Analytics, stemming from both wired and wireless applications and users, are crucial to enabling successful business outcomes and Extreme Analytics truly hits the mark." Mahmood Chaudhri, managing director, Datrix Ltd. "Success in ICT is predicated on actionable data that comes from visibility into applications, connected devices, and user behavior. Extreme Analytics delivers all the critical analytics necessary for the ICT department to see what is happening in real time. The end result is an elevated role for the network in the enterprise." Testimony from our Partners!!
  • 18.
    Extreme Control &Analytics – End to End Visibility & Control Data Center Core Distribution Wired Edge Wireless Edge  Control Center (Wired / Wireless)  Identity (Access Control)  Analytics (Application visibility)  Connect (integration with systems like data center management, MDM, etc). How we do it better!
  • 19.
    70% prioritize business apps 52% make unknown becomeknown Deliver Business Value 71% improve troubleshooting 64% improve user experience Why do this in the network?
  • 20.
    Network Activity inFull Context Business Value App AP Edge Dist/Core DC FW/WAN Context BW IP HTTP:// Apps PV-V-50K-SYS-2 (virtual): $19,995  NMS-ADV-5  PV-FPM-50K  PV-FC-180: $15,995 US List 4 port SFP+ Purview Application Sensor appliance (3) MGBIC-02 &(2) SSA-FB-AC-PS-B power supplies PV-50K-SYS-2 (PV-A-300 hardware Included): $29,995 NetSight NAC DCM Mobile IAM Purview IPS SIEM
  • 21.
    Access Layer “The abilityto report mean opinion scores (MOSs) for voice applications means Extreme is one of the few vendors that can fully optimize the access layer for any enterprise considering an "all wireless office" decision.” Handles Multivendor Environments “Aruba's management and service applications (ClearPass, IMC, Meridian and AirWave) support non-HP devices, which simplifies orchestration within multivendor environments.” No Unified Access Layer “The level of integration between Juniper and its Open Convergence Framework partners may impact customers' ability to implement a unified access layer with a single policy, security and management interface.” No Switching Portfolio “Ruckus is WLAN-focused and does not have a wired switching portfolio. While it has formed a partnership with Juniper, competing vendors may be used for switching to provide a complete access layer solution.”