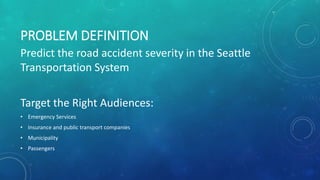
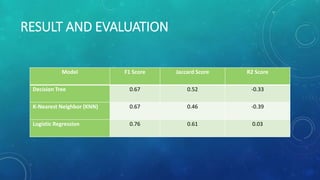
APPLIED DATA SCIENCE CAPSTONE
CAR ACCIDENT SEVERITY
OMID KARAMI
APPLIED DATA SCIENCE CAPSTONE
SEPTEMBER 2020
PROBLEM DEFINITION
Predict the road accident severity in the Seattle
Transportation System
Target the Right Audiences:
• Emergency Services
• Insurance and public transport companies
• Municipality
• Passengers
DATA
Data Description
The dataset is available in Comma Separated Value (CSV) format
Source: Seattle Department of Transportation
The dataset consists of 39 independent variables and 221,525 rows.
The dependent variable or target variable, “SEVERITYCODE”,
contains value corresponds to the severity of the collision.
DATA
Data Cleaning
Data cleaning is one of the most important steps in pre-processing stage.
Eliminating unwanted, duplicate and irrelevant observations significant
caused a good insights into the data and achieve better results.
• Missing target variable
• Redundant and useless data
• Convert categorical variable to numeric
• Standardization
• Normalization
DATA
Data Exploration
Source: IBM Cloud – Watson Studio
METHODOLOGY
Predict the severity of accidents using the supervised
learning algorithms
Two different categories in Machine Learning Models.
Regression and Classification models.
• Decision Tree
• K-Nearest Neighbor (KNN)
• Logistic Regression
RESULT AND EVALUATION
Model F1 Score Jaccard Score R2 Score
Decision Tree 0.67 0.52 -0.33
K-Nearest Neighbor (KNN) 0.67 0.46 -0.39
Logistic Regression 0.76 0.61 0.03
CONCLUSION
The purpose of this study is to predict a model for the severity of
road accidents.
Such a model can be adapted with any road traffic network
anywhere in the world.
The accuracy of this model is very good. It has 82% accuracy.
Therefore, based on this modeling, we can help the organizations
that are involved in road accidents such as:
• Emergency services
• Traffic center,
• Insurance and public transport

Applied Data Science Capstone

  • 1.
    APPLIED DATA SCIENCECAPSTONE CAR ACCIDENT SEVERITY OMID KARAMI APPLIED DATA SCIENCE CAPSTONE SEPTEMBER 2020
  • 2.
    PROBLEM DEFINITION Predict theroad accident severity in the Seattle Transportation System Target the Right Audiences: • Emergency Services • Insurance and public transport companies • Municipality • Passengers
  • 3.
    DATA Data Description The datasetis available in Comma Separated Value (CSV) format Source: Seattle Department of Transportation The dataset consists of 39 independent variables and 221,525 rows. The dependent variable or target variable, “SEVERITYCODE”, contains value corresponds to the severity of the collision.
  • 4.
    DATA Data Cleaning Data cleaningis one of the most important steps in pre-processing stage. Eliminating unwanted, duplicate and irrelevant observations significant caused a good insights into the data and achieve better results. • Missing target variable • Redundant and useless data • Convert categorical variable to numeric • Standardization • Normalization
  • 5.
    DATA Data Exploration Source: IBMCloud – Watson Studio
  • 8.
    METHODOLOGY Predict the severityof accidents using the supervised learning algorithms Two different categories in Machine Learning Models. Regression and Classification models. • Decision Tree • K-Nearest Neighbor (KNN) • Logistic Regression
  • 9.
    RESULT AND EVALUATION ModelF1 Score Jaccard Score R2 Score Decision Tree 0.67 0.52 -0.33 K-Nearest Neighbor (KNN) 0.67 0.46 -0.39 Logistic Regression 0.76 0.61 0.03
  • 11.
    CONCLUSION The purpose ofthis study is to predict a model for the severity of road accidents. Such a model can be adapted with any road traffic network anywhere in the world. The accuracy of this model is very good. It has 82% accuracy. Therefore, based on this modeling, we can help the organizations that are involved in road accidents such as: • Emergency services • Traffic center, • Insurance and public transport