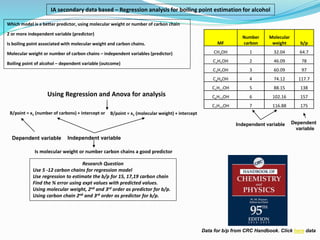
IA data based, boiling point prediction for alcohol using molecular weight and carbon chain model.
•
0 likes•43 views

This document describes using regression analysis to determine whether molecular weight or number of carbon chains is a better predictor of boiling point for alcohols. It uses data on boiling points of alcohols from methanol to octanol to build 2nd and 3rd order regression models with molecular weight and carbon chains as predictors. The models are used to predict boiling points for higher alcohols to calculate percentage errors. The analysis finds that the 2nd order carbon chain model has the lowest percentage errors, indicating number of carbon chains is a better predictor of boiling point than molecular weight.

Recommended
More Related Content
Similar to IA data based, boiling point prediction for alcohol using molecular weight and carbon chain model.
Similar to IA data based, boiling point prediction for alcohol using molecular weight and carbon chain model. (20)
More from Lawrence kok
More from Lawrence kok (20)
Recently uploaded
Recently uploaded (20)
IA data based, boiling point prediction for alcohol using molecular weight and carbon chain model.
- 1. Which model is a better predictor, using molecular weight or number of carbon chain 2 or more independent variable (predictor) Is boiling point associated with molecular weight and carbon chains. Molecular weight or number of carbon chains – independent variables (predictor) Boiling point of alcohol – dependent variable (outcome) Using Regression and Anova for analysis Independent variable Dependent variable Is molecular weight or number carbon chains a good predictor Independent variable Dependent variable Data for b/p from CRC Handbook. Click here data IA secondary data based – Regression analysis for boiling point estimation for alcohol B/point = x1 (molecular weight) + intercept B/point = x1 (number of carbons) + intercept or Research Question Use 5 -12 carbon chains for regression model Use regression to estimate the b/p for 15, 17,19 carbon chain Find the % error using expt values with predicted values. Using molecular weight, 2nd and 3rd order as predictor for b/p. Using carbon chain 2nd and 3rd order as predictor for b/p. MF Number carbon Molecular weight b/p CH3OH 1 32.04 64.7 C2H5OH 2 46.09 78 C3H7OH 3 60.09 97 C4H9OH 4 74.12 117.7 C5H11OH 5 88.15 138 C6H13OH 6 102.16 157 C7H15OH 7 116.88 175
- 2. Homologous Series Class Functional Suffix Example Formula Alcohol Hydroxyl - ol methanol CnH2n+1OH • member differ by CH2 gp • same functional group • similar chemical properties • chemical formula CnH2n+1OH • end with ol Number carbon IUPAC name Structure formula b/p 1 Methanol CH3OH 64.7 2 Ethanol CH3CH2OH 78 3 Propanol CH3CH2CH2OH 97 4 Butanol CH3(CH2)2CH2OH 117.7 5 Pentanol CH3(CH2)3CH2OH 138 methanol ethanol propanol butanol H ׀ H - C – OH ׀ H H H ׀ ׀ H - C – C – OH ׀ ׀ H H H H H ׀ ׀ ׀ H - C – C – C – OH ׀ ׀ ׀ H H H H H H H ׀ ׀ ׀ ׀ H - C – C – C – C – OH ׀ ׀ ׀ ׀ H H H H Hydrocarbon skeleton Functional gp b/p increase ↑ Physical properties • Increase RMM / molecular size •RMM increase ↑ - Van Der Waals forces stronger ↑ ↓ boiling point increases ↑ (Increasing polarisability ↑) London dispersion forces/temporary dipole ↑ Number carbon Molecular weight b/p 1 32.04 64.7 2 46.09 78 3 60.09 97 4 74.12 117.7 5 88.15 138 6 102.16 157 7 116.88 175 8 130.23 195 9 144.26 214 10 158.28 230 11 172.31 243 12 186.34 260 14 214.39 289 15 228.41 299 17 256.5 308 19 284.5 345 Boiling point for diff alcohol boiling point increase with increase carbon atoms
- 3. IA secondary data based –Regression analysis for b/p estimation for alcohol Molecular weight 2nd, 3rd order as predictor for b/p Carbon chain, 2nd, 3rd order as predictor for b/p Number carbon Molecular weight b/p predict poly fit 3rd order predict poly fit 2nd order 1 32.04 64.7 2 46.09 78 3 60.09 97 4 74.12 117.7 5 88.15 138 6 102.16 157 7 116.88 175 8 130.23 195 9 144.26 214 10 158.28 230 11 172.31 243 12 186.34 260 14 214.39 289 15 228.41 299 17 256.5 308 19 284.5 345 Number carbon Molecular weight b/p predict poly fit 3rd order predict poly fit 2nd order 1 32.04 64.7 2 46.09 78 3 60.09 97 4 74.12 117.7 5 88.15 138 6 102.16 157 7 116.88 175 8 130.23 195 9 144.26 214 10 158.28 230 11 172.31 243 12 186.34 260 14 214.39 289 15 228.41 299 17 256.5 308 19 284.5 345 Research Question Use 5 -12 carbon chains for regression model Use regression to predict b/p for 15, 17, 19 carbon chain Find the % error using expt values with predicted values. Using molecular weight, 2nd and 3rd order as predictor for b/p. Using carbon chain 2nd and 3rd order as predictor for b/p.
- 4. Predicted b/p for carbon 19 – MW of 284.5 3rd order fit, y = -0.00002x3 + 0.007x2 + 0.6284x + 43.5 b/p= -0.00002(284.5)3 + 0.007(284.5)2 + 0.6284(284.5) + 43.5 = 328 Predicted b/p for carbon 17 – MW of 256.5 3rd order fit, y = -0.00002x3 + 0.007x2 + 0.6284x + 43.5 b/p= -0.00002(256.5)3 + 0.007(256.5)2 + 0.6284(256.5) + 43.5 = 328 Predicted b/p for carbon 19 – MW of 284.5 2nd order fit, y = -0.0021x2 + 1.837x – 8.095 b/p= -0.0021(256.5)2 + 1.837(256.5) – 8.095 = 344 Predicted b/p for carbon 17 – MW of 256.5 2nd order fit, y = -0.0021x2 + 1.837x – 8.095 b/p= -0.0021(256.5)2 + 1.837(256.5) – 8.095 = 324 Predicted b/p for carbon 15 – MW of 228.4 2nd order fit, y = -0.0021x2 + 1.837x – 8.095 b/p= -0.0021(228.4)2 + 1.837(228.4) – 8.095 = 301 Predicted b/p for carbon 15 – MW of 228.4 3rd order fit, y = -0.00002x3 + 0.007x2 + 0.6284x + 43.5 b/p= -0.00002(228.4)3 + 0.007(228.4)2 + 0.6284(228.4) + 43.5 = 313 Research Question Which model, molecular weight model, 2nd , 3rd order, better predictor for b/p. Which model, carbon chain model, 2nd, 3rd order, better predictor for b/p. Molecular weight 3rd order as predictor for b/p y = -2E-05x3 + 0.007x2 + 0.6284x + 43.501 R² = 0.9991 0 50 100 150 200 250 300 0 50 100 150 200 b/p molecular weight molecular weight vs b/p Molecular weight 2nd order as predictor for b/p y = -0.0021x2 + 1.8371x - 8.0951 R² = 0.999 0 50 100 150 200 250 300 0 50 100 150 200 b/p molecular weight molecular weight vs b/p
- 5. Predicted b/p for carbon 19 2nd order fit, y = -0.44x2 + 24.96x + 23.44 b/p= -0.44(19)2 + 24.96(19) + 23.44 = 339 Predicted b/p for carbon 17 2nd order fit, y = -0.44x2 + 24.96x + 23.44 b/p= -0.44(17)2 + 24.96(17) + 23.44 = 320 Predicted b/p for carbon 15 2nd order fit, y = -0.44x2 + 24.96x + 23.44 b/p= -0.44(15)2 + 24.96(15) + 23.44 = 298 Predicted b/p for carbon 19 3rd order fit, y = -0.0455x3 + 0.718x2 + 15.53x + 47.78 b/p= -0.0455(19)3 + 0.718(19)2 + 15.53(19) + 47.78 = 290 Predicted b/p for carbon 17 3rd order fit, y = -0.0455x3 + 0.718x2 + 15.53x + 47.78 b/p= -0.0455(17)3 + 0.718(17)2 + 15.53(17) + 47.78 = 296 Predicted b/p for carbon 15 3rd order fit, y = -0.0455x3 + 0.718x2 + 15.53x + 47.78 b/p= -0.0455(15)3 + 0.718(15)2 + 15.53(15) + 47.78 = 289 Research Question Which model, molecular weight model, 2nd , 3rd order, better predictor for b/p. Which model, carbon chain model, 2nd, 3rd order, better predictor for b/p. Carbon chain 3rd order as predictor for b/p y = -0.0455x3 + 0.7186x2 + 15.532x + 47.781 R² = 0.9993 0 50 100 150 200 250 300 0 2 4 6 8 10 12 14 b/p carbon chain carbon chain vs b/p y = -0.4405x2 + 24.964x + 23.44 R² = 0.9992 0 50 100 150 200 250 300 0 2 4 6 8 10 12 14 b/p carbon chain carbon chain vs b/p Carbon chain 2nd order as predictor for b/p
- 6. IA secondary data based –Regression analysis for b/p estimation for alcohol Molecular weight 2nd, 3rd order as predictor for b/p Carbon chain, 2nd, 3rd order as predictor for b/p Number carbon Molecular weight b/p predict poly fit 3rd order (% error) predict poly fit 2nd order (% error) 1 32.04 64.7 2 46.09 78 3 60.09 97 4 74.12 117.7 5 88.15 138 6 102.16 157 7 116.88 175 8 130.23 195 9 144.26 214 10 158.28 230 11 172.31 243 12 186.34 260 14 214.39 289 15 228.41 299 313 (5%) 301 (0.6%) 17 256.5 308 328 (6.5%) 324 (5%) 19 284.5 345 328 (5%) 344 (0.2%) Number carbon Molecular weight b/p predict poly fit 3rd order (% error) predict poly fit 2nd order (% error) 1 32.04 64.7 2 46.09 78 3 60.09 97 4 74.12 117.7 5 88.15 138 6 102.16 157 7 116.88 175 8 130.23 195 9 144.26 214 10 158.28 230 11 172.31 243 12 186.34 260 14 214.39 289 15 228.41 299 289 (3.3%) 298 (0.3%) 17 256.5 308 296 (4%) 320 (4%) 19 284.5 345 290 (16%) 339 (2%) % error = (𝑬𝒙𝒑𝒕 𝒗𝒂𝒍𝒖𝒆 −𝑷𝒓𝒆𝒅𝒊𝒄𝒕𝒆𝒅 𝒗𝒂𝒍𝒖𝒆) 𝑬𝒙𝒑𝒕 𝒗𝒂𝒍𝒖𝒆 x 100% % error = (𝟐𝟗𝟗 −𝟑𝟏𝟑) 𝟐𝟗𝟗 x 100% = 5% % error = (𝑬𝒙𝒑𝒕 𝒗𝒂𝒍𝒖𝒆 −𝑷𝒓𝒆𝒅𝒊𝒄𝒕𝒆𝒅 𝒗𝒂𝒍𝒖𝒆) 𝑬𝒙𝒑𝒕 𝒗𝒂𝒍𝒖𝒆 x 100% % error = (𝟐𝟗𝟗 −𝟐𝟖𝟗) 𝟐𝟗𝟗 x 100% = 3.3% Research Question Use 5 -12 carbon chains for regression model Use regression to predict b/p for 15, 17, 19 carbon chain Find the % error using expt values with predicted values. Using molecular weight, 2nd and 3rd order as predictor for b/p. Using carbon chain 2nd and 3rd order as predictor for b/p.
- 7. carbon chain 2nd order model is a better fit Research Question Use regression to predict b/p for carbon 15, 17, 19 based on molecular weight. Which model, molecular weight model, better predictor for b/p. Which model, carbon chain model, better predictor for b/p. molecular weight 2nd order model is a better fit % error 2nd order, smaller compared to 3rd order model 2nd order fit – % error changes from 0.6% to 5% to 0.2% as carbon chain changes from 15 to 17 to 19. % error 2nd order smaller compared to 3rd order model. 2nd order fit – % error changes from 0.3% to 4% to 2% as carbon chain changes from 15 to 17 to 19. y = -0.4405x2 + 24.964x + 23.44 R² = 0.9992 0 50 100 150 200 250 300 0 2 4 6 8 10 12 14 b/p carbon chain carbon chain vs b/p y = -0.0021x2 + 1.8371x - 8.0951 R² = 0.999 0 50 100 150 200 250 300 0 50 100 150 200 b/p molecular weight molecular weight vs b/p Number carbon Molecular weight b/p predict poly fit 3rd order (% error) predict poly fit 2nd order (% error) 15 228.41 299 313 (5%) 301 (0.6%) 17 256.5 308 328 (6.5%) 324 (5%) 19 284.5 345 328 (5%) 344 (0.2%) Number carbon Molecular weight b/p predict poly fit 3rd order (% error) predict poly fit 2nd order (% error) 15 228.41 299 289 (3.3%) 298 (0.3%) 17 256.5 308 296 (4%) 320 (4%) 19 284.5 345 290 (16%) 339 (2%) molecular weight 2nd order model is a better fit carbon chain 2nd order model is a better fit
- 8. carbon chain 2nd order model is a weaker fit Research Question Which model, molecular weight or carbon chain model, a better predictor for b/p. molecular weight 2nd order model is a better fit % error 2nd order molecular weight model, smaller compared to carbon chain model. 2nd order fit – % error changes from 0.6% to 5% to 0.2% as carbon chain changes from 15 to 17 to 19. % error 2nd order carbon chain model higher compared to molecular weight model. 2nd order fit – % error changes from 0.3% to 4% to 2% as carbon chain changes from 15 to 17 to 19. y = -0.4405x2 + 24.964x + 23.44 R² = 0.9992 0 50 100 150 200 250 300 0 2 4 6 8 10 12 14 b/p carbon chain carbon chain vs b/p y = -0.0021x2 + 1.8371x - 8.0951 R² = 0.999 0 50 100 150 200 250 300 0 50 100 150 200 b/p molecular weight molecular weight vs b/p Number carbon Molecular weight b/p predict poly fit 3rd order (% error) predict poly fit 2nd order (% error) 15 228.41 299 313 (5%) 301 (0.6%) 17 256.5 308 328 (6.5%) 324 (5%) 19 284.5 345 328 (5%) 344 (0.2%) Number carbon Molecular weight b/p predict poly fit 3rd order (% error) predict poly fit 2nd order (% error) 15 228.41 299 289 (3.3%) 298 (0.3%) 17 256.5 308 296 (4%) 320 (4%) 19 284.5 345 290 (16%) 339 (2%) molecular weight 2nd order model is a better fit carbon chain 2nd order model is a weaker fit