1. 20.1 The Transition Metals: A
Survey
20.2 The First-Row Transition
Metals
20.3 Coordination Compounds
20.4 Isomerism
20.5 Bonding in Complex Ions:
The Localized Electron Model
20.6 The Crystal Field Model
20.7 The Molecular Orbital Model
20.8 The Biological Importance of
Coordination Complexes
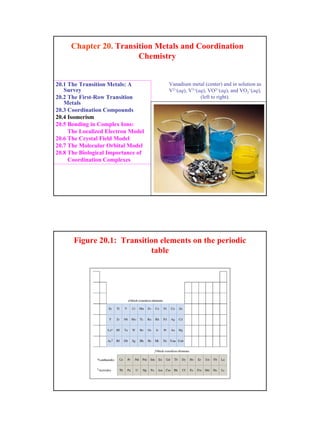
Chapter 20. Transition Metals and Coordination
Chemistry
Vanadium metal (center) and in solution as
V2+(aq), V3+(aq), VO2+(aq), and VO2
+(aq),
(left to right).
Figure 20.1: Transition elements on the periodic
table
2. 20.5 Bonding in Complex Ions: The Localized Electron Model
Recall formation of hybrid orbitals for bonding in molecules (chapt. 14).
Formation of coordinate covalent bonds between a metal ion and a ligand (L) is
through a Lewis acid-base interaction.
M L = M L
empty metal ion hybrid
atomic orbital
lone pair on the ligand in
a hybrid atomic orbital
Co3+ is d2sp3 hybridized in the
complex ion Co(NH3)6
3+
Figure 20.19: Set of six d2sp3
hybrid orbitals on Co3+.
Figure 20.20: Hybrid orbitals required
for tetrahedral, square planar, and linear complex ions.
• Co2+ is sp3 hybridized in tetrahedral CoCl4
2-
complex ion.
• Ni2+ is dsp2 hybridized in the square planar
Ni(CN)4
2- complex ion.
• Ag+ is sp hybridized in the linear Ag(NH3)2
+
ion.
3. Bonding in Complex metal ions
• Limitations of the LE Model of Bonding in complex metal ions:
1. The VSEPR model for predicting structure does not work
for complex ions.
2. The LE model cannot predict the properties of the metal
complex ion, e.g. magnetism and color.
• Magnetic properties and colors
– the crystal field model based on d-orbital splitting
20.6 The Crystal Field Model
• Accounts for the color and magnetic properties of complex ions
• Key assumptions:
1. ligands are approximated by negative point charges.
2. metal – ligand bonding is entirely ionic.
Octahedral Complexes
(See Figure 20.21)
• Orientation of the 3d orbitals relative to the point-charge ligands leads to
splitting of the 3d orbital energies (Δ)
• t2g set of orbitals (dxz, dyz, dxy) – lower in energy
• eg set of orbitals (dz
2 , dx
2
-y
2 ) – higher in energy
Strong-field case
eg
t2g
large
Δ
E
Weak-field case
eg
t2g
small
Δ
E
4. Figure 20.21: Octahedral arrangement of point-charge
ligands and the orientation of the 3d orbitals.
Figure 20.22: Energies of the 3d orbitals
for a metal ion in an octahedral complex.
5. Figure 20.23: possible electron arrangements in the split 3d orbitals of an
octahedral complex of Co3+
• In a strong-field case (i.e. large Δ), the electrons of the metal ion pair in
the lower-energy t2g orbitals.
• In a weak-field case (i.e. small Δ), the electrons will occupy all five
orbitals before pairing occurs.
Example 20.4
Fe(CN)6
3- experimentally known to have one unpaired electron. Does the
CN- ligand produce a strong or weak field?
Fe3+ has 3d5 electron configuration
weak-field (high-spin) case
eg
t2g
small
Δ
strong-field (low-spin) case
eg
t2g
large
Δ
• CN- is a strong-field ligand toward the Fe3+ ion.
• Spectrochemical series of ligands:
CN- > NO2
- > en > NH3 > H2O > OH- > F- > Cl- > Br- > I-
strong-field ligands
(large Δ)
weak-field ligands
(small Δ)
decreasing Δ values for a given metal ion
6. • The magnitude of Δ for a given ligand increases as the charge on the metal
ion increases.
Example
Account for the magnetic properties of Co(NH3)6
3+ and CoF6
3-
Co3+ with 3d5 electron configuration in both cases.
Co(NH3)6
3+
diamagnetic
eg
t2g
large
Δ
CoF6
3-
paramagnetic
eg
t2g
low
Δ
experimentally observed.
Origin of Color in Complex metal ions
• The same d orbital energy splitting explains the colors of complex ions.
eg
t2g
E
ΔE = hc/λ= 1240 (eV)/ λ(nm)
if λ = wavelength of light absorbed is in the visible
• The visible spectrum (Figure 20.24)
400 700 nm
ΔE = 3.1 eV 1.8 eV
If ΔE < 1.8 eV, the wavelength of the
light absorbed will be in the infrared and
not visible.
eg
t2g
E
Δ
Octahedral complexes of Cr3+
3d3
7. Figure 20.24: Visible spectrum
Figure 20.26: The complex ion Ti(H2O)6
3+ absorbs light and
becomes excited.
8. Complexes with Other Coordination Geometries
– Octahedral complexes (already considered)
– Tetrahedral complexes
– Square planar complexes
– Linear complexes
all tetrahedral complexes produce the weak-field case.
e.g. CoCl4
2-, 3d7 (Example 20.6)
For the crystal field diagrams of square planar and linear complexes
See Figure 20.29
eg
t2g
Δ
E
dxy dxz dyz
dz2 dz2-y2
For a given ligand and metal ion:
Δtet = 4/9 Δoct
Figure 20.27: Tetrahedral and octahedral arrangements of
ligands shown inscribed in cubes.
9. Figure 20.28: Crystal field diagrams for octahedral and
tetrahedral complexes
Figure 20.29: Crystal field diagram for a square planar complex oriented
in the xy plane (b) crystal field diagram for a linear complex
10. Complex metal ions
• Bonding in complex metal ions
– the localized electron model is used but it has major limitations:
1. The VSEPR model for predicting structure does not work well for
complex ions.
2. The LE model cannot predict the properties of the metal complex
ion, e.g. magnetism and color.
• Magnetic properties and colors
– the crystal field model based on d-orbital splitting
The Molecular Orbital Model of Complex Metal Ions
•Consider the general octahedral complex with formula ML6
n+.
– dz
2 and dx
2
-y
2 orbitals point at the ligands and thus will
form MOs with the ligand lone pair orbitals
• the σMOs in the complex ion involve dz
2 , dx
2
-y
2 , 4s, 4px,
4py, and 4pz orbitals
– dxy, dxz, and dyz orbitals are not involved in σ bonding
with the ligands
Figure 20.30
Figure 20.31: The MO energy-
level diagram for an octahedral
complex ion (ML6
n+).
• the dxz, dyz and dxy orbitals ( the t2g set) of
the metal ion remain unchanged in the
complex ion since they do not overlap
with the ligand orbitals
– they are nonbonding orbitals.
• the eg
* MOs are antibonding orbitals
(since they are higher in energy than the
atomic orbitals that mix to form them)
– the eg
* MOs are composed of dz
2 and
dx
2
-y
2 atomic orbitals primarily (little
or no mixing with ligand atomic
orbitals due to the large energy
difference btw them)
• the MO model has the same d orbital
splitting as the crystal field model.
ML6
n+
11. Figure 20.32: MO energy-level diagram for CoF6
3-, which yields
the high-spin (a) whereas Co(NH3)6
3+ yields low-spin (b).
the MO model accounts for the magnetic and spectral properties of
complex ions (just like the crystal field model).
• the MO model is a more realistic description of the metal-ligand bonding in
complex ions.
20.8 The Biological Importance of Coordination Complexes
of Metal Ions
• In biological systems, metal ion complexes find diverse applications
– transport and storage of oxygen and other essential elements
– electron transfer agents
– catalysts (enzymes)
– drugs
– etc.
12. Figure 20.33: The heme
complex in which an Fe2+ ion
is coordinated to four
nitrogen atoms of a planar
porphyrin ligand.
Figure 20.34: Chlorophyll is a porphyrin complex of Mg2+,
essential to photosynthesis.
13. Figure 20.35: Representation of the myoglobin molecule
Figure 20.36: Representation of the hemoglobin structure.
Each hemoglobin stores 4 oxygen (O2) molecules.