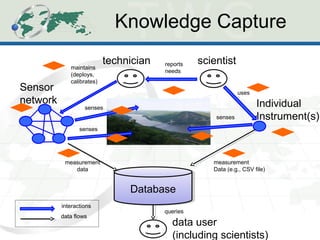
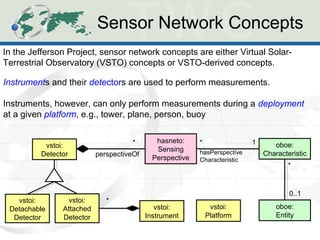
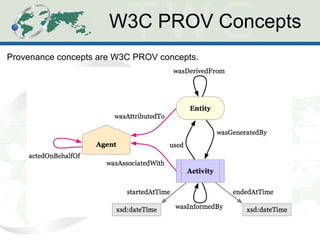
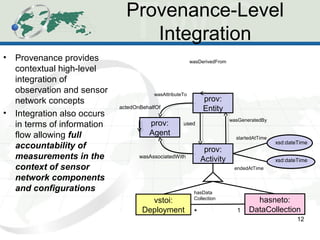
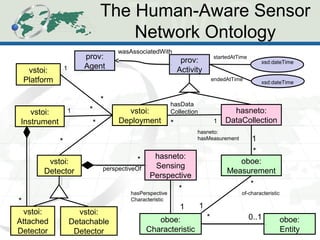
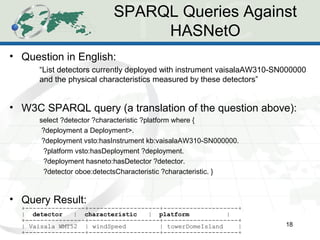
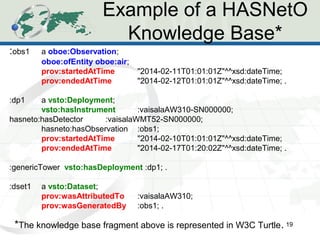
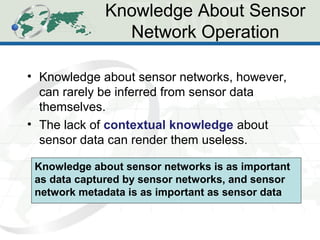
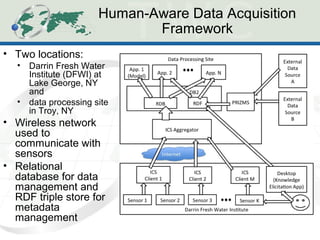
The document describes the Human-Aware Sensor Network Ontology (HASNetO), which provides semantic support for capturing contextual knowledge about empirical data collected by sensor networks. HASNetO integrates concepts from existing ontologies related to observations, sensors, and provenance to comprehensively describe sensor network measurements and associated contextual knowledge. This includes knowledge about sensor deployments, configurations, and data usage that is important but often not captured in sensor data alone. HASNetO is being developed and tested on data from two environmental monitoring sites.
Distributed Near Real-Time Processing of Sensor Network Data Flows for Smart ...Otávio Carvalho
Work presented in partial fulfillment
of the requirements for the degree of
Bachelor in Computer Science - Federal University of Rio Grande do - Brazil
A Practical Guide to Anomaly Detection for DevOpsBigPanda
Recent years have seen an explosion in the volumes of data that modern production environments generate. Making fast educated decisions about production incidents is more challenging than ever. BigPanda's team is passionate about solutions such as anomaly detection that tackle this very challenge.
Five Things I Learned While Building Anomaly Detection Tools - Toufic Boubez ...tboubez
This is my presentation from LISA 2014 in Seattle on November 14, 2014.
Most IT Ops teams only keep an eye on a small fraction of the metrics they collect because analyzing this haystack of data and extracting signal from the noise is not easy and generates too many false positives.
In this talk I will show some of the types of anomalies commonly found in dynamic data center environments and discuss the top 5 things I learned while building algorithms to find them. You will see how various Gaussian based techniques work (and why they don’t!), and we will go into some non-parametric methods that you can use to great advantage.
INC 2004: An Efficient Mechanism for Adaptive Resource Discovery in GridsJames Salter
Presented at the Fourth International Network Conference (INC 2004), Plymouth, UK, 6 July 2004. [Winner of Best Paper Award]
Abstract: Computational Grids are designed to bring together collections of resources distributed among diverse physical locations, allowing an individual to exploit a huge amount of computing power, specialist instruments and vast databases. It is essential that an effective method of resource discovery is available for users and software agents to find the resources they require. We present an initial model for resource discovery in Grid environments, designed to remove the need for broadcast of updates and queries across the network. We compare our system with several others in terms of the number of messages needed to query for resources and the ability to guarantee to find matching resources if they exist anywhere in the network.
Plenary talk at the international Synchrotron Radiation Instrumentation conference in Taiwan, on work with great colleagues Ben Blaiszik, Ryan Chard, Logan Ward, and others.
Rapidly growing data volumes at light sources demand increasingly automated data collection, distribution, and analysis processes, in order to enable new scientific discoveries while not overwhelming finite human capabilities. I present here three projects that use cloud-hosted data automation and enrichment services, institutional computing resources, and high- performance computing facilities to provide cost-effective, scalable, and reliable implementations of such processes. In the first, Globus cloud-hosted data automation services are used to implement data capture, distribution, and analysis workflows for Advanced Photon Source and Advanced Light Source beamlines, leveraging institutional storage and computing. In the second, such services are combined with cloud-hosted data indexing and institutional storage to create a collaborative data publication, indexing, and discovery service, the Materials Data Facility (MDF), built to support a host of informatics applications in materials science. The third integrates components of the previous two projects with machine learning capabilities provided by the Data and Learning Hub for science (DLHub) to enable on-demand access to machine learning models from light source data capture and analysis workflows, and provides simplified interfaces to train new models on data from sources such as MDF on leadership scale computing resources. I draw conclusions about best practices for building next-generation data automation systems for future light sources.
This talk describes the general architecture common to anomaly detections systems that are based on probabilistic models. By examining several realistic use cases, I illustrate the common themes and practical implementation methods.
Streaming data presents new challenges for statistics and machine learning on extremely large data sets. Tools such as Apache Storm, a stream processing framework, can power range of data analytics but lack advanced statistical capabilities. These slides are from the Apache.con talk, which discussed developing streaming algorithms with the flexibility of both Storm and R, a statistical programming language.
At the talk I dicsussed issues of why and how to use Storm and R to develop streaming algorithms; in particular I focused on:
• Streaming algorithms
• Online machine learning algorithms
• Use cases showing how to process hundreds of millions of events a day in (near) real time
See: https://apacheconna2015.sched.org/event/09f5a1cc372860b008bce09e15a034c4#.VUf7wxOUd5o
Big Data Visualization
Kwan-Liu Ma
Professor of Computer Science and Chair of the Graduate Group in Computer Science (GGCS) at the University of California-Davis
January 22nd 2014
We are entering a data-rich era. Advanced computing, imaging, and sensing technologies enable scientists to study natural and physical phenomena at unprecedented precision, resulting in an explosive growth of data. The size of the collected information about the Web and mobile device users is expected to be even greater. To make sense and maximize utilization of such vast amounts of data for knowledge discovery and decision making, we need a new set of tools beyond conventional data mining and statistical analysis. One such a tool is visualization. I will present visualizations designed for gleaning insight from massive data and guiding complex data analysis tasks. I will show case studies using data from cyber/homeland security, large-scale scientific simulations, medicine, and sociological studies.
Big Data Visualization Meetup - South Bay
http://www.meetup.com/Big-Data-Visualisation-South-Bay/
A Deep Learning use case for water end use detection by Roberto Díaz and José...Big Data Spain
Deep Learning (DL) is a major breakthrough in artificial intelligence with a high potential for predictive applications.
https://www.bigdataspain.org/2017/talk/a-deep-learning-use-case-for-water-end-use-detection
Big Data Spain 2017
November 16th - 17th Kinépolis Madrid
Presented at The 6th Workshop on Semantics for Smarter Cities (S4SC 2015) co-located with The 14th International Semantic Web Conference (ISWC 2015).
Full paper at: http://tw.rpi.edu/web/doc/santos-s4sc-2015
VOLT: A Provenance-Producing, Transparent SPARQL Proxy for the On-Demand Computation of Linked Data & its Applications to Spatiotemporally Dependent Data
ESWC 2016 Tutorial on RDF Benchmarks
(This project has received funding from the European Union’s Horizon 2020 research and innovation programme under grant agreement No 688227.)
RMLEditor: A Graph-based Mapping Editor for Linked Data MappingsPieter Heyvaert
Although several tools have been implemented to generate
Linked Data from raw data, users still need to be aware of the underlying technologies and Linked Data principles to use them. Mapping languages enable to detach the mapping definitions from the implementation that executes them. However, no thorough research has been conducted on
how to facilitate the editing of mappings. We propose the RMLEditor, a visual graph-based user interface, which allows users to easily define the mappings that deliver the RDF representation of the corresponding raw data. Neither knowledge of the underlying mapping language nor the
used technologies is required. The RMLEditor aims to facilitate the editing of mappings, and thereby lowers the barriers to create Linked Data. The RMLEditor is developed for use by data specialists who are partners of (i) a companies-driven pilot and (ii) a community group. The current version of the RMLEditor was validated: participants indicate that it is adequate for its purpose and the graph-based approach enables users to
conceive the linked nature of the data.
TEDx Navesink 2015: to be AND not to be - Quantum IntelligenceLora Aroyo
Lora Aroyo and Chris Welty propose a radical new approach to modeling human behavior for the next generation of PDAs: Use quantum math instead of probability theory. It makes sense. Watch the video here: https://www.youtube.com/watch?v=CyAI_lVUdzM
Crowds & Niches Teaching Machines to Diagnose: NLeSC Kick off eHumanities pr...Lora Aroyo
This presentation was given at the NL eSchience Center during the "De Geest Uit De Fles" event for the kick off of eHumanities project in 2014:
http://esciencecenter.nl/agenda/703-26-may-de-geest-uit-de-fles/
Semantically-Enabling the Web of Things: The W3C Semantic Sensor Network Onto...Laurent Lefort
Presentation of the SSN XG results at eResearch Australia 2011 https://eresearchau.files.wordpress.com/2012/06/74-semantically-enabling-the-web-of-things-the-w3c-semantic-sensor-network-ontology.pdf
1 Object tracking using sensor network Orla SahiSilvaGraf83
1
Object tracking using sensor network
Orla Sahithi Reddy, email:[email protected]
Abstract—With the help of sensor networks we can keep
track on the events using low and tiny powered devices.
In the paper, we are going to analyze and compare
multiple object tracking methods. Instead of using a
single sensor we use multiple sensors and space them, so
it gives us information. Wireless sensor networks has
node with sensor capabilities and place in object
proximity for detecting them. Sensor networks are
applicable in many fields. Depending on the object
tracking in sensor network ranging from defense and
military applications to earth sciences and
environmental, habitat monitoring, traffic monitoring,
surveillance and military reconnaissance and cross-
border which involves habitat monitoring, infiltration
and other commercial applications.
Index Terms—energy efficient object tracking, object
tracking, quality of tracking, wireless sensor networks,
multi target tracking, routing
I. INTRODUCTION
We Need to have a gathering of frameworks which
cooperate to follow an item rather than a solitary
sensor. Due to this strength, ability and productivity of
the arrangement. Various sensors mitigate the issue of
single purpose of disappointment. A Single costly
sensor expands the danger of disappointment over the
zone of intrigue. Every sensor hub has a sensor ready,
a processor and a remote handset. Normally, a
following application research can be ordered in two
different ways. In recent years, Wireless sensor
network is one of the rapidly growing area[1]. To
begin with, the issue of precisely evaluating the area
of article and second being in organize information
preparing and information conglomeration model for
following item. Article can be situated out commonly
by two activities; by update from the sensors or
questioning the sensor for information to find the item.
Checking of articles would require less time than
following of new item.
Regularly, a remote sensor organize comprises of
enormous number of sensor hubs and is wanted to find
an item in the sensor arrange by playing out a routine
occasionally. This included following the article and
assembling data.
This is a term paper submitted for course requirement fulfillment of
“Advanced Wireless Networks”.
Sahithi Reddy Orla is current student in Wright State University
Computer Science and Engineering Department, Fairborn, OH
45324, USA (e-mail: [email protected], UID: U00916256).
We have to have a particular calculation to process or
track the area of the article with the assistance of
information There are different sorts of item following
strategies which can be looked at and broke down. In
remote sensor systems we have sensor hubs to find an
item in the system. This procedure is done
occasionally including gathering information from
sensor hubs.
There are two sign ...
Standard Provenance Reporting and Scientific Software Management in Virtual L...njcar
The Virtual Hazards Impact & Risk Laboratory (VHIRL) is a scientific workflow portal that provides researchers with access to a cloud computing environment for natural hazards eResearch tools. It allows researchers to construct experiments with data from a variety of sources and execute cloud computing processes for rapid and remote simulation and analysis. The service currently includes tools for the simulation of three major hazards affecting the Asia-Pacific region: earthquakes, tsunamis and tropical cyclones.
For scientific results, the establishment of provenance is key to reproducibility and trust. Thus the need for any virtual laboratory to provide provenance information for the tasks it manages is obvious, but the appropriate way to report and manage provenance information is not always so straightforward. Many virtual laboratories and workflow systems provide bespoke provenance management with a focus on internal system use. This has clear benefits for reproducibility within the system, but it limits the interoperability of systems. For VHIRL, a provenance solution was required that was as
interoperable with other, external, provenance systems as possible.
A related common issue facing workflow tools and virtual laboratories is the need to manage software code. With this comes well-known issues associated with code sharing: licensing, source code management, version management and dependency resolution. There are a wide selection of commonly used tools to help solve these problems, for example Git and Subversion.
A key goal of VHIRL was to externalise as much information management as was reasonable. VHIRL is a virtual laboratory: it is not designed to be a data store, software repository, or records management system. A solution was required that could hand off the management of provenance records and code to external services, with links between them, other data services and VHIRL jobs where appropriate.
Scientific software can be quite complicated and systems for managing dependencies and source vary from system to system. In order to provide the least friction for authors of software, we designed a system called the Scientific Software Solution Centre (SSSC) to manage solutions to scientific problems and deliver the solution templates, code and dependencies that enable them for use in VHIRL and other Virtual Laboratories and applications.
Real-Time Simulation for MBSE of Synchrophasor SystemsLuigi Vanfretti
This talk starts by exploring how electrical power systems are increasingly becoming digitalized, leading to their transformation into a class of cyber-physical systems (a system of systems) where the electrical grid merges with ubiquitous information and communication technologies (ICT).
This type of complex systems present unprecedented challenges in their operation and control, and due to unknown interactions with ICT, require new concepts, methods and tools to facilitate their operational design, manufacturing (of components), and testing/verification/validation of their performance.
Inspired by the tremendous advantages of the model-based system engineering (MBSE) framework developed by the aerospace and military communities, this talk will highlight the challenges to adopt MBSE for electrical power grids. MBSE is not only a framework to deal with all the phases of putting in place complex systems-of-systems, but also provides a foundation for the democratization of technology - both software and hardware.
The talk will illustrate the foundations that have been built by the presenter's research over the last 7 years, placed within the context of MBSE, with focus on areas of power engineering. Some of these foundations and contributions include the OpenIPSL, RaPId, SD3K, BableFish and Khorjin open source software developed and distributed online by the research group, and available at: https://github.com/ALSETLab
Using the Open Science Data Cloud for Data Science ResearchRobert Grossman
The Open Science Data Cloud is a petabyte scale science cloud for managing, analyzing, and sharing large datasets. We give an overview of the Open Science Data Cloud and how it can be used for data science research.
Making Runtime Data Useful for Incident Diagnosis: An Experience ReportQAware GmbH
QuASD/PROFES 2018, Wolfsburg: Talk by Marcus Ciolkowski (@M_Ciolkowski, Principal IT Consultant at QAware) and Florian Lautenschlager (@flolaut, Senior Software Engineer)
=== Please download slides if blurred! ===
Abstract: Important and critical aspects of technical debt often surface at runtime only and are difficult to measure statically.
This is a particular challenge for cloud applications because of their highly distributed nature.
Fortunately, mature frameworks for collecting runtime data exist but need to be integrated.
In this paper, we report an experience from a project that implements a cloud application within Kubernetes on Azure.
To analyze the runtime data of this software system, we instrumented our services with Zipkin for distributed tracing; with Prometheus and Grafana for analyzing metrics; and with fluentd, Elasticsearch and Kibana for collecting, storing and exploring log files.
However, project team members did not utilize these runtime data until we created a unified and simple access using a chat bot.
We argue that even though your project collects runtime data, this is not sufficient to guarantee its usage: In order to be useful, a simple, unified access to different data sources is required that should be integrated into tools that are commonly used by team members.
Get the research paper: http://bitly.com/2QmSNwl
Gaining insight to Acoustic Measurements through the fusion of multisource datachrismalzone
Presentation & Paper By Chris Malzone and given by Mike Mutschler, RESON. Focuses on the benefits of fusing multiple sources of acoustic data through fusion. Presentation also introduces the concept of fusion as well as looks at a Habitat Mapping Case Study in the US Virgin Islands as analysed via the Eonfusion software.
Efficient and thorough data collection and its timely analysis are critical for disaster response and recovery in order to save people's lives during disasters. However, access to comprehensive data in disaster areas and their quick analysis to transform the data to actionable knowledge are challenging. With the popularity and pervasiveness of mobile devices, crowdsourcing data collection and analysis has emerged as an effective and scalable solution. This paper addresses the problem of crowdsourcing mobile videos for disasters by identifying two unique challenges of 1) prioritizing visual data collection and transmission under bandwidth scarcity caused by damaged communication networks and 2) analyzing the acquired data in a timely manner. We introduce a new crowdsourcing framework for acquiring and analyzing the mobile videos utilizing fine granularity spatial metadata of videos for a rapidly changing disaster situation. We also develop an analytical model to quantify the visual awareness of a video based on its metadata and propose the visual awareness maximization problem for acquiring the most relevant data under bandwidth constraints. The collected videos are evenly distributed to off-site analysts to collectively minimize crowdsourcing efforts for analysis. Our simulation results demonstrate the effectiveness and feasibility of the proposed framework.
Links:
http://infolab.usc.edu/DocsDemos/to_ieeebigdata2015.pdf
http://ieeexplore.ieee.org/xpl/articleDetails.jsp?arnumber=7363814
Asset owners today want to understand how investments made in people, process, or technology are progressing the maturity of their ICS security programs to validate those investments. Whether asset owners are spending one dollar, one million dollars, or one hour of their time, understanding which investments are actually improving the overall ICS security posture and reducing risk is essential to determine where to spend valuable (and sometimes limited) resources.
The NIST Cybersecurity Framework helps asset owners measure security control maturity in both IT and OT domains, and can be useful to help understand whether certain ICS security investments are working or not. This talk will break down all five NIST CSF functions and dive into specific forward thinking use cases used to help jumpstart many of Forescout's industry leading customers.
Similar to Human-Aware Sensor Network Ontology: Semantic Support for Empirical Data Collection (20)
As Europe's leading economic powerhouse and the fourth-largest hashtag#economy globally, Germany stands at the forefront of innovation and industrial might. Renowned for its precision engineering and high-tech sectors, Germany's economic structure is heavily supported by a robust service industry, accounting for approximately 68% of its GDP. This economic clout and strategic geopolitical stance position Germany as a focal point in the global cyber threat landscape.
In the face of escalating global tensions, particularly those emanating from geopolitical disputes with nations like hashtag#Russia and hashtag#China, hashtag#Germany has witnessed a significant uptick in targeted cyber operations. Our analysis indicates a marked increase in hashtag#cyberattack sophistication aimed at critical infrastructure and key industrial sectors. These attacks range from ransomware campaigns to hashtag#AdvancedPersistentThreats (hashtag#APTs), threatening national security and business integrity.
🔑 Key findings include:
🔍 Increased frequency and complexity of cyber threats.
🔍 Escalation of state-sponsored and criminally motivated cyber operations.
🔍 Active dark web exchanges of malicious tools and tactics.
Our comprehensive report delves into these challenges, using a blend of open-source and proprietary data collection techniques. By monitoring activity on critical networks and analyzing attack patterns, our team provides a detailed overview of the threats facing German entities.
This report aims to equip stakeholders across public and private sectors with the knowledge to enhance their defensive strategies, reduce exposure to cyber risks, and reinforce Germany's resilience against cyber threats.
Chatty Kathy - UNC Bootcamp Final Project Presentation - Final Version - 5.23...John Andrews
SlideShare Description for "Chatty Kathy - UNC Bootcamp Final Project Presentation"
Title: Chatty Kathy: Enhancing Physical Activity Among Older Adults
Description:
Discover how Chatty Kathy, an innovative project developed at the UNC Bootcamp, aims to tackle the challenge of low physical activity among older adults. Our AI-driven solution uses peer interaction to boost and sustain exercise levels, significantly improving health outcomes. This presentation covers our problem statement, the rationale behind Chatty Kathy, synthetic data and persona creation, model performance metrics, a visual demonstration of the project, and potential future developments. Join us for an insightful Q&A session to explore the potential of this groundbreaking project.
Project Team: Jay Requarth, Jana Avery, John Andrews, Dr. Dick Davis II, Nee Buntoum, Nam Yeongjin & Mat Nicholas
StarCompliance is a leading firm specializing in the recovery of stolen cryptocurrency. Our comprehensive services are designed to assist individuals and organizations in navigating the complex process of fraud reporting, investigation, and fund recovery. We combine cutting-edge technology with expert legal support to provide a robust solution for victims of crypto theft.
Our Services Include:
Reporting to Tracking Authorities:
We immediately notify all relevant centralized exchanges (CEX), decentralized exchanges (DEX), and wallet providers about the stolen cryptocurrency. This ensures that the stolen assets are flagged as scam transactions, making it impossible for the thief to use them.
Assistance with Filing Police Reports:
We guide you through the process of filing a valid police report. Our support team provides detailed instructions on which police department to contact and helps you complete the necessary paperwork within the critical 72-hour window.
Launching the Refund Process:
Our team of experienced lawyers can initiate lawsuits on your behalf and represent you in various jurisdictions around the world. They work diligently to recover your stolen funds and ensure that justice is served.
At StarCompliance, we understand the urgency and stress involved in dealing with cryptocurrency theft. Our dedicated team works quickly and efficiently to provide you with the support and expertise needed to recover your assets. Trust us to be your partner in navigating the complexities of the crypto world and safeguarding your investments.
Show drafts
volume_up
Empowering the Data Analytics Ecosystem: A Laser Focus on Value
The data analytics ecosystem thrives when every component functions at its peak, unlocking the true potential of data. Here's a laser focus on key areas for an empowered ecosystem:
1. Democratize Access, Not Data:
Granular Access Controls: Provide users with self-service tools tailored to their specific needs, preventing data overload and misuse.
Data Catalogs: Implement robust data catalogs for easy discovery and understanding of available data sources.
2. Foster Collaboration with Clear Roles:
Data Mesh Architecture: Break down data silos by creating a distributed data ownership model with clear ownership and responsibilities.
Collaborative Workspaces: Utilize interactive platforms where data scientists, analysts, and domain experts can work seamlessly together.
3. Leverage Advanced Analytics Strategically:
AI-powered Automation: Automate repetitive tasks like data cleaning and feature engineering, freeing up data talent for higher-level analysis.
Right-Tool Selection: Strategically choose the most effective advanced analytics techniques (e.g., AI, ML) based on specific business problems.
4. Prioritize Data Quality with Automation:
Automated Data Validation: Implement automated data quality checks to identify and rectify errors at the source, minimizing downstream issues.
Data Lineage Tracking: Track the flow of data throughout the ecosystem, ensuring transparency and facilitating root cause analysis for errors.
5. Cultivate a Data-Driven Mindset:
Metrics-Driven Performance Management: Align KPIs and performance metrics with data-driven insights to ensure actionable decision making.
Data Storytelling Workshops: Equip stakeholders with the skills to translate complex data findings into compelling narratives that drive action.
Benefits of a Precise Ecosystem:
Sharpened Focus: Precise access and clear roles ensure everyone works with the most relevant data, maximizing efficiency.
Actionable Insights: Strategic analytics and automated quality checks lead to more reliable and actionable data insights.
Continuous Improvement: Data-driven performance management fosters a culture of learning and continuous improvement.
Sustainable Growth: Empowered by data, organizations can make informed decisions to drive sustainable growth and innovation.
By focusing on these precise actions, organizations can create an empowered data analytics ecosystem that delivers real value by driving data-driven decisions and maximizing the return on their data investment.
Techniques to optimize the pagerank algorithm usually fall in two categories. One is to try reducing the work per iteration, and the other is to try reducing the number of iterations. These goals are often at odds with one another. Skipping computation on vertices which have already converged has the potential to save iteration time. Skipping in-identical vertices, with the same in-links, helps reduce duplicate computations and thus could help reduce iteration time. Road networks often have chains which can be short-circuited before pagerank computation to improve performance. Final ranks of chain nodes can be easily calculated. This could reduce both the iteration time, and the number of iterations. If a graph has no dangling nodes, pagerank of each strongly connected component can be computed in topological order. This could help reduce the iteration time, no. of iterations, and also enable multi-iteration concurrency in pagerank computation. The combination of all of the above methods is the STICD algorithm. [sticd] For dynamic graphs, unchanged components whose ranks are unaffected can be skipped altogether.
【社内勉強会資料_Octo: An Open-Source Generalist Robot Policy】
Human-Aware Sensor Network Ontology: Semantic Support for Empirical Data Collection
1. Human-Aware Sensor Network Ontology
(HASNetO): Semantic Support for Empirical
Data Collection
Paulo Pinheiro1
, Deborah McGuinness1
,
Henrique Santos1,2
1
Rensselaer Polytechnic Institute, USA
2
Universidade de Fortaleza, Brazil
ISWC/LISC, October 2015
2. Outline
• Capturing Contextual Knowledge
• Integration of Empirical Concepts and
Sensor Network Concepts
• Provenance Knowledge support for
Contextual Knowledge
• HASNetO: The Human-Aware Sensor
Network Ontology
• Conclusions
2
6. Full Extent of Contextual
Knowledge Scope
6
time
spaceagentstrust
“typical” measurement scope
7. Selected Observation and
Sensor Network Ontologies
• Sensor Network Knowledge
– Needed to describe the infrastructure of a
sensor network, and the use of sensor
network components in the generation of
datasets
• Observation Knowledge
– Needed to describe observations and their
measurements. Measurements need to be
characterized in terms of physical entities,
entity characteristics, units, and values
8. Observation Concepts
In our measurements, observation concepts are either OBOE concepts or
OBOE-derived concepts.
The thing that one is observing is an entity, e.g.,’air’.
Things that are observed, however,
cannot be measured. For example,
how can one measure ‘air’? A
characteristic is a measurable property
of an entity, e.g., air temperature.
An observation is a collection of
measurements of entity’s
characteristics.
Each measurement has a value, e.g,
’45’, and a standard unit, e.g., ‘Celsius’.
oboe:
Entity
oboe:
Observation
of-entity
11
hasneto:
DataCollection
oboe:
Measurement
oboe:
Standard
oboe:
Characteristic
oboe:
Value
of-characteristic
hasneto:
hasMeasurement
uses-standard
has-characteristic
has-characteristic-value
has-standard-value
has-value
hasneto:
hasContext
11
*
1
1
1
1
1
1
*
*
*
*
*
*
9. Sensor Network Concepts
In the Jefferson Project, sensor network concepts are either Virtual Solar-
Terrestrial Observatory (VSTO) concepts or VSTO-derived concepts.
Instruments and their detectors are used to perform measurements.
Instruments, however, can only perform measurements during a deployment
at a given platform, e.g., tower, plane, person, buoy
vstoi:
Detector
vstoi:
Instrument
vstoi:
Platform
hasneto:
Sensing
Perspective
oboe:
Characteristic
oboe:
Entity
vstoi:
Detachable
Detector
vstoi:
Attached
Detector
* *
*
1
0..1
*
hasPerspective
Characteristic
perspectiveOf
10. Selected Provenance
Ontology
Provenance Knowledge is needed to
contextualize VTSO deployments and
OBOE observations
– “Who deployed an instrument?”
– “When was the instrument deployed?”
– “How many times instrument parameters
changed during deployment?”
– “What was the value of each parameter
during a given observation?”
12. Provenance-Level
Integration
• Provenance provides
contextual high-level
integration of
observation and sensor
network concepts
• Integration also occurs
in terms of information
flow allowing full
accountability of
measurements in the
context of sensor
network components
and configurations
12
prov:
Activity
hasneto:
DataCollection
vstoi:
Deployment
xsd:dateTime
xsd:dateTime
hasData
Collection
1*
prov:
Agent
prov:
Entity
used
wasGeneratedBy
wasAttributeTo
wasAssociatedWith
actedOnBehalfOf
wasDerivedFrom
startedAtTime
endedAtTime
16. Conclusions
• HASNetO was briefly presented along with its support
for describing sensor networks
• OBOE and VSTO provide concepts required for
encoding observation and sensor network metadata
• Neither OBOE and VSTO provide concepts for
describing contextual knowledge about deployments
and observations
16
HASNetO provides a comprehensive integrated
set of concepts for capturing sensor network
measurements along with contextual knowledge
about these measurements
18. SPARQL Queries Against
HASNetO
• Question in English:
“List detectors currently deployed with instrument vaisalaAW310-SN000000
and the physical characteristics measured by these detectors”
• W3C SPARQL query (a translation of the question above):
select ?detector ?characteristic ?platform where {
?deployment a Deployment>.
?deployment vsto:hasInstrument kb:vaisalaAW310-SN000000.
?platform vsto:hasDeployment ?deployment.
?deployment hasneto:hasDetector ?detector.
?detector oboe:detectsCharacteristic ?characteristic. }
• Query Result:
+----------------+-------------------+--------------------+
| detector | characteristic | platform |
+----------------+-------------------+--------------------+
| Vaisala WMT52 | windSpeed | towerDomeIsland |
+----------------+-------------------+--------------------+
18
19. Example of a HASNetO
Knowledge Base*
19
:obs1 a oboe:Observation;
oboe:ofEntity oboe:air;
prov:startedAtTime "2014-02-11T01:01:01Z"^^xsd:dateTime;
prov:endedAtTime "2014-02-12T01:01:01Z"^^xsd:dateTime; .
:dp1 a vsto:Deployment;
vsto:hasInstrument :vaisalaAW310-SN000000;
hasneto:hasDetector :vaisalaWMT52-SN000000;
hasneto:hasObservation :obs1;
prov:startedAtTime "2014-02-10T01:01:01Z"^^xsd:dateTime;
prov:endedAtTime "2014-02-17T01:20:02Z"^^xsd:dateTime; .
:genericTower vsto:hasDeployment :dp1; .
:dset1 a vsto:Dataset;
prov:wasAttributedTo :vaisalaAW310;
prov:wasGeneratedBy :obs1; .
*The knowledge base fragment above is represented in W3C Turtle.
20. Knowledge About Sensor
Network Operation
• Knowledge about sensor networks, however,
can rarely be inferred from sensor data
themselves.
• The lack of contextual knowledge about
sensor data can render them useless.
Knowledge about sensor networks is as important
as data captured by sensor networks, and sensor
network metadata is as important as sensor data
21. 21
Human-Aware Data Acquisition
Framework
• Two locations:
• Darrin Fresh Water
Institute (DFWI) at
Lake George, NY
and
• data processing site
in Troy, NY
• Wireless network
used to
communicate with
sensors
• Relational
database for data
management and
RDF triple store for
metadata
management
22. Future Steps
• We will keep refining the HASNetO
vocabulary and testing it over a constantly
growing HASNetO-based knowledge base
• We are in the process of integrating
HASNetO into the HAScO (Human-Aware
Science Ontology) to accommodate
contextual knowledge beyond observation
data to include simulation data and
experimental data
22