how's your sample and received goods?
•Download as PPTX, PDF•
0 likes•143 views

This document contains graphs and text comparing sample data from 2003 to 2016. The first graph shows that a higher percentage of samples were rated better than or the same as the previous period from 2007 to 2013, while more samples were rated worse from 2013 to 2016. The second graph shows that both plant size and number of staff increased from 2003 to 2016, while yearly turnover remained steady. The text promotes a company that produces goods within 13,000 square meters of fields, has quality control procedures, and will properly deal with complaints and provide compensation for unsatisfactory quality or service issues.

Recommended
More Related Content
What's hot
What's hot (20)
Recently uploaded
Recently uploaded (20)
how's your sample and received goods?
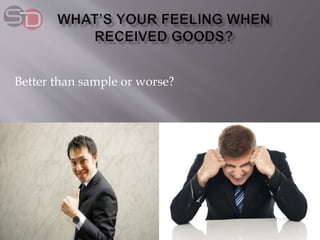
- 1. Better than sample or worse?
- 3. 0 0.5 1 1.5 2 2.5 3 3.5 4 4.5 2003-2006 2007-2010 2010-2013 2013-2016 Better Same Worse
- 5. 0 1 2 3 4 5 6 2003 2006-2009 2010-2013 2013-2016 Plant size Number of staff Yearly turnover
- 7. 1. Producing all your goods within our 13,000sqm fields. 2. A thorough quality control procedure in place to ensure we are delivering best solutions possible. 3. Any quality & Service unsatisfied, welcome your complaint. Related department will properly dealing with even indemnity.