Downloaded 184 times


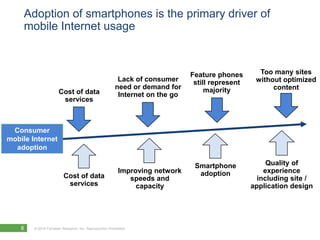
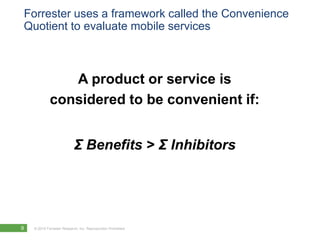
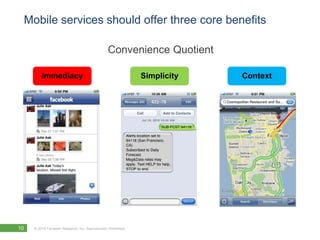
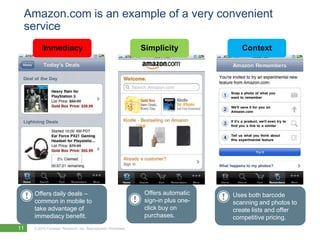
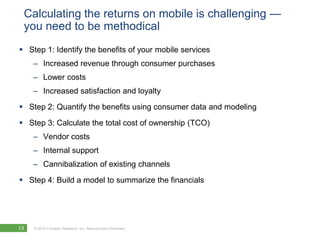

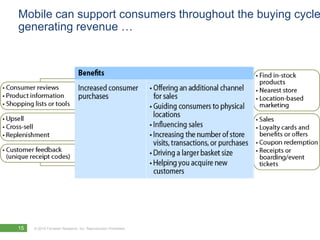


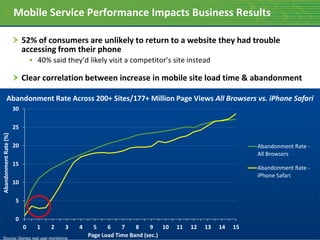


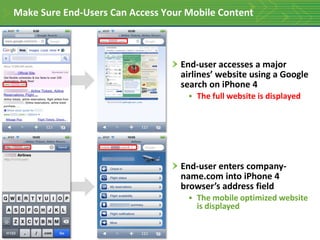


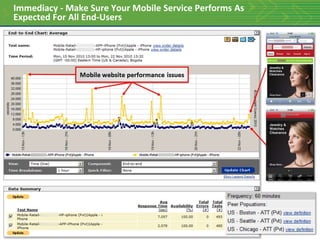
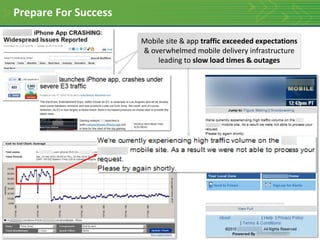
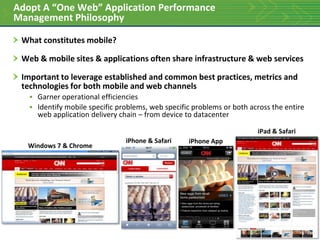


The document discusses the increasing adoption of smartphones, which is driving greater mobile internet usage, and emphasizes the importance of convenience in mobile services. It outlines a methodical approach for companies to calculate the ROI of their mobile initiatives, highlighting benefits such as increased revenue and consumer satisfaction. Additionally, it addresses the challenges of providing quality mobile experiences and stresses the need for effective performance management across mobile and web platforms.