Downloaded 418 times
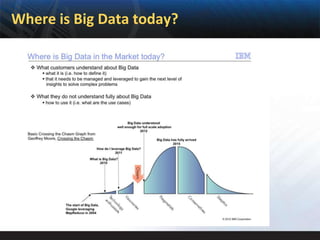
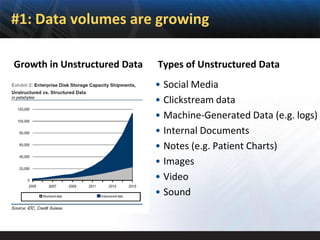
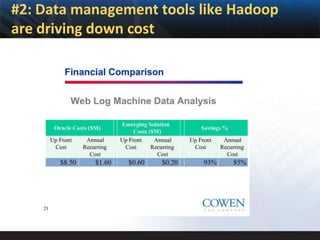
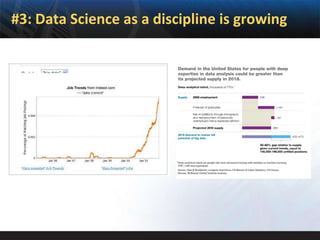

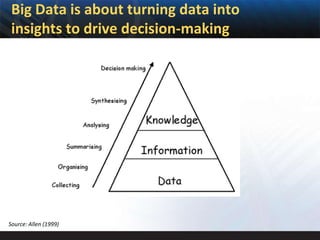
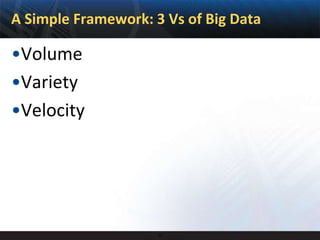
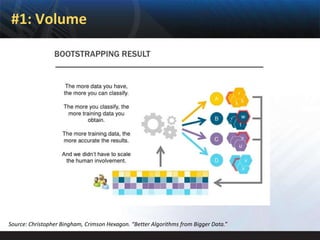


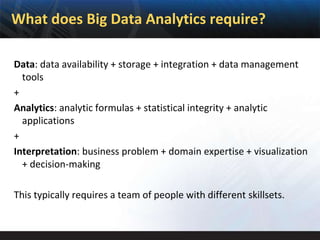
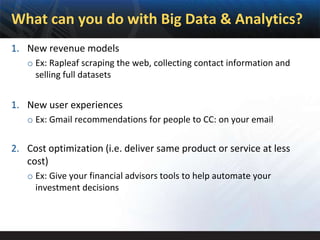
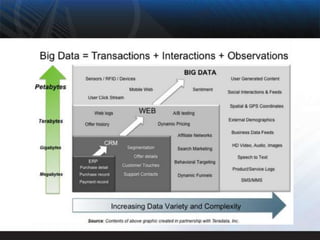

The document outlines how to create new business models using big data and analytics, focusing on the rising volumes of data, decreasing costs of data management tools, and the growing field of data science. It describes big data through the framework of volume, variety, and velocity, coupled with potential applications in marketing and decision-making. The document also highlights various analytics types and the skills needed for effective big data analytics, culminating in possible outcomes such as new revenue models, user experiences, and cost optimizations.


![Getting Started with Apache Spark: Big Data Made Simple [Free Meetup]](https://cdn.slidesharecdn.com/ss_thumbnails/apachesparkgettingstarted-260203175547-8361bcc3-thumbnail.jpg?width=640&height=640&fit=bounds)


