Download to read offline


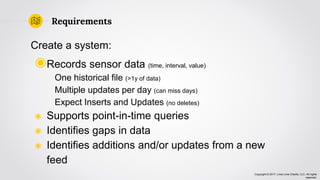
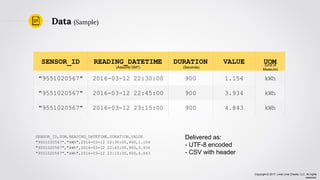
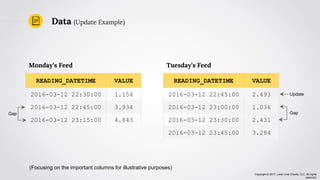
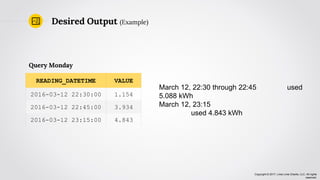
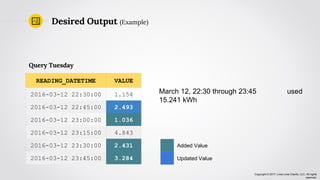
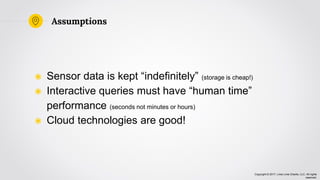
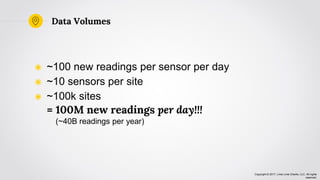

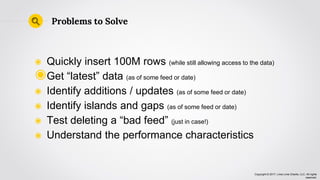
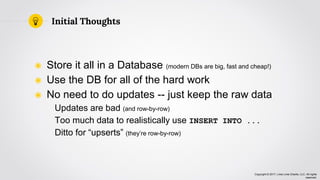

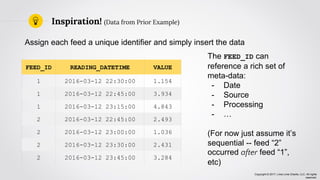
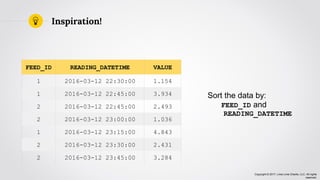
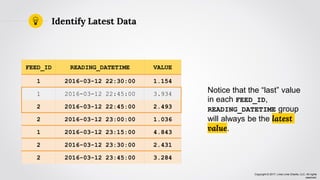
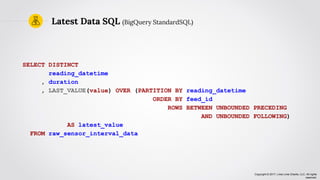
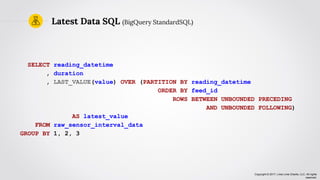
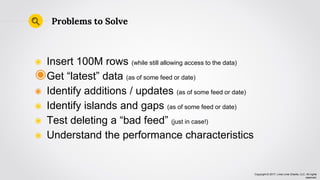

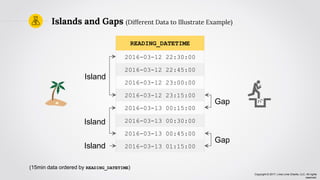
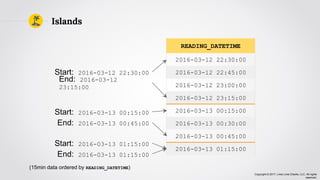
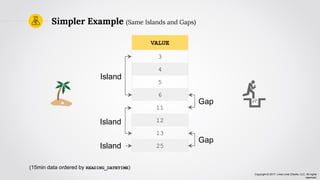
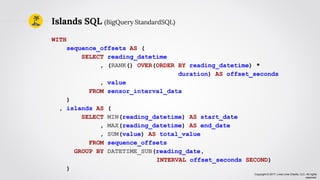
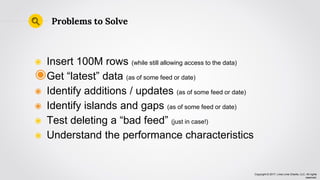


The document discusses creating a data infrastructure to store sensor data. It outlines requirements to record sensor readings over time, support queries, and identify gaps and changes in the data. The solution proposed is to assign each new data feed a unique ID and insert all data sorted by ID and timestamp. This approach allows the system to identify the latest readings, updates, and added data through queries, and helps detect islands and gaps in the data over time. Storing the raw data in a database enables flexible querying and analysis of the sensor information.