Download to read offline


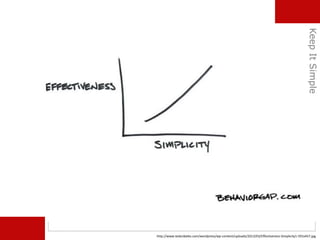


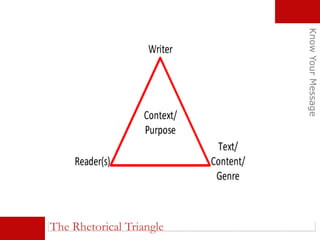


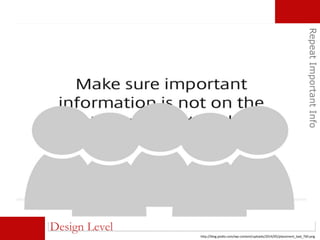
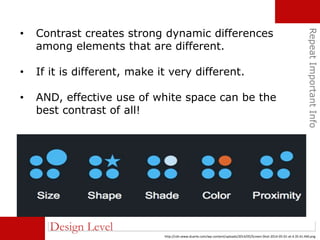


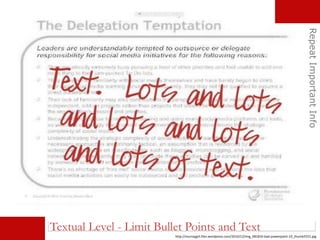


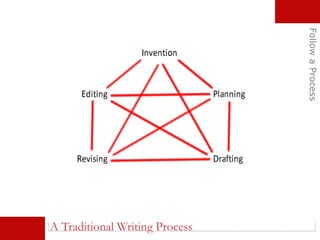
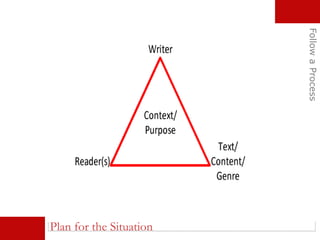


This document provides strategies for constructing effective presentation slides. It discusses keeping slides simple, knowing the core message, focusing each slide on one main point, and repeating key information across multiple slides and presentation levels. Graphs, images, and other visual elements should be used to reinforce the message. An effective presentation follows a process of planning the situation, audience, theme, organization, and visual components to clearly convey the intended message.