Honors Research Colloquium Final Paper
•Download as DOCX, PDF•
1 like•205 views

This paper discusses the project topic in depth and the procedures and logic used during the project to achieve our results.

Recommended
Recommended
More Related Content
Similar to Honors Research Colloquium Final Paper
Similar to Honors Research Colloquium Final Paper (20)
Recently uploaded
Recently uploaded (20)
Honors Research Colloquium Final Paper
- 1. Proceedingsof the 5th Annual FEPHonorsResearchSymposium Copyright,2013,Edwards,M.,Shumaker,J.Pleasedo notusethematerialswithouttheexpressed permission of the authors. 1 Edwards,M. andJ. Shumaker Producing Valid College Football Rankings in Reasonable Time Mark Edwards Department of Mechanical Engineering Jonathan Shumaker Department of Chemical Engineering Faculty Mentor: C. Richard Cassady Ph.D. Department of Industrial Engineering Abstract College footballis anannualsource ofcontroversywhenit comes time to produce the NCAA Bowl ChampionshipSubdivisionrankings at the end ofthe regular season. From the secrecyof how the computer systems rank teams, to the bizarre ballots submittedfor the coach’s poll, everyyear people askthe question:is there a better wayto do this? Ina couple years, there willbe a four-team playoff to determine the two teams that playinthe national championship, andthe CMS+ rankingsystemaims to guide the counselthat will select the teams that playinthe playoff. The CMS+ system uses the quadratic assignment problem, a wayto mathematicallypush winningteams to the top ofthe rankings andlosingteams to the bottom produce results. Currentlyit takes a long time for the CMS+ to produce results, andthis is where we are doing our research. We improvedthe CMS+ systemintwo ways. We have foundand set parameters for degree of victoryto be based off of withinthe CMS+ system. We also have found the ideal amount of mutations andrepeatedtests for the CMS+ systemto produce rankings of high quality. 1. The PresentState ofCollege Football There are currently124 teamsinthe NCAA Football Bowl Subdivision. Eachteam will play around12 gameseach season. Thismeansthatonlyaboutnine percentof the matchupsthat couldhappen actuallyhappen. Obviouslythere are manymatchupsthatdo not occur, thusit isveryhard to decide whoshouldplayinthe National Championshipgame. Currentlythere are onlytwoteamschosentoplay inthe national championshipgame,butthiswillchange in2014 withthe additionof a four-teamplayoff. There are manyfinancial implicationstoplayinginthe National ChampionshipandotherBCSbowl games. There couldbe evenmore moneyonthe line whentheymove toa playoff system. Itisvery hard to choose the twoteamsthat playfor the national championshipformultiple reasons. The firstis that there are many possible rankings;124! to be exact. Because there are so many possible rankingsit ishard to findthe rankingthat ismost accurate. Itis alsoveryhard to thinkaboutwhatshouldbe consideredinthe rankings. There are manyfactorsthat can be considered,forexample:strengthof schedule,strengthof conference,marginof victory,orlocation. Itisveryhard to apply all of these factors across teamsequally. There are alsoconflictswhenyourankteams because there willalwaysbe teamsthat are disappointedandfeel like they shouldbe placedhigherinthe rankings. It ishard to determine which teamsshouldplayinthe National Championshipif there are more thantwo undefeatedteamsinthe same season. All of these ideasprovethatitisverydifficult torankthe teams. This,alongwiththe financial aspect,isdescribedbyMartinich(2002) “Giventhe substantial financial implications,aswell asthe desire toselectthe bestteamsforthe championshipandotherBCSbowls,it isimperative thatthe rankingsystemsincludedinthe selectionformulabe the mostaccurate at ranking
- 2. Proceedingsof the 5th Annual FEPHonorsResearchSymposium Copyright,2013,Edwards,M.,Shumaker,J.Pleasedo notusethematerialswithouttheexpressed permission of the authors. 2 Edwards,M. andJ. Shumaker teams.” Giventhese difficultiesandproblemsinthe approachtorankingCollege football teams,itis evidentthatafair and quality systemisneededtoinsure the bestrankings. 1.1. How the Teams are CurrentlyRanked The Bowl ChampionshipSeries(BCS) systemispresentlyusedtorankthe teams in college football. The BCS systemcombinescomputerrankings andhumanpollstoformulate itsfinal rankings. The two opinionpollsare the HarrisPoll andthe USA Today/CoachesPoll. The humanpollsaccountfortwo thirdsof the total BCS rankings;one thirdeach. Opinionpollshave afew flaws. Theyare afterall opinion,sothere will be biasinthe rankingsthattheyproduce. A discrepancyassociatedwiththe coach’s poll isthat,insome cases the personvotingisa coach assistantor someone associatedwiththe school. There are also timeswhenthe ballotsare filledoutinaway thata teamis leftoff. Thishappens simplybecause people are liable to messupwhenfillingouttheirballots. The otherone thirdconsists of six computerrankings. These rankingshave manyproblems. The firstisthat theyare mostlysecret, withonlyone of the six beingpublic. The factthat theyare not all publishedandpeerreviewedproves that there couldbe majorproblemswiththem. Because we don’tknow how theyare formed,we don’t knowif theyare qualityandcan evencome upwiththe correct rankings. There are alsodata errors. The one rankingthatis nota secretwasfoundto have errorsin itsdata. Whenthere are data errors theyneedtobe found,andtheywill notbe foundif there are secretrankings. There will alsobe design biasin the computerrankings. The waya program is made will introduce bias. Whenthere isbiasitwill affectthe resultsthatare generatedbythe computer. These flawsinthe BCSsystemcombinedwiththe manydifficultiesthatarise inrankingteams prove thatthere couldbe a systemthatbetterranksthe teamsthat shouldplayinthe National Championshipgame andeventuallydecide the teamsthatshould playinthe fourteamplayoff. 2. A NewSystem for Ranking College Football Teams We believe thatdue tothe numerous flawswiththe BCSsystemforrankingteamsthere shouldbe a newsystemforrankingcollege football teams. 2.1. Our Platform Firstwe believe thatafourteamplayoff increasesthe needforabetterrankingsystem. The selection committee willneedhelpdecidingthe teamsthatshouldplayinthe fourteamplayoff. Itwill actuallybe a more rigorous process todistinguish betweenthe fourthandfifthteamsthantodistinguish between the secondand thirdteams. Second,we believe thatthere isnosuchthingas an unbiasedsystem, so the systemshouldbe public. The committee shouldalsostate whatisimportantinthe rankingssothe teamsknow whatto do in creatingtheirschedulesandhow theyplaytheirgames. Finally,we believe that a computer-basedsystemshouldbe usedtocreate rankings. Thisisthe case because humans cannot simultaneously thinkaboutall the gamesthathappened throughoutthe season. Humansdonot remembereverygame. Theycannotthinkaboutwhere theywere played,orthe score,or all the other information pertainingtoeachand everygame. Computerscan simultaneously process eachof these aspectsand compare them. Alsocomputerscanapplythe biasthat the committee wantconsistently
- 3. Proceedingsof the 5th Annual FEPHonorsResearchSymposium Copyright,2013,Edwards,M.,Shumaker,J.Pleasedo notusethematerialswithouttheexpressed permission of the authors. 3 Edwards,M. andJ. Shumaker across all the teams. If the methodusedtorank teamsisappliedequallytoeachschool,theneachteam wouldbe placedinthe bestand mostaccurate position. 2.2. Our System We propose usingthe CMS+ systemforrankingcollege football teamsprovidedbySullivanandCassady (2009). The CMS+ definesthe problemmathematically usingaquadraticassignmentproblem(QAP). The onlyissue withthe QAP isthat it ison such a massive scale. The largestproblemsthathave been solvedare foraround n=40. Inour case n=124, so we cannot use the solution.Nevertheless thereare methodsforacquiringvalidresults forsuchlarge QAPs. Inour QAPthere are twoinputs:degree of victoryand relative distance. The degree of victoryis asystemforcomparingteams the rankings. The degree of victoryis adjustedbythingssuchas headto headvictories,marginof victory,andlocationof the game. The otherinputisrelative distance. Thisis definedasthe distance betweenthe teamsinthe ranking. We will use the bell curve togeta general rankingsetupwhere the distance betweenteamsat the endsof the bell curve are furtherapart thanthe teamsinthe middle. The waythat we attemptto solve the QAP isthrougha two stage heuristicapproach. Firstwe will use a geneticalgorithmthatuses a survival of the fittestapproach. We do thisprocess100,000 timestomake sure that the rankingsare as close to perfectaspossible. Afterthe geneticalgorithm hasbeencompleted, we use alocal search. The search switchesone teamata time andif the switchmakesthe rankingbetterthanit makesthat adjustmentandredoesthe local searchforswitching. Thisentire heuristicapproachisredone twenty timesbecause the startof the geneticalgorithmisdone randomly. 2.3 Problemswith the CMS+ System There are two mainfeatures thatcan be studiedtofurtherimprove the CMS+systemforrankingteams. The firstproblemisdecidingwhat parameters shouldbe includedin degree of victory. We know that there are thingsthat shouldbe included,butthe difficultyis whichfactorstoinclude and how to include them. The secondproblemwiththe CMS+ system isthat itis a longprocess. 3. Our Research Plan: Improvingthe CMS+ System As statedbefore there are problemswiththe CMS+System. Our goal isto improve the systemandwe will dothisintwo ways,improvingthe degreeof victoryandshorteningthe runtime. 3.1. Degree of Victory Research We workedtoimprove the Degree of Victoryby findingpossible factorstoinclude andwaystoquantify these factorsdetermined. Thiswasdone bycollectingdatafrompastseasons. The data collectedwas fromthe informationprovidedbyJamesHowell onhisdatabase,ESPN.com, and collegepollarchive.com. Once we hadthe data we were able touse it to findrankingsandanalyze the effectsourfactorshad on the rankingscreated fromthe years. Thispart of the projectwas done with the othergroup workingonthe project: (T. DodsonandA. McElhenney). 3.2. Run Time Research
- 4. Proceedingsof the 5th Annual FEPHonorsResearchSymposium Copyright,2013,Edwards,M.,Shumaker,J.Pleasedo notusethematerialswithouttheexpressed permission of the authors. 4 Edwards,M. andJ. Shumaker Our secondresearchgoal was to shortenthe run time. We had to findwaysto getvalidrankings, while alsoshorteningruntime. Thiswasdone by experimentationandadjustmentstothe CMS+ system throughthe use of variouscombinationsof GA generationsandheuristicreplications. 4. ImprovingDegree of Victory The firstway that we workedtoimprove the CMS+ Systemof rankingwasby establishingwhatshould be includedindegree of victoryand uponcompletionof thistaskwe createdadegree of victorymatrix. Findingfactorstoinclude wasdone inpartnershipwith T.DodsonandA. McElhenny. 4.1. Factors to Include in Degree ofVictory Ultimatelyfivefactorswere chosentobe adjustedin ourDegree of Victorythat ledto our rankings. Of the five factorsthat were chosenfourcan be variedintheirweight. The total amountof degree of victorypointsthatcan be giventoone team in the degree of victorymatrix is100 points. The factor that cannot be removedisthe game result,whichisjustwhowonthe game. Thisfactor can be lowered inweightbasedonhowmuch influenceisgiventothe otherfouraspects that gointo the ranking. The fourotherfactors that are included,andwhichcanalsobe varied are:if the game wasplayedat home or on the road, if the teamhas more winsagainstcommonopponents,if theyare theirconference champion,andif theyhave a higherrank inthe AP poll. These factorscanall carry a total weightof 60 pointsinthe degree of victorymatrix. Thismeans the winnerof the game must receive 40 points. The waythat more than40 pointscan be giventothe winnerisif some of the four variedfactorsare turned off. In that case the unallocatedpointsare all giventothe winnerof the game. 4.2. The Degree of Victory Matrix The bestway to compare teamsisthrough a matrix. The creationof thismatrix isdone throughvisual basicprogrammingandit is adjustable basedonthe variationsthateachpersoncanchoose fordegree of victorypoints. Pointsare awardedtoeachteam basedonthe factors that were establishedabove. For everygame played,the systemtakesintoaccountwhowonandwholostthe game and if itwas a home or awaygame. The pointsallocatedare giventoan awayteam thatwinsbasedon the ideathat gamesplayedonthe road are harderto winthan gamesat home. For everysingle pairof teamsthe othercategoriesare compared. The teamthat has more winsovercommonopponentswill getthe allocatedpoints. Thisisa wayto establishadifference betweenteamsthatmayhave the same record but mayhave competedbetteragainstteamsthatthe teamshave incommon. The pointsassignedto APpointsare giventothe teamthat is rankedhigherinthe APpoll. Thisisa wayto include ahuman aspect,or the “eye test,”whichissomething thatishard to do withincomputerrankings. The final aspectis that if the teamsare inthe same conference thenthe championof thatconference willbe giventhe pointsallocatedforconference championsoverevery otherteaminthe conference. Using visual basicthe matrix fordegree of victorycan be createdwhere eachteamis bothalongthe vertical and horizontal sidesandthe pointsthatare allocatedforeachteamare withinthe matrix. Thismatrix is usedinthe CMS+ systemforrankingteamsand will be able toproduce rankingswiththisdegree of victorymatrix.
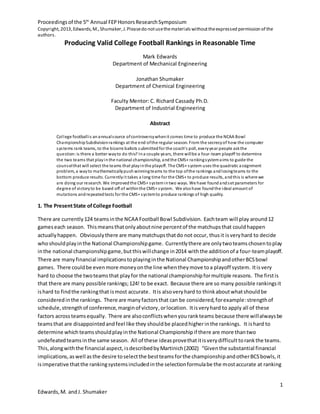
- 5. Proceedingsof the 5th Annual FEPHonorsResearchSymposium Copyright,2013,Edwards,M.,Shumaker,J.Pleasedo notusethematerialswithouttheexpressed permission of the authors. 5 Edwards,M. andJ. Shumaker 4.3. Results Once we determinedthe factorsthatshouldbe includedindegree of victorywe testedthe effectthat the factors have on rankings. Thiswasdone bydefiningsixteendifferentcasestoworkonfor past years. These caseswill allowustorun the program andevaluate how changingall of the factors affects the ranking. The testcasescome from the fourfactors that we vary andtheyare all turnedon andoff in varyingarrangementssuchthatall variouscombinationsof the fourfactorsare tested. Whenwe turned a factor on we gave it fifteenpointsandnone whenitwasturneditoff. The resultsforthe rankingsare seeninour Appendix. The resultsforfitnessthat we foundproducedanaverage standarddeviation above the meanof close to10,000 basedon the informationfrom Dodson andMcElhenny. Thatis such a large value that calculatinghowmanybetterrankingswouldbe producedcomesupwithsuchasmall numberthatit readsit as zero. This meansthatusingour degree of victorywe are able to calculate the ideal rankingsthatcorrespondtothe factors we included. 5. ReducingRun Time Improvingthe problemof alengthyruntime isdone throughtestingandexperimentation. The best wayto do thisis through testson pastyears. We neededtofindthe pointatwhichthe run time is minimizedbutstill avalidrankingisproduced. 5.1. CreatingTests Reducingthe runtime isdone by decreasingthe amountof GA generationsandheuristic replications. We neededto testthe effectthatdecreasingthe generationsandreplicationshason solutionquality. We decreasedthe generationsfromthe 100,000 initiallyusedinthe CMS+ system. Intervalsusedto decrease the generationwere of 25,000. Replicationswere alsoreduced,butonlyonce by10. After completingtestsdownto25,000 total generations,we noticedthatwhetherwe were at10 replications or 20 replications, we gotvirtuallythe same runtime. ThisisseeninTable 1. Because the numberof replicationsdoesnotaffectthe runtime we decidedtoleaveitat20 replications. Whenthese generationsare decreasedthe runtime goesdowntoa certainpoint,butif loweredtoofarthe time will start to increase again. We foundoutthat no matterhow low we go withthe numberof generations and replicationssolutionqualityisnotaffectedatall. We took a range of values,goingfrom100,000 to 100 to see howtime variesforeachamount.We wentinstepsof 25,000 from100,000 downto 25,000, and thenvariedstepsfrom10,000 to 100 just to findtimesincertainrangesthat correspondtothe ideal time. 5.2 Run Time Results Thistable expressesperfectlythe factthatrun time isnot affectbyreplicationsbecausethe same times are producedforboththe setsof 20 and 10 replications. Alsothe fitnessneverchangedwhichmeans that no matterhowwe adjustthe generationsandreplicationsthe same fitnesswill be calculated.
- 6. Proceedingsof the 5th Annual FEPHonorsResearchSymposium Copyright,2013,Edwards,M.,Shumaker,J.Pleasedo notusethematerialswithouttheexpressed permission of the authors. 6 Edwards,M. andJ. Shumaker Table 1: RunTime and SolutionQualityforCombinationsof GA GenerationsandHeuristicReplications GA Generations HeuristicReplications Run Time (seconds) Fitness 100,000 20 139 196313 75,000 20 107.68 196313 50,000 20 71.72 196313 25,000 20 40.12 196313 10,000 20 28.62 196313 100,000 10 139 196313 75,000 10 105 196313 50,000 10 71 196313 25,000 10 40.67 196313 10,000 10 27.92 196313 Figure 1: The Effectof GenerationsonRunTime at 20 Replications We noticedthatwhenwe loweredthe generationspastacertainpointthe time startedto increase again. This isseeninthe 4,000 to 1,000 range where the time changesandwill increase oneitherside of thisrange. Goingfrom 3,500 to 1,000, there wasa 19.74 secondjumpintime.Goingfrom1,000 to 100 generations,there wasa230.26 secondjumpintime. The same increase isseengoingthe other way,justnot inas significantof jumps. Thisgraphalongwiththisanalysisleadsustobelievethatthe 0 50 100 150 200 250 300 0 10000 20000 30000 40000 50000 60000 70000 80000 90000 100000 110000 Time(sec) Total Genera ons at 20 Replica ons Time per Total Amount of Genera ons at 20 Replica ons
- 7. Proceedingsof the 5th Annual FEPHonorsResearchSymposium Copyright,2013,Edwards,M.,Shumaker,J.Pleasedo notusethematerialswithouttheexpressed permission of the authors. 7 Edwards,M. andJ. Shumaker area where the shortestruntime wouldcorrespondtoisinthe range of 3,500 to 4,000 generations. Thisis a large decrease fromthe initial 100,000 usedinthe CMS+ system. The 100,000 generations produceda run time of 139 seconds,throughour experimentationwe were able tofindinthisrange we will geta run time of about25 secondswhichisone fifthof the initial time. 7. Conclusions Throughoutthisresearch,we were able to achieve all of ourgoals.We definedparametersforand computeddegree of victory throughthe use of data collectedfrompastyears.Usingourdegree of victory,we producedrankingsforeachsetof parametercombinations,whichwe comparedtothe BCS rankingsforthe year of 2010. Basedon calculationsfromourfitnessvalue,the ranksthatare better than the one producedisso small thatit roundsdownto zero,meaningourrankingsare highquality. We were alsoable toreduce run time byeffectivelyandefficientlyreducingthe generationamount.We alsovariedthe replicationamountinourtests,butfoundthatchangingthe replicationamounthadno affectonthe rankingor run time. However,there’splentyof researchthatcanbe done in the future on thisproject. The main areathat can be expandedisthroughfurtherworkondegree of victory. Our factors were notall that couldbe included. There are multiple more factorsandmore waysto include the factors that we expressed. Itwouldbe possible toadjustfactorsindifferentwaysandprovide an evenmore personal approach. Runtime issomethingthatcanbe decreasedinmanywaysas well. There are otheraspectswithinthe CMS+ systemthatcan be adjustedtomake the time neededtorun the program shorter,andthere are waysto adjustthe program as a whole torun inlesstime. Our researchbringsto the forefrontthe ideathatthere can be a personalizedaspecttothe ranking,andthat there can be many factorsthat can be turnedonand off. We alsoimprovedthe CMS+systemby shorteningthe time ittakestorun the program while stillgettingvalidresults. Overall bothgoalswere metand the CMS+ systemwasimprovedinthe areasof degree of victoryandrun time. 8. References Cassady,C. Richard,Maillart,LisaM., and Salman,Sinan,2005, “RankingSportsTeams:A Customizable QuadraticApproach,”Interfaces,35(6),497-510. Martinich,Joseph.2002. “College football rankings:Dothe computersknow best?”Interfaces32(5) 85– 94. Sullivan,Kelly,Cassady,C.Richard,2009. “The CMS+ SystemforRankingCollege Football Teams.” Proceedingsof the 2009 Industrial EngineeringResearchConference.
- 8. Proceedingsof the 5th Annual FEPHonorsResearchSymposium Copyright,2013,Edwards,M.,Shumaker,J.Pleasedo notusethematerialswithouttheexpressed permission of theauthors. 8 Edwards,M. andJ. Shumaker 9. Appendix: DOV 01 DOV 02 DOV 03 DOV 04 DOV 05 DOV 06 DOV 07 DOV 08 REAL BCS Fitness 244343 224675 226317 219045 246025 237197 221582 238751 1 TexasChristian Oregon Oregon Oregon Oregon Oregon Oregon Oregon Auburn 2 Oregon TexasChristian TexasChristian TexasChristian TexasChristian TexasChristian TexasChristian TexasChristian Oregon 3 Stanford Stanford BoiseState Auburn BoiseState Auburn Auburn Auburn TCU 4 Wisconsin BoiseState Auburn BoiseState Auburn Stanford MichiganState OhioState Stanford 5 MichiganState Auburn Nevada Stanford OhioState MichiganState BoiseState Nevada Wisconsin 6 Nevada Wisconsin Wisconsin Nevada Nevada OhioState Wisconsin MichiganState Ohio State 7 OhioState Nevada Stanford OhioState Wisconsin Nevada Nevada BoiseState Oklahoma 8 BoiseState OhioState OhioState Wisconsin Stanford BoiseState VirginiaTech Stanford Arkansas 9 Auburn MichiganState MichiganState MichiganState MichiganState Wisconsin OhioState Wisconsin Michigan State 10 VirginiaTech Utah Utah VirginiaTech Utah VirginiaTech Stanford VirginiaTech Boise State 11 Utah VirginiaTech VirginiaTech Utah VirginiaTech Utah Oklahoma Utah LSU 12 Oklahoma Missouri Oklahoma Oklahoma Oklahoma OklahomaState Utah Oklahoma Missouri 13 Nebraska Nebraska Missouri OklahomaState OklahomaState Oklahoma Nebraska OklahomaState Virginia Tech 14 OklahomaState Oklahoma OklahomaState Missouri Missouri Missouri Missouri Missouri Oklahoma State 15 Missouri OklahomaState Arkansas Arkansas Arkansas Nebraska OklahomaState Arkansas Nevada 16 Arkansas Arkansas CentralFlorida CentralFlorida Nebraska Arkansas CentralFlorida CentralFlorida Alabama 17 SouthCarolina CentralFlorida Nebraska Hawaii CentralFlorida CentralFlorida Arkansas Hawaii Texas A&M 18 WestVirginia Hawaii Tulsa Tulsa FloridaState Hawaii Hawaii Nebraska Nebraska 19 Alabama Tulsa Hawaii FloridaState Tulsa FloridaState WestVirginia FloridaState Utah 20 LouisianaState FloridaState WestVirginia Nebraska WestVirginia Tulsa Tulsa Tulsa South Carolina 21 Hawaii Alabama FloridaState WestVirginia Hawaii WestVirginia FloridaState WestVirginia Mississippi State 22 FloridaState WestVirginia LouisianaState LouisianaState LouisianaState LouisianaState LouisianaState LouisianaState West Virginia 23 Tulsa LouisianaState SouthCarolina Alabama SouthCarolina Alabama Alabama Alabama Florida State 24 CentralFlorida SouthCarolina Alabama SouthCarolina Alabama SouthCarolina Miami(Ohio) SouthCarolina Hawaii 25 TexasA&M Temple TexasA&M Miami(Ohio) TexasA&M Toledo TexasA&M TexasA&M UCF DOV 09 DOV 10 DOV 11 DOV 12 DOV 13 DOV 14 DOV 15 DOV 16 REAL BCS Fitness 201622 214227 203404 216012 216012 217337 223232 196313 1 Oregon Oregon Oregon Oregon Oregon Oregon Oregon Oregon Auburn 2 TexasChristian TexasChristian TexasChristian Auburn Auburn TexasChristian TexasChristian Auburn Oregon 3 Auburn Auburn Auburn TexasChristian TexasChristian Stanford Auburn TexasChristian TCU 4 BoiseState MichiganState BoiseState MichiganState MichiganState Auburn BoiseState BoiseState Stanford 5 MichiganState BoiseState Wisconsin BoiseState BoiseState Nevada MichiganState MichiganState Wisconsin 6 Wisconsin Wisconsin MichiganState Wisconsin Wisconsin BoiseState Wisconsin Wisconsin Ohio State 7 Nevada VirginiaTech Nevada VirginiaTech VirginiaTech OhioState Nevada VirginiaTech Oklahoma 8 Stanford Nevada VirginiaTech Nevada Nevada MichiganState VirginiaTech Nevada Arkansas 9 VirginiaTech OhioState Stanford OhioState OhioState Wisconsin OhioState Stanford Michigan State 10 OhioState Stanford OhioState Stanford Stanford VirginiaTech Stanford OhioState Boise State 11 Oklahoma Oklahoma Oklahoma Oklahoma Oklahoma Utah Oklahoma Oklahoma LSU 12 Utah Utah Utah Utah Utah Oklahoma Utah Utah Missouri 13 Missouri OklahomaState Missouri OklahomaState OklahomaState OklahomaState Missouri CentralFlorida Virginia Tech 14 Nebraska Missouri CentralFlorida CentralFlorida CentralFlorida Missouri OklahomaState OklahomaState Oklahoma State 15 OklahomaState Nebraska OklahomaState Missouri Missouri Nebraska CentralFlorida Missouri Nevada 16 CentralFlorida CentralFlorida Hawaii Hawaii Hawaii Arkansas Arkansas Hawaii Alabama 17 Hawaii Hawaii Arkansas Arkansas Arkansas CentralFlorida Hawaii Arkansas Texas A&M 18 Arkansas Arkansas WestVirginia WestVirginia WestVirginia Hawaii WestVirginia WestVirginia Nebraska 19 WestVirginia WestVirginia Tulsa FloridaState FloridaState FloridaState Nebraska Miami(Ohio) Utah 20 Tulsa FloridaState Nebraska Tulsa Tulsa Tulsa Tulsa Tulsa South Carolina 21 FloridaState Tulsa FloridaState Nebraska Nebraska WestVirginia FloridaState FloridaState Mississippi State 22 Alabama LouisianaState Miami(Ohio) LouisianaState LouisianaState LouisianaState LouisianaState LouisianaState West Virginia 23 LouisianaState Alabama LouisianaState Miami(Ohio) Miami(Ohio) Alabama Alabama Nebraska Florida State 24 Miami(Ohio) Miami(Ohio) Alabama Alabama Alabama SouthCarolina Miami(Ohio) Alabama Hawaii 25 NorthCarolinaStateTexasA&M Connecticut TexasA&M TexasA&M TexasA&M Connecticut TexasA&M UCF