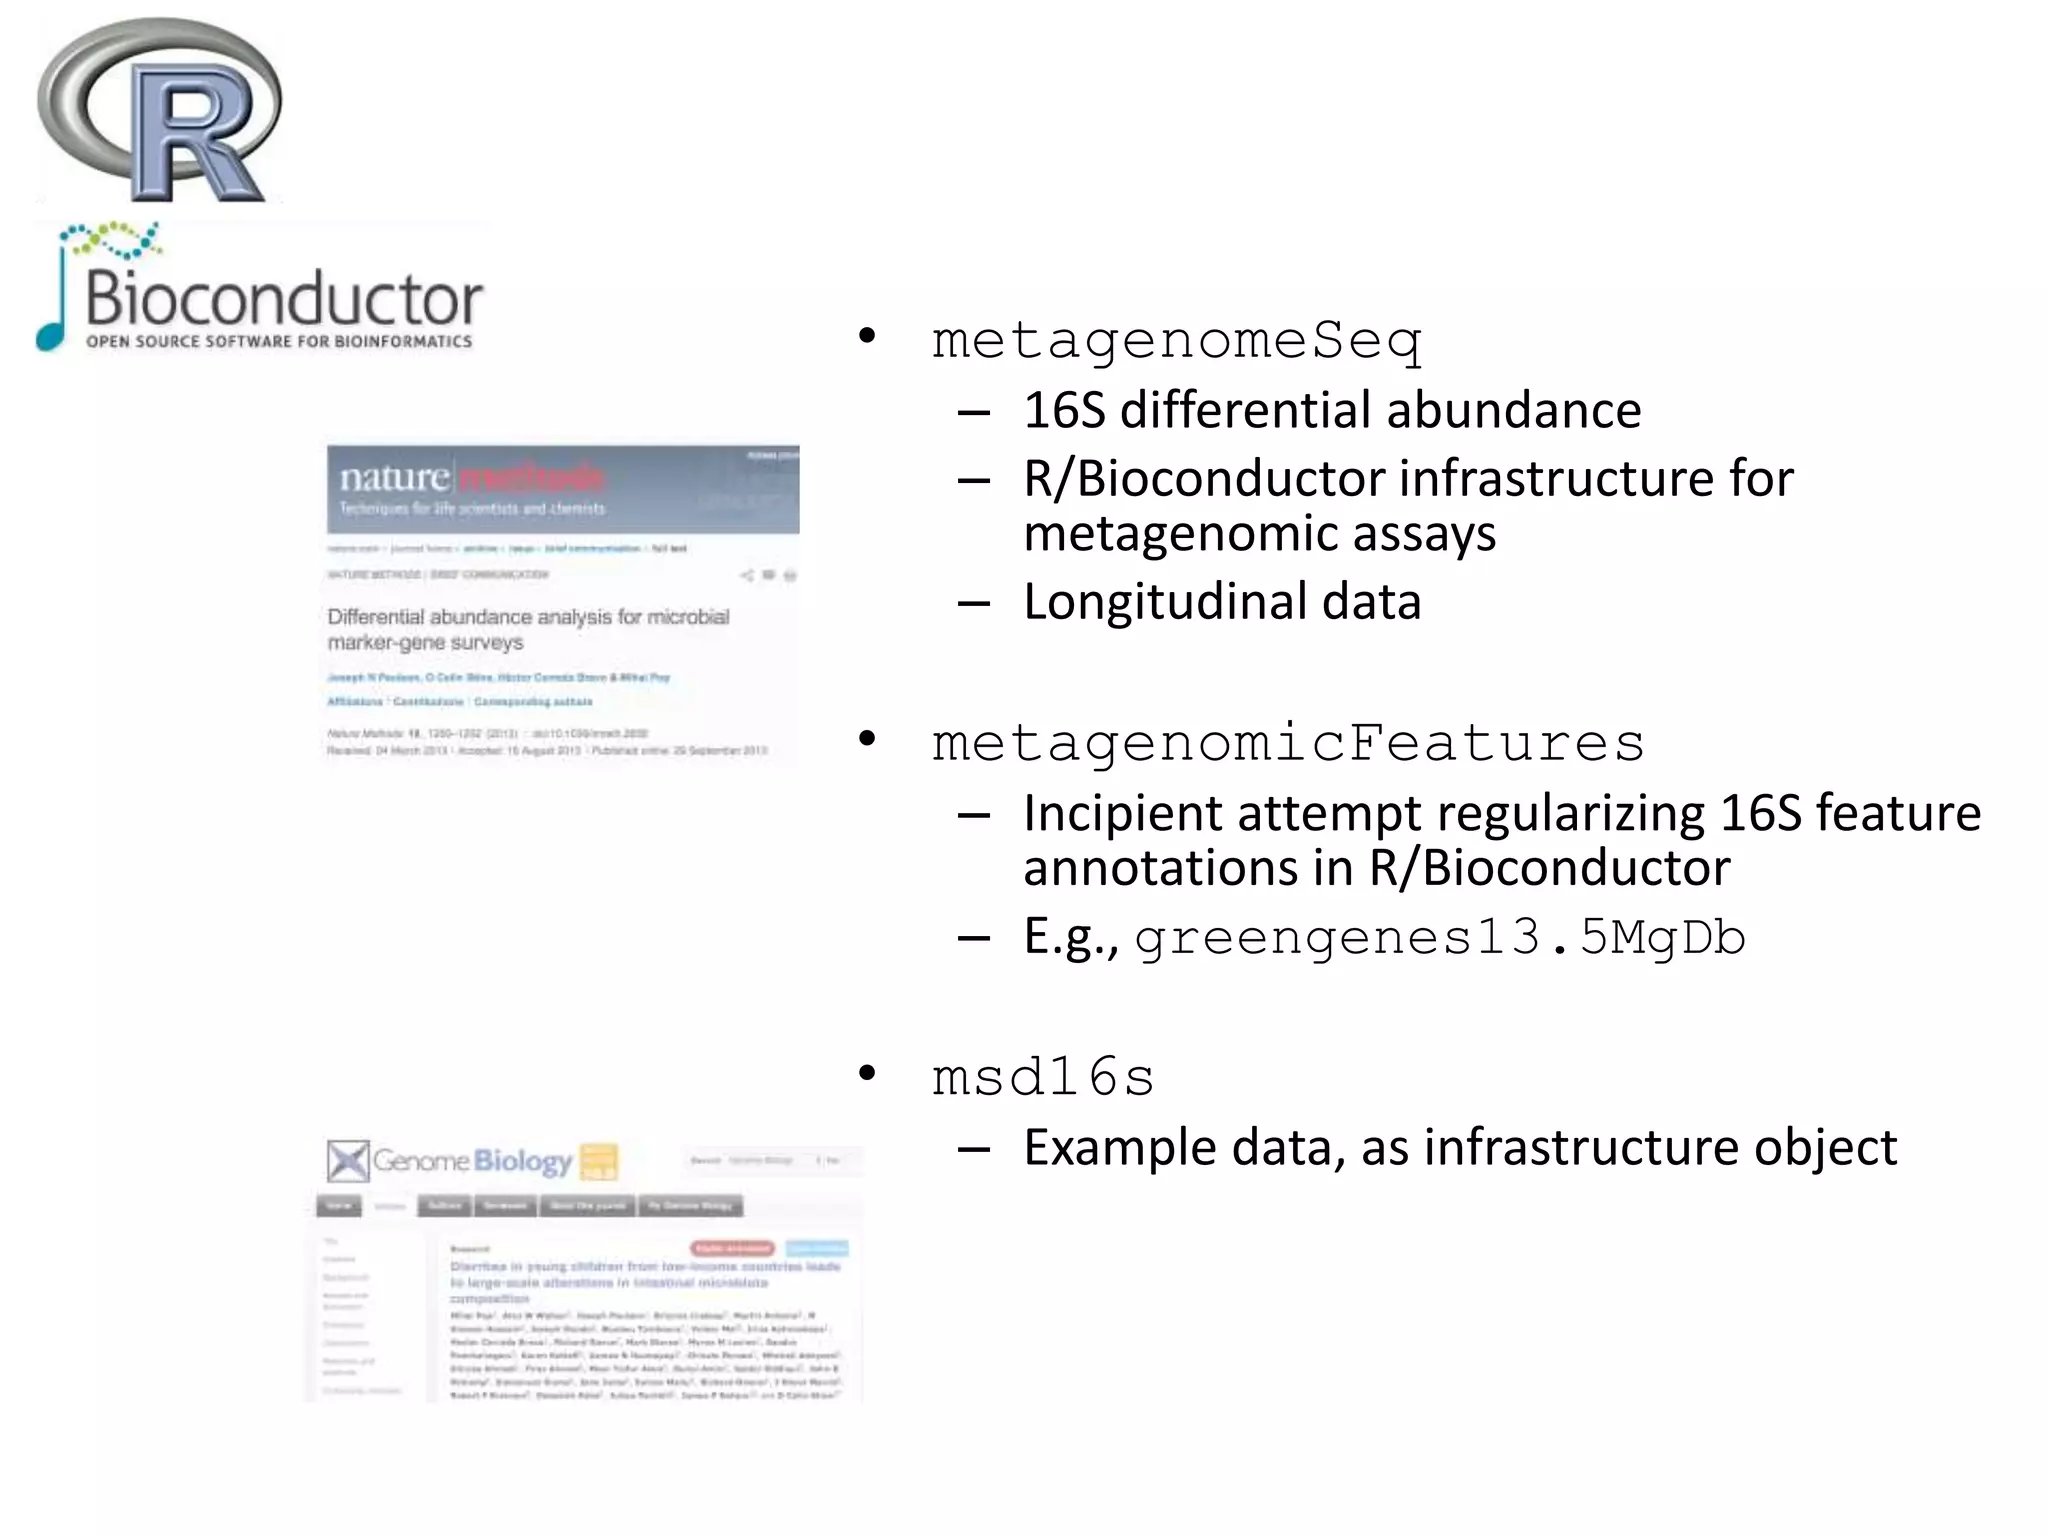
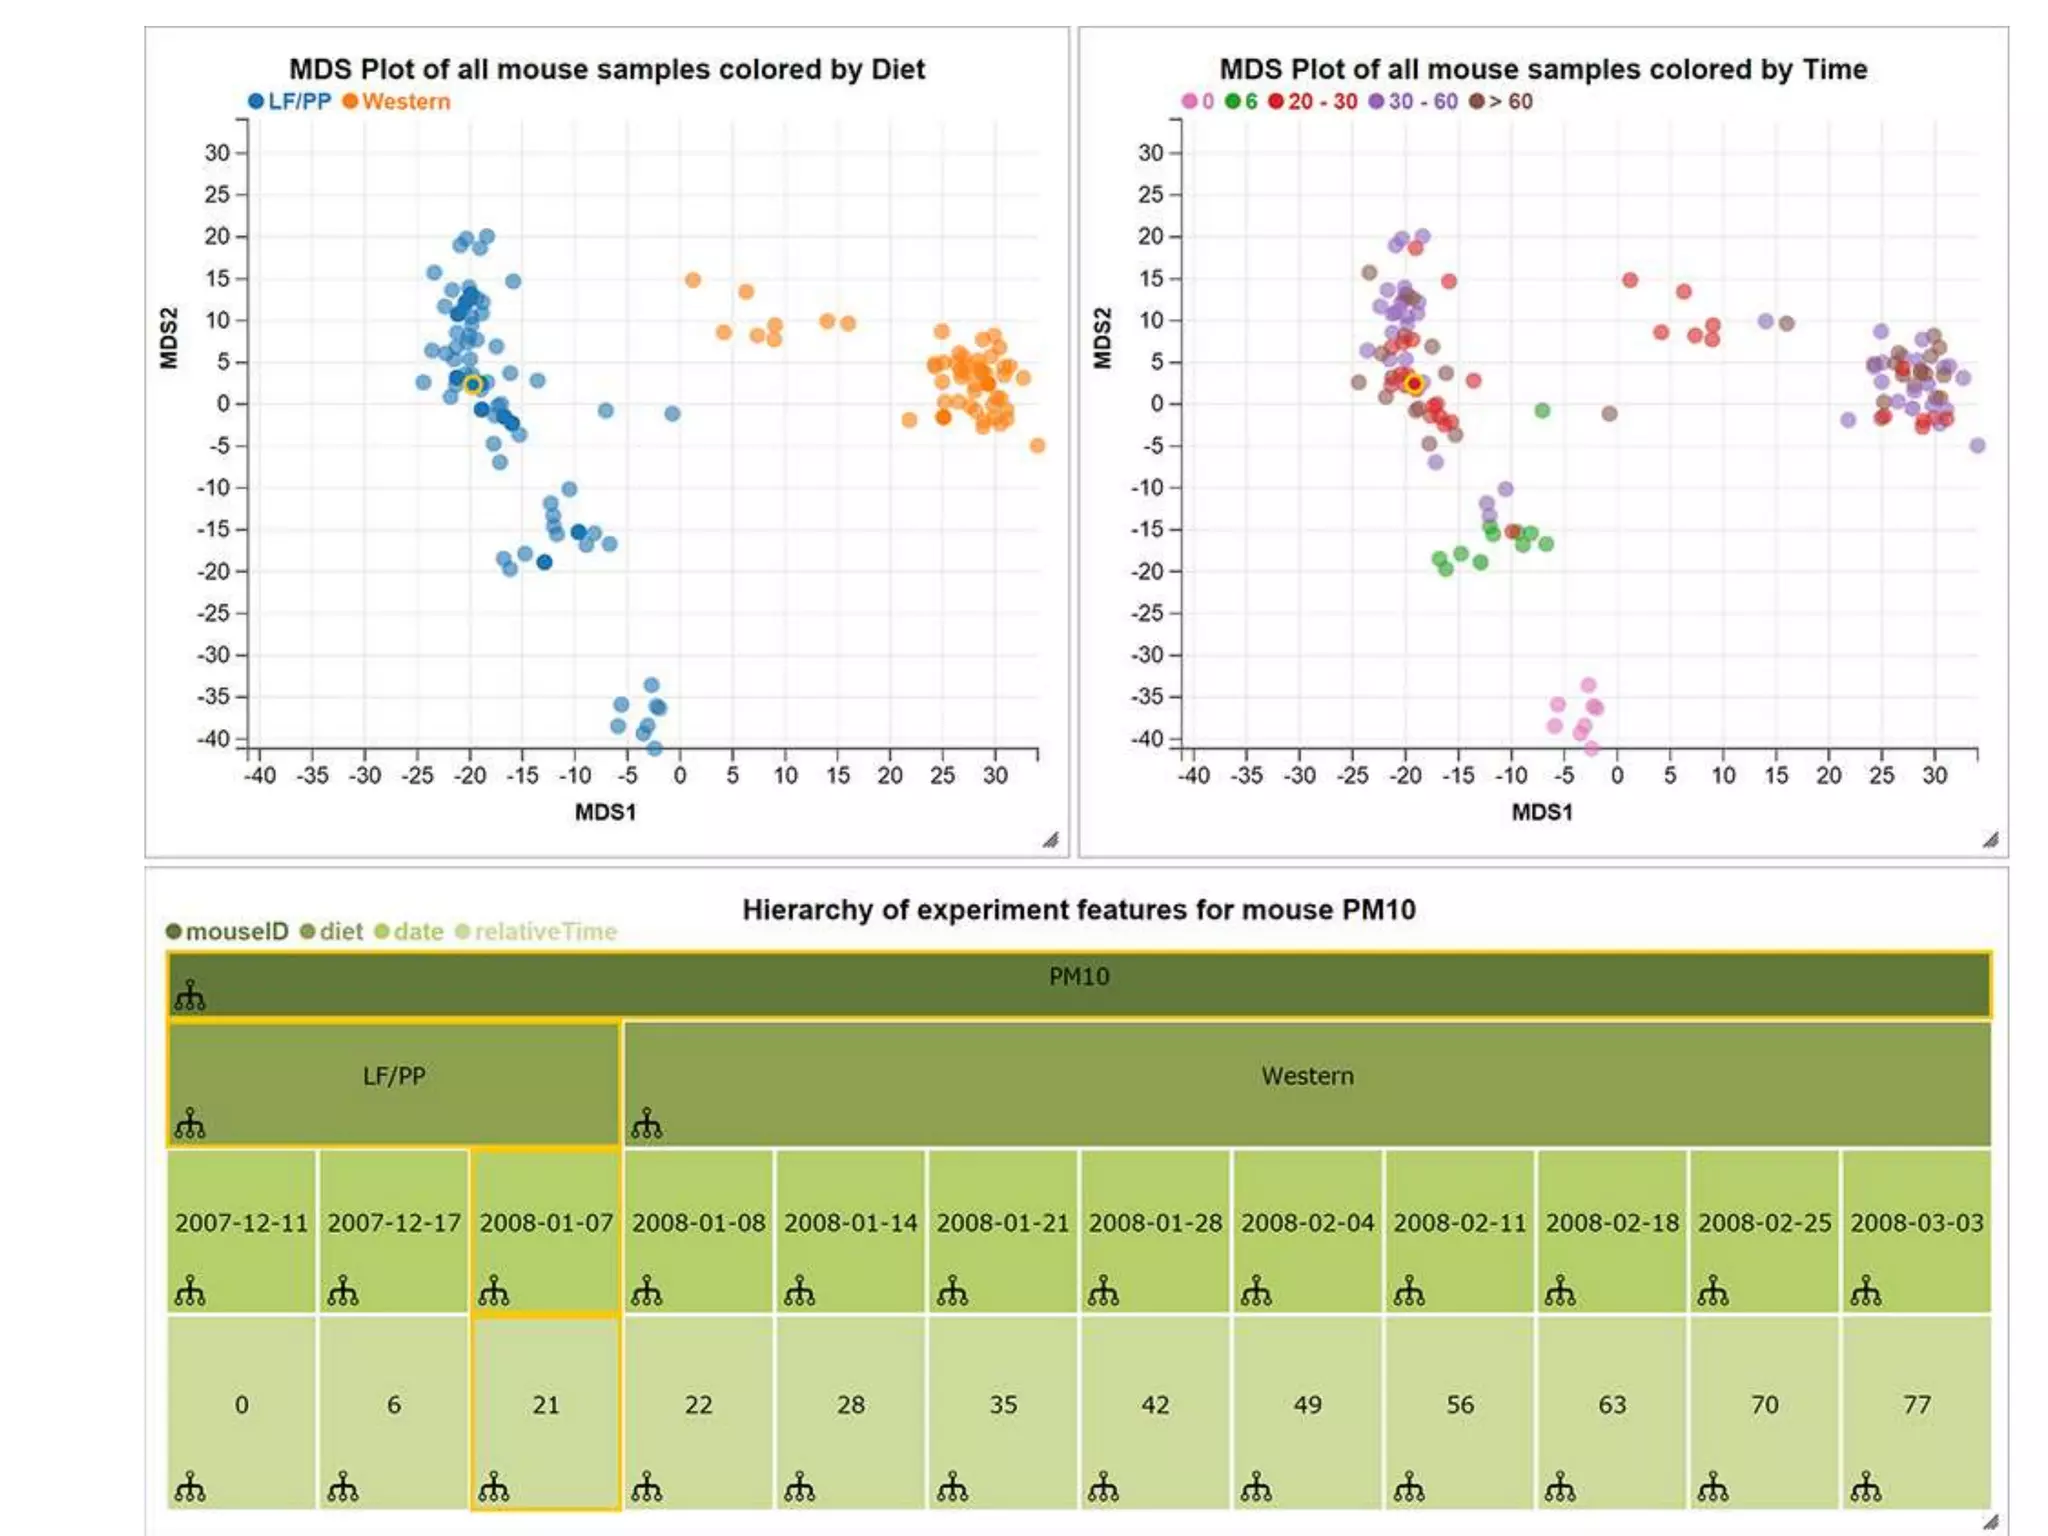
Statistical and Visualization Methods for Metagenomic Analysis
Héctor Corrada Bravo
Center for Bioinformatics and Computational Biology
• metagenomeSeq
– 16S differential abundance
– R/Bioconductor infrastructure for
metagenomic assays
– Longitudinal data
• metagenomicFeatures
– Incipient attempt regularizing 16S feature
annotations in R/Bioconductor
– E.g., greengenes13.5MgDb
• msd16s
– Example data, as infrastructure object
R/Bioconductor Strengths
• Infrastructure objects
– Interoperability, speed up startup time for method development
• Strict development practices
– Documentation, use cases, vignettes
• Annotation infrastructure
– Again, interoperability across experiments and data types
• Exploratory analysis
• Reproducibility
– Vignettes, Rmarkdown, etc.
• Recently, exploratory and interactive visualization
– Shiny, epiviz
Integrative, visual and computational
exploratory analysis of genomic data
• Browser-based
• Interactive
• Integration of data
• Reproducible dissemination
• Communication with R/Bioconductor: epivizr package
software systems to support creative exploratory analysis of large genome-wide datasets...
• Computed Measurements: create new measurements from
integrated measurements and visualize
• Summarization: summarize integrated measurements
(computed on data subsets)
Dynamically extensible: Easily integrate new data sources, data
types and add new visualizations.
Data providers define coordinate
space
One interpretation of Big Data is many sources of relevant
contextual data
• Easily access/integrate contextual data
• Driven by exploratory analysis of immediate
data
• Iterative process
• Visual and computational exploration go
hand in hand
Visualization design goals
Context
• Integrate and align multiple data sources;
navigate; search
• Connect: brushing
• Encode: map visualization properties to
data on the fly
• Reconfigure: multiple views of the same
data
Visualization design goals
Data
• Select and filter: tight-knit integration with
R/Bioconductor
• (current work) filters on visualization
propagate to data environment
Model
• New 'measurements' the result of
modeling; suggested by data context
Metagenomic Visualization
• How to effectively navigate large datasets
where features are organized hierarchically?
• Metaviz: browser-based, interactive
exploratory analysis of metagenomic
data
• Connection to R/Bioconductor with
metavizr package
• Built on metagenomeSeq and
metagenomeFeatures infrastructure
Metaviz
• Exploration of hierarchically organized
features
• Geared towards 16S for now
– Hierarchical organization relevant to WGS
• Integration is a big part of design
– Framework designed for data integration
Acknowledgements
Brianna Lindsey, O. Colin Stine, Owen White, Anup Mahurkar: University of Maryland Baltimore
Jim Nataro: University of Virginia
NIGMS, Genentech
Florin Chelaru
(now @ MIT)
Joseph Paulson
(now @ Harvard)
Mihai Pop
(@ UMD)
Hmp 201512

Hmp 201512

  • 1.
    Statistical and VisualizationMethods for Metagenomic Analysis Héctor Corrada Bravo Center for Bioinformatics and Computational Biology
  • 2.
    • metagenomeSeq – 16Sdifferential abundance – R/Bioconductor infrastructure for metagenomic assays – Longitudinal data • metagenomicFeatures – Incipient attempt regularizing 16S feature annotations in R/Bioconductor – E.g., greengenes13.5MgDb • msd16s – Example data, as infrastructure object
  • 3.
    R/Bioconductor Strengths • Infrastructureobjects – Interoperability, speed up startup time for method development • Strict development practices – Documentation, use cases, vignettes • Annotation infrastructure – Again, interoperability across experiments and data types • Exploratory analysis • Reproducibility – Vignettes, Rmarkdown, etc. • Recently, exploratory and interactive visualization – Shiny, epiviz
  • 4.
    Integrative, visual andcomputational exploratory analysis of genomic data • Browser-based • Interactive • Integration of data • Reproducible dissemination • Communication with R/Bioconductor: epivizr package software systems to support creative exploratory analysis of large genome-wide datasets...
  • 5.
    • Computed Measurements:create new measurements from integrated measurements and visualize
  • 6.
    • Summarization: summarizeintegrated measurements (computed on data subsets)
  • 7.
    Dynamically extensible: Easilyintegrate new data sources, data types and add new visualizations. Data providers define coordinate space
  • 8.
    One interpretation ofBig Data is many sources of relevant contextual data • Easily access/integrate contextual data • Driven by exploratory analysis of immediate data • Iterative process • Visual and computational exploration go hand in hand
  • 9.
    Visualization design goals Context •Integrate and align multiple data sources; navigate; search • Connect: brushing • Encode: map visualization properties to data on the fly • Reconfigure: multiple views of the same data
  • 10.
    Visualization design goals Data •Select and filter: tight-knit integration with R/Bioconductor • (current work) filters on visualization propagate to data environment Model • New 'measurements' the result of modeling; suggested by data context
  • 11.
    Metagenomic Visualization • Howto effectively navigate large datasets where features are organized hierarchically? • Metaviz: browser-based, interactive exploratory analysis of metagenomic data • Connection to R/Bioconductor with metavizr package • Built on metagenomeSeq and metagenomeFeatures infrastructure
  • 15.
    Metaviz • Exploration ofhierarchically organized features • Geared towards 16S for now – Hierarchical organization relevant to WGS • Integration is a big part of design – Framework designed for data integration
  • 16.
    Acknowledgements Brianna Lindsey, O.Colin Stine, Owen White, Anup Mahurkar: University of Maryland Baltimore Jim Nataro: University of Virginia NIGMS, Genentech Florin Chelaru (now @ MIT) Joseph Paulson (now @ Harvard) Mihai Pop (@ UMD)