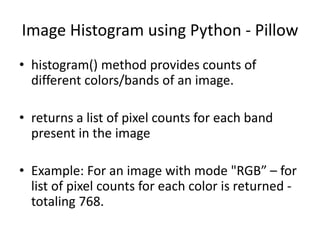
The document discusses how to generate image histograms using the Pillow library in Python. It explains that the histogram() method returns a list of pixel counts for each color band in an image. It provides an example of generating histograms for the red, green, and blue color channels of an RGB image, displaying the counts for each channel in separate figures. The code sample modifies two pixel colors in an image, gets the image histogram, and plots the histograms for each color channel.


![Image Histogram using Python - Pillow
# Modify the color of two pixels
image.putpixel((0,1), (1,1,5))
image.putpixel((0,2), (2,1,5))
# Display the image
image.show()
# Get the color histogram of the image
histogram = image.histogram()
# Take only the Red counts
l1 = histogram[0:256]
# Take only the Blue counts
l2 = histogram[256:512]
# Take only the Green counts
l3 = histogram[512:768]](https://image.slidesharecdn.com/hist-170518095709/85/Histogram-of-Image-Colors-4-320.jpg)
![Image Histogram using Python - Pillow
plt.figure(0)
# R histogram
for i in range(0, 256):
plt.bar(i, l1[i], color = getRed(i), edgecolor=getRed(i), alpha=0.3)
# G histogram
plt.figure(1)
for i in range(0, 256):
plt.bar(i, l2[i], color = getGreen(i), edgecolor=getGreen(i),alpha=0.3)
# B histogram
plt.figure(2)
for i in range(0, 256):
plt.bar(i, l3[i], color = getBlue(i), edgecolor=getBlue(i),alpha=0.3)
plt.show()](https://image.slidesharecdn.com/hist-170518095709/85/Histogram-of-Image-Colors-5-320.jpg)


![[ICLR/ICML2019読み会] A Wrapped Normal Distribution on Hyperbolic Space for Grad...](https://cdn.slidesharecdn.com/ss_thumbnails/slidenaganoicmlyomiv2-190721042557-thumbnail.jpg?width=640&height=640&fit=bounds)