We at JM financial provides m&a advisory on corporate mergers, acquisitions and divestitures as well as debt and equity financing. To explore more about our financial services, click on our website jmfl.com
Entertainment Network Ltd: Stock Price & Q4 Results Of Entertainment Network ...hdfcsecurities1
Entertainment Network Limited: Check out the institutional research report of Q4 result of Entertainment Network Ltd. ENIL’s 4QFY18 was in-line but muted. Revenue declined 3.7% YoY owing to high base and cut in ad volumes.
Cipla Q2 disappoints, gearing up for strong H2FY15EIndiaNotes.com
Valuation‐Expect strong H2FY15E to overcome shortfall in sales and EBITDA, Maintain ‘Accumulate’, retain TP Rs643: Management maintains guidance for mid‐teen sales growth and 21‐22% Ebitda margin in FY15E. Cipla expects growth in sales and EBITDA in H2FY15E due to (a)rise in EU sales, (b)tender offer for respiratory drugs in South Africa and (c)large institutional offtake following capaicty utilisation improvements in will drive exports, while maintaining mid‐ teen growth in domestic formulaitons. The company however expects strong growth in EU from respiratory drugs in 12‐18 months folllowing registrations from local market regulators. We maintain ‘BUY’ and retain TP at Rs643.
JM Financial's loan against shares enables you to borrow funds against listed securities such as mutual funds, shares, insurance and bonds to meet your current financial needs. Visit for more info: https://jmfl.com/what-we-do/fund-based-activities
Financial Ratio Analysis PowerPoint Presentation SlidesSlideTeam
Whenever you want to inform about your financial updates and projections to management and stakeholders, you have the perfect answer to choose from our financial ratio analysis PowerPoint presentation slides. This Financial Ratio Analysis presentation slide has been crafted by our team of artists to accommodate your need to represent financial details like balance sheet of your company, financial achievements of company, liabilities of company, income and profit and loss statements. This multi icons-based template can be used to update wide variety of information to clients and investors such as your financial projections, companies’ achievements and income statement analysis on yearly basis or monthly basis. Financial ratio analysis PPT template is useful to showcase your business strategy, comparison of business income reports, balance sheet updates, profitability, liquidity updates and activity ratios. This financial ratio presentation covers many areas related to financial, general business overview, funding updates or financial dashboards of your enterprise. Acquire an effective counter with our Financial Ratio Analysis PowerPoint Presentation Slides. They are good for convincing critics.
Infomedia (IFM) - equity research initiation reportGeorge Gabriel
Initiation report on Infomedia (IFM) which I published. Overview of key value drivers and analysis of the investment opportunity. Still relevant today. Published for institutional investor market.
JM Financial is one of India’s leading asset reconstruction companies. We provide tailor-made acquisition and corporate debt restructuring services to financial institutions. https://www.jmfl.com/what-we-do/fund-based-activities/asset-reconstruction
JM Financial is one of India’s leading asset reconstruction companies. We provide tailor-made acquisition and corporate debt restructuring services to financial institutions. https://www.jmfl.com/what-we-do/fund-based-activities/asset-reconstruction
JM Financial is one of India’s leading asset reconstruction companies. We provide tailor-made acquisition and corporate debt restructuring services to financial institutions. https://www.jmfl.com/what-we-do/fund-based-activities/asset-reconstruction
JM Financial is one of India’s leading asset reconstruction companies. We provide tailor-made acquisition and corporate debt restructuring services to financial institutions. https://www.jmfl.com/what-we-do/fund-based-activities/asset-reconstruction
Investment banking services enable companies and other issuers to capitalize on today’s opportunities and position themselves for sustained growth. https://www.jmfl.com/what-we-do/investment-banking-and-securities/investment-banking
JM Financial is one of India’s leading asset reconstruction companies. We provide tailor-made acquisition and corporate debt restructuring services to financial institutions. https://www.jmfl.com/what-we-do/fund-based-activities/asset-reconstruction
Need to present financial status of your organization then our financial analysis module PowerPoint Presentation is ideal for you. The income statement PPT slides having multiple slides such as P & L KPIs, balance sheet KPIs, financial projections, key financial ratios, liquidity ratios, cash flow statement KPIs, profitability ratios, activity ratios, solvency ratios, income statement overview and funding updates etc. Our monetary statement PPT presentation goes well with topics like profitability analysis, business impact analysis, financial health, and income statement, balance sheet, statement of cash flow, and financial heath, and financial ratio analysis. You can download this cash flow statement PowerPoint slides to perform some quick profitability analysis. Ratios provided in this presentations can demonstrate how long a company to pay off its account payable. This financial analysis module PowerPoint template is also helpful to showcase how well management is managing its company resources. Our Financial Analysis Module PowerPoint Presentation Slides are exclusively crafted. They can be alluringly awesome.
Show drafts
volume_up
Empowering the Data Analytics Ecosystem: A Laser Focus on Value
The data analytics ecosystem thrives when every component functions at its peak, unlocking the true potential of data. Here's a laser focus on key areas for an empowered ecosystem:
1. Democratize Access, Not Data:
Granular Access Controls: Provide users with self-service tools tailored to their specific needs, preventing data overload and misuse.
Data Catalogs: Implement robust data catalogs for easy discovery and understanding of available data sources.
2. Foster Collaboration with Clear Roles:
Data Mesh Architecture: Break down data silos by creating a distributed data ownership model with clear ownership and responsibilities.
Collaborative Workspaces: Utilize interactive platforms where data scientists, analysts, and domain experts can work seamlessly together.
3. Leverage Advanced Analytics Strategically:
AI-powered Automation: Automate repetitive tasks like data cleaning and feature engineering, freeing up data talent for higher-level analysis.
Right-Tool Selection: Strategically choose the most effective advanced analytics techniques (e.g., AI, ML) based on specific business problems.
4. Prioritize Data Quality with Automation:
Automated Data Validation: Implement automated data quality checks to identify and rectify errors at the source, minimizing downstream issues.
Data Lineage Tracking: Track the flow of data throughout the ecosystem, ensuring transparency and facilitating root cause analysis for errors.
5. Cultivate a Data-Driven Mindset:
Metrics-Driven Performance Management: Align KPIs and performance metrics with data-driven insights to ensure actionable decision making.
Data Storytelling Workshops: Equip stakeholders with the skills to translate complex data findings into compelling narratives that drive action.
Benefits of a Precise Ecosystem:
Sharpened Focus: Precise access and clear roles ensure everyone works with the most relevant data, maximizing efficiency.
Actionable Insights: Strategic analytics and automated quality checks lead to more reliable and actionable data insights.
Continuous Improvement: Data-driven performance management fosters a culture of learning and continuous improvement.
Sustainable Growth: Empowered by data, organizations can make informed decisions to drive sustainable growth and innovation.
By focusing on these precise actions, organizations can create an empowered data analytics ecosystem that delivers real value by driving data-driven decisions and maximizing the return on their data investment.
Adjusting primitives for graph : SHORT REPORT / NOTESSubhajit Sahu
Graph algorithms, like PageRank Compressed Sparse Row (CSR) is an adjacency-list based graph representation that is
Multiply with different modes (map)
1. Performance of sequential execution based vs OpenMP based vector multiply.
2. Comparing various launch configs for CUDA based vector multiply.
Sum with different storage types (reduce)
1. Performance of vector element sum using float vs bfloat16 as the storage type.
Sum with different modes (reduce)
1. Performance of sequential execution based vs OpenMP based vector element sum.
2. Performance of memcpy vs in-place based CUDA based vector element sum.
3. Comparing various launch configs for CUDA based vector element sum (memcpy).
4. Comparing various launch configs for CUDA based vector element sum (in-place).
Sum with in-place strategies of CUDA mode (reduce)
1. Comparing various launch configs for CUDA based vector element sum (in-place).
StarCompliance is a leading firm specializing in the recovery of stolen cryptocurrency. Our comprehensive services are designed to assist individuals and organizations in navigating the complex process of fraud reporting, investigation, and fund recovery. We combine cutting-edge technology with expert legal support to provide a robust solution for victims of crypto theft.
Our Services Include:
Reporting to Tracking Authorities:
We immediately notify all relevant centralized exchanges (CEX), decentralized exchanges (DEX), and wallet providers about the stolen cryptocurrency. This ensures that the stolen assets are flagged as scam transactions, making it impossible for the thief to use them.
Assistance with Filing Police Reports:
We guide you through the process of filing a valid police report. Our support team provides detailed instructions on which police department to contact and helps you complete the necessary paperwork within the critical 72-hour window.
Launching the Refund Process:
Our team of experienced lawyers can initiate lawsuits on your behalf and represent you in various jurisdictions around the world. They work diligently to recover your stolen funds and ensure that justice is served.
At StarCompliance, we understand the urgency and stress involved in dealing with cryptocurrency theft. Our dedicated team works quickly and efficiently to provide you with the support and expertise needed to recover your assets. Trust us to be your partner in navigating the complexities of the crypto world and safeguarding your investments.
Levelwise PageRank with Loop-Based Dead End Handling Strategy : SHORT REPORT ...Subhajit Sahu
Abstract — Levelwise PageRank is an alternative method of PageRank computation which decomposes the input graph into a directed acyclic block-graph of strongly connected components, and processes them in topological order, one level at a time. This enables calculation for ranks in a distributed fashion without per-iteration communication, unlike the standard method where all vertices are processed in each iteration. It however comes with a precondition of the absence of dead ends in the input graph. Here, the native non-distributed performance of Levelwise PageRank was compared against Monolithic PageRank on a CPU as well as a GPU. To ensure a fair comparison, Monolithic PageRank was also performed on a graph where vertices were split by components. Results indicate that Levelwise PageRank is about as fast as Monolithic PageRank on the CPU, but quite a bit slower on the GPU. Slowdown on the GPU is likely caused by a large submission of small workloads, and expected to be non-issue when the computation is performed on massive graphs.
Techniques to optimize the pagerank algorithm usually fall in two categories. One is to try reducing the work per iteration, and the other is to try reducing the number of iterations. These goals are often at odds with one another. Skipping computation on vertices which have already converged has the potential to save iteration time. Skipping in-identical vertices, with the same in-links, helps reduce duplicate computations and thus could help reduce iteration time. Road networks often have chains which can be short-circuited before pagerank computation to improve performance. Final ranks of chain nodes can be easily calculated. This could reduce both the iteration time, and the number of iterations. If a graph has no dangling nodes, pagerank of each strongly connected component can be computed in topological order. This could help reduce the iteration time, no. of iterations, and also enable multi-iteration concurrency in pagerank computation. The combination of all of the above methods is the STICD algorithm. [sticd] For dynamic graphs, unchanged components whose ranks are unaffected can be skipped altogether.
Opendatabay - Open Data Marketplace.pptxOpendatabay
Opendatabay.com unlocks the power of data for everyone. Open Data Marketplace fosters a collaborative hub for data enthusiasts to explore, share, and contribute to a vast collection of datasets.
First ever open hub for data enthusiasts to collaborate and innovate. A platform to explore, share, and contribute to a vast collection of datasets. Through robust quality control and innovative technologies like blockchain verification, opendatabay ensures the authenticity and reliability of datasets, empowering users to make data-driven decisions with confidence. Leverage cutting-edge AI technologies to enhance the data exploration, analysis, and discovery experience.
From intelligent search and recommendations to automated data productisation and quotation, Opendatabay AI-driven features streamline the data workflow. Finding the data you need shouldn't be a complex. Opendatabay simplifies the data acquisition process with an intuitive interface and robust search tools. Effortlessly explore, discover, and access the data you need, allowing you to focus on extracting valuable insights. Opendatabay breaks new ground with a dedicated, AI-generated, synthetic datasets.
Leverage these privacy-preserving datasets for training and testing AI models without compromising sensitive information. Opendatabay prioritizes transparency by providing detailed metadata, provenance information, and usage guidelines for each dataset, ensuring users have a comprehensive understanding of the data they're working with. By leveraging a powerful combination of distributed ledger technology and rigorous third-party audits Opendatabay ensures the authenticity and reliability of every dataset. Security is at the core of Opendatabay. Marketplace implements stringent security measures, including encryption, access controls, and regular vulnerability assessments, to safeguard your data and protect your privacy.
As Europe's leading economic powerhouse and the fourth-largest hashtag#economy globally, Germany stands at the forefront of innovation and industrial might. Renowned for its precision engineering and high-tech sectors, Germany's economic structure is heavily supported by a robust service industry, accounting for approximately 68% of its GDP. This economic clout and strategic geopolitical stance position Germany as a focal point in the global cyber threat landscape.
In the face of escalating global tensions, particularly those emanating from geopolitical disputes with nations like hashtag#Russia and hashtag#China, hashtag#Germany has witnessed a significant uptick in targeted cyber operations. Our analysis indicates a marked increase in hashtag#cyberattack sophistication aimed at critical infrastructure and key industrial sectors. These attacks range from ransomware campaigns to hashtag#AdvancedPersistentThreats (hashtag#APTs), threatening national security and business integrity.
🔑 Key findings include:
🔍 Increased frequency and complexity of cyber threats.
🔍 Escalation of state-sponsored and criminally motivated cyber operations.
🔍 Active dark web exchanges of malicious tools and tactics.
Our comprehensive report delves into these challenges, using a blend of open-source and proprietary data collection techniques. By monitoring activity on critical networks and analyzing attack patterns, our team provides a detailed overview of the threats facing German entities.
This report aims to equip stakeholders across public and private sectors with the knowledge to enhance their defensive strategies, reduce exposure to cyber risks, and reinforce Germany's resilience against cyber threats.
Chatty Kathy - UNC Bootcamp Final Project Presentation - Final Version - 5.23...John Andrews
SlideShare Description for "Chatty Kathy - UNC Bootcamp Final Project Presentation"
Title: Chatty Kathy: Enhancing Physical Activity Among Older Adults
Description:
Discover how Chatty Kathy, an innovative project developed at the UNC Bootcamp, aims to tackle the challenge of low physical activity among older adults. Our AI-driven solution uses peer interaction to boost and sustain exercise levels, significantly improving health outcomes. This presentation covers our problem statement, the rationale behind Chatty Kathy, synthetic data and persona creation, model performance metrics, a visual demonstration of the project, and potential future developments. Join us for an insightful Q&A session to explore the potential of this groundbreaking project.
Project Team: Jay Requarth, Jana Avery, John Andrews, Dr. Dick Davis II, Nee Buntoum, Nam Yeongjin & Mat Nicholas
Best best suvichar in gujarati english meaning of this sentence as Silk road ...
Mindtree 1QFY18
1. Anand Rathi Share and Stock Brokers Limited (hereinafter “ARSSBL”) is a full-service brokerage and equities-research firm and the views expressed therein are solely of
ARSSBL and not of the companies which have been covered in the Research Report. This report is intended for the sole use of the Recipient. Disclosures and analyst
certifications are present in the Appendix.
Anand Rathi Research India Equities
Technology
Company Update
India I Equities
Key financials (YE Mar) FY15 FY16 FY17 FY18e FY19e
Sales (` m) 35,461 46,730 52,364 53,128 57,075
Net profit (` m) 5,322 5,523 4,160 4,695 5,459
EPS (`) 31.5 31.6 24.8 28.0 32.5
Growth (%) 22.6 0.2 -21.6 12.8 16.3
PE (x) 16.1 16.0 20.4 18.1 15.6
PBV (x) 4.0 3.7 3.3 3.0 2.7
RoE (%) 27.6 24.3 16.7 17.3 18.3
RoCE (%) 23.6 21.1 15.1 12.9 14.8
Dividend yield (%) 1.7 2.0 1.9 2.1 2.5
Net debt/equity (x) -0.4 -0.1 -0.3 -0.4 -0.5
Source: Company, Anand Rathi Research
Mohit Jain
Research Analyst
+9122 6626 6531
mohitjain@rathi.com
Shobit Singhal
Research Associate
+9122 6626 6511
shobitsinghal@rathi.com
`
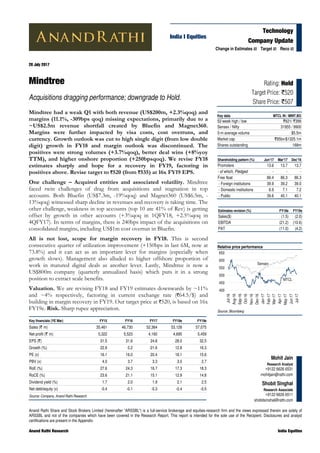
Rating: Hold
Target Price: `520
Share Price: `507
Key data MTCL IN / MINT.BO
52-week high / low `621/ `399
Sensex / Nifty 31955 / 9900
3-m average volume $5.5m
Market cap `85bn/$1325.1m
Shares outstanding 168m
Shareholding pattern (%) Jun'17 Mar'17 Dec'16
Promoters 13.6 13.7 13.7
- of which, Pledged - - -
Free float 86.4 86.3 86.3
- Foreign institutions 39.9 39.2 39.0
- Domestic institutions 6.9 7.1 7.2
- Public 39.6 40.1 40.1
20 July 2017
Mindtree
Acquisitions dragging performance; downgrade to Hold.
Mindtree had a weak Q1 with both revenue (US$200m, +2.3%qoq) and
margins (11.1%, -309bps qoq) missing expectations, primarily due to a
~US$2.5m revenue shortfall created by Bluefin and Magnet360.
Margins were further impacted by visa costs, cost overruns, and
currency. Growth outlook was cut to high single digit (from low double
digit) growth in FY18 and margin outlook was discontinued. The
positives were strong volumes (+3.7%qoq), better deal wins (+8%yoy
TTM), and higher onshore proportion (+250bpsqoq). We revise FY18
estimates sharply and hope for a recovery in FY19, factoring in
positives above. Revise target to `520 (from `535) at 16x FY19 EPS.
One challenge – Acquired entities and associated volatility. Mindtree
faced twin challenges of drag from acquisitions and stagnation in top
accounts. Both Bluefin (US$7.3m, -19%qoq) and Magnet360 (US$6.5m, -
13%qoq) witnessed sharp decline in revenues and recovery is taking time. The
other challenge, weakness in top accounts (top 10 are 41% of Rev) is getting
offset by growth in other accounts (+3%qoq in 1QFY18, +2.5%qoq in
4QFY17). In terms of margins, there is 240bps impact of the acquisitions on
consolidated margins, including US$1m cost overrun in Bluefin.
All is not lost, scope for margin recovery in FY18. This is second
consecutive quarter of utilization improvement (+150bps in last 6M, now at
73.8%) and it can act as an important lever for margins (especially when
growth slows). Management also alluded to higher offshore proportion of
work in matured digital deals as another lever. Lastly, Mindtree is now a
US$800m company (quarterly annualized basis) which puts it in a strong
position to extract scale benefits.
Valuation. We are revising FY18 and FY19 estimates downwards by ~11%
and ~4% respectively, factoring in current exchange rate (`64.5/$) and
building in margin recovery in FY19. Our target price at `520, is based on 16x
FY19e. Risk. Sharp rupee appreciation.
Relative price performance
Source: Bloomberg
MTCL
Sensex
400
450
500
550
600
650
Jul-16
Aug-16
Sep-16
Oct-16
Nov-16
Dec-16
Jan-17
Feb-17
Mar-17
Apr-17
May-17
Jun-17
Jul-17
Estimates revision (%) FY18e FY19e
Sales($) (1.5) (2.0)
EBITDA (21.2) (10.6)
PAT (11.0) (4.2)
Change in Estimates Target Reco
4. 20 July 2017 Mindtree – Acquisitions dragging performance; downgrade to Hold.
Anand Rathi Research 4
Conference call highlights
Business
Revenue growth was impacted owing to volatility among few clients,
slower ramp up of the deals, and ramp-down of few projects in Bluefin
and Magnet 360.
EBITDA margins impacted due to visa cost (-150 bps), currency
headwinds (-90 bps) and losses in Bluefin and Magnet 360 (-70bps).
Bluefin quarterly revenue run rate stood at USD 7.3m, while Magnet
360 revenue run rate stood at USD 6.5m. Both the entitiesare expected
to face volatility in revenues. Within the two, Magnet360 is expected to
recover faster as it is only facing delays in project closures. Bluefin is
facing execution challenges – including cost overruns in fixed rice
project.
Ex subsidiaries and currency movements, Mindtree expects to improve
its EBITDA margins in FY18.
Out of 2 large deals won in Q3 FY 17 one customer is progressing as
per plan and has started contributing to revenues in this quarter. But
the other customer is a quarter behind schedule due to evolving
regulatory environment in the US.
70% of employees will receive salary hike in Q2.Average salary hike in
offshore would be 5.5%, while onshore it would be 1.8%. This will be
absorbed in 2Q as visa expenses will not be there.
There is a churn in top accounts and hence, top 2-10 accounts look
stagnant. However, with new clients coming in the top 10 category,
company believes that growth will return in top accounts in FY18.
The Company entered into a payment resolution agreement with
the erstwhile shareholders of one of the subsidiaries.
Consequently, `374m representing liability no longer required
and written back has been recognised under other income.
Business Outlook
Company has revised revenue growth guidance for FY18 to high single
digit from low double digit and expects organic business to perform
well.
Margin guidance was discontinued for the consolidated entity due to
extreme volatility in the two subsidiaries. (7% of Revenues)
7. 20 July 2017 Mindtree – Acquisitions dragging performance; downgrade to Hold.
Anand Rathi Research 7
Valuations
The stock trades at 15.6x FY19e EPS of`32.4. This, we think, is fair, given
that Mindtree is one of the better mid-sized IT companies with the
potential to touch $1bn by 2020. Also, it enjoys a strong balance sheet and
has strong free-cash-flow generation.
It is currently exhibiting volatility on account of weaknesses in its top
clients but the deal wins in the last six months suggest its ability to compete
in a tough environment and return to industry-level growth.
Also, it has margin levers in the business, primarily the employee-pyramid
correction and utilisation to absorb headwinds in margins. At present,
acquisitions are dragging down the performance but are expected to
recover in FY18.
Fig 15 – Change in estimates
FY18 FY19
New Old Chg % New Old Chg %
Revenues ($m) 824 837 (1.5) 885 903 (2.0)
Revenues (`m) 53,128 56,052 (5.2) 57,075 60,510 (5.7)
EBITDA (`m) 6,655 8,441 (21.2) 8,201 9,172 (10.6)
EBITDA Margin % 12.5% 15.1% -253 bps 14.4% 15.2% -79 bps
EBIT (`m) 4,828 6,530 (26.1) 6,204 7,082 (12.4)
EBIT Margin % 9.1% 11.7% -256 bps 10.9% 11.7% -83 bps
PBT 6,217 7,090 (12.3) 7,335 7,744 (5.3)
Net profit 4,695 5,273 (11.0) 5,459 5,698 (4.2)
Source: Anand Rathi Research
We expect Mindtree to recoup in FY18 some of the margin erosion it
suffered in 1QFY18, leading to FY18 margins trending toward 12.5%. We
value it based on a target PE of 16x FY19e EPS, similar to other
companies in Indian IT, which we like due to their quality management,
business and corporate governance (Persistent, Cyient).
Fig 16 – PE band
Source: Bloomberg, Anand Rathi Research
Risks
Sharp rupee appreciation.
0.0
5.0
10.0
15.0
20.0
25.0
30.0
Apr-13
Jul-13
Oct-13
Jan-14
Apr-14
Jul-14
Oct-14
Jan-15
Apr-15
Jul-15
Oct-15
Jan-16
Apr-16
Jul-16
Oct-16
Jan-17
Apr-17
Jul-17
PERatio(1yearforward)
8. Appendix
Analyst Certification
The views expressed in this Research Report accurately reflect the personal views of the analyst(s) about the subject securities or issuers and no part of the
compensation of the research analyst(s) was, is, or will be directly or indirectly related to the specific recommendations or views expressed by the research
analyst(s) in this report. The research analysts are bound by stringent internal regulations and also legal and statutory requirements of the Securities and Exchange
Board of India (hereinafter “SEBI”) and the analysts’ compensation are completely delinked from all the other companies and/or entities of Anand Rathi, and have
no bearing whatsoever on any recommendation that they have given in the Research Report.
Important Disclosures on subject companies
Rating and Target Price History (as of 19 July 2017)
Date Rating
TP
(`)
Share
Price (`)
1 11-Feb-14 Buy 463 365
2 01-Apr-14 Buy 438 339
3 04-Jun-14 Buy 450 390
4 12-Jun-14 Buy 475 432
5 04-Jul-14 Hold 475 426
6 18-Jul-14 Buy 500 441
7 20-Aug-14 Sell 500 508
8 01-Oct-14 Sell 575 589
9 16-Oct-14 Hold 585 518
10 05-Jan-15 Sell 640 636
11 20-Jan-15 Sell 680 706
12 09-Apr-15 Sell 655 733
13 17-Jul-15 Sell 640 615
14 19-Jan-16 Sell 690 735
15 19-Apr-16 Sell 710 731
16 19-Jul-16 Hold 650 614
17 06-Sep-16 Buy 630 525
18 24-Oct-16 Hold 550 479
19 20-Jan-17 Hold 535 485
20 21-Apr-17 Buy 535 443
Anand Rathi Ratings Definitions
Analysts’ ratings and the corresponding expected returns take into account our definitions of Large Caps (>US$1bn) and Mid/Small Caps (<US$1bn) as described
in the Ratings Table below:
Ratings Guide (12 months)
Buy Hold Sell
Large Caps (>US$1bn) >15% 5-15% <5%
Mid/Small Caps (<US$1bn) >25% 5-25% <5%
Research Disclaimer and Disclosure inter-alia as required under Securities and Exchange Board of India (Research Analysts) Regulations, 2014
Anand Rathi Share and Stock Brokers Ltd. (hereinafter refer as ARSSBL) (Research Entity) is a subsidiary of Anand Rathi Financial Services Ltd. ARSSBL is a
corporate trading and clearing member of Bombay Stock Exchange Ltd, National Stock Exchange of India Ltd. (NSEIL), Multi Stock Exchange of India Ltd (MCX-
SX), United Stock Exchange and also depository participant with National Securities Depository Ltd (NSDL) and Central Depository Services Ltd. ARSSBL is
engaged in the business of Stock Broking, Depository Participant and Mutual Fund distributor.
The research analysts, strategists, or research associates principally responsible for the preparation of Anand Rathi research have received compensation based
upon various factors, including quality of research, investor client feedback, stock picking, competitive factors and firm revenues.
General Disclaimer: This Research Report (hereinafter called “Report”) is meant solely for use by the recipient and is not for circulation. This Report does not
constitute a personal recommendation or take into account the particular investment objectives, financial situations, or needs of individual clients. The
recommendations, if any, made herein are expression of views and/or opinions and should not be deemed or construed to be neither advice for the purpose of
purchase or sale of any security, derivatives or any other security through ARSSBL nor any solicitation or offering of any investment /trading opportunity on behalf
of the issuer(s) of the respective security (ies) referred to herein. These information / opinions / views are not meant to serve as a professional investment guide for
the readers. No action is solicited based upon the information provided herein. Recipients of this Report should rely on information/data arising out of their own
investigations. Readers are advised to seek independent professional advice and arrive at an informed trading/investment decision before executing any trades or
making any investments. This Report has been prepared on the basis of publicly available information, internally developed data and other sources believed by
ARSSBL to be reliable. ARSSBL or its directors, employees, affiliates or representatives do not assume any responsibility for, or warrant the accuracy,
completeness, adequacy and reliability of such information / opinions / views. While due care has been taken to ensure that the disclosures and opinions given are
fair and reasonable, none of the directors, employees, affiliates or representatives of ARSSBL shall be liable for any direct, indirect, special, incidental,
consequential, punitive or exemplary damages, including lost profits arising in any way whatsoever from the information / opinions / views contained in this Report.
The price and value of the investments referred to in this Report and the income from them may go down as well as up, and investors may realize losses on any
investments. Past performance is not a guide for future performance. ARSSBL does not provide tax advice to its clients, and all investors are strongly advised to
consult with their tax advisers regarding taxation aspects of any potential investment.
Opinions expressed are our current opinions as of the date appearing on this Research only. We do not undertake to advise you as to any change of our views
expressed in this Report. Research Report may differ between ARSSBL’s RAs and/ or ARSSBL’s associate companies on account of differences in research
methodology, personal judgment and difference in time horizons for which recommendations are made. User should keep this risk in mind and not hold ARSSBL,
its employees and associates responsible for any losses, damages of any type whatsoever.
MindTree
20
1
2
3
8
4
5 6
7
9
10
11
12
13
14
15
16
17
18 19
-
100
200
300
400
500
600
700
800
900
Jan-14
Mar-14
May-14
Jul-14
Sep-14
Nov-14
Jan-15
Mar-15
May-15
Jul-15
Sep-15
Nov-15
Jan-16
Mar-16
May-16
Jul-16
Sep-16
Nov-16
Jan-17
Mar-17
May-17
Jul-17