
Recommended
More Related Content
What's hot
What's hot (20)
Similar to Heart structure and Cardiac cycle
Similar to Heart structure and Cardiac cycle (20)
Recently uploaded
Recently uploaded (20)
Heart structure and Cardiac cycle
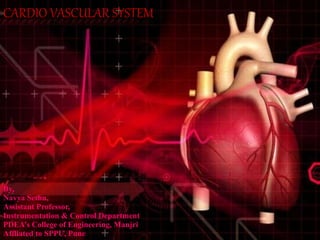
- 1. By, Navya Sethu, Assistant Professor, Instrumentation & Control Department PDEA’s College of Engineering, Manjri Affliated to SPPU, Pune CARDIO VASCULAR SYSTEM
- 2. Functions of CVS - Transport system of body. - It carries : 1. O2 from lungs to tissues. 2. CO2 from tissues to lungs. 3. Foods from GIT to tissues. 4. Waste products from cells to kidney. 5. Hormones from endocrine glands to other organs. 6. Surplus heat from different parts of body to skin.
- 3. Blood travels through the heart twice before returning to the body The double circulatory system
- 4. • Pulmonary Circulation – Carries blood to lungs and back to the heart • Systemic Circulation – Carries blood to body and back to the heart Two Pathways
- 5. Circulatory System Structures • Heart • Blood Vessels – Arteries – Veins – Capillaries • Blood
- 6. Arteries: carries blood away from heart – Large – Thick-walled, Muscular – Elastic – Oxygenated blood • Exception Pulmonary Artery – Carried under great pressure – Steady pulsating Arterioles: smaller vessels, enter tissue • Small branches of arteries. • Act as control valves through which blood supplies to capillaries.
- 7. • Coronary artery – Supply blood to heart muscles. – About 5-7% of blood flows though the coronary arteries.
- 8. Capillaries – Smallest vessel – Microscopic – Walls one cell thick – Nutrients and gases, hormones, electrolytes etc. diffuse here
- 9. Veins: Carries blood to heart – Serves as reservoir of blood. – Carries blood that contains waste and CO2 • Exception pulmonary vein – Blood not under much pressure – Valves to prevent much gravity pull Venules: larger than capillaries • Collect blood from capillaries . • Gives deoxygenated blood to veins.
- 10. Structure of Heart • Four chambers – Two upper (Atria) • Right Atria • Left Atria – Two lower (Ventricles) • Right Ventricle • Left Ventricle
- 11. • Two atria are seperated by inter-atrial septum. • Two ventricles are seperated by inter-ventricular septum. • Atria is seperated from ventricles by atrio-ventricular septum. • Heart is enclosed in pericardium, pericardial fluid present in pericardial cavity. • Myocardium- muscular wall of heart, Muscles are arranged in circular and spiral patterns • Endocardium- Lines the internal walls of the heart
- 12. Valves of Heart 4 sets of valves are present in heart. A. Two Atrio-ventricular valves: 1. Rt. Atrio-ventricular valve – Tricuspid valve 2. Lt. Atrio-ventricular valve – Bicuspid valve (Mitral valve) B. Two semilunar valves: 1. Aortic valve 2. Pulmonary valve
- 13. External view of the heart pulmonary artery pulmonary vein coronary artery left ventricle right ventricle inferior vena cava right atrium pulmonary vein aorta superior vena cava
- 14. DIAGRAM
- 15. The vena cava carries deoxygenated blood from the body to the right atrium superior vena cava (transports blood from the head) inferior vena cava (transports blood from rest of body)
- 16. The right atrium collects deoxygenated blood and pumps it to the right ventricle right atrium
- 17. The right ventricle pumps deoxygenated blood to the lungs right ventricle
- 18. The pulmonary artery carries deoxygenated blood from the right ventricle to the lungs aorta
- 19. The septum separates the left and right sides of the heart septum
- 20. The pulmonary veins carry oxygenated blood from the lungs to the left atrium Pulmonary veins
- 21. The left atrium collects the oxygenated blood and pumps it to the left ventricle Left atrium
- 22. The left ventricle pumps oxygenated blood to the body via the aorta Left ventricle
- 23. The aorta carries the oxygenated from the left ventricle to the rest of the body Aorta Aortic arch
- 24. Atrio-ventricular valves prevent backflow of blood into the atria when ventricles contract Bicuspid valve (mitral valve) Tricuspid valves Tendon
- 25. The semi-lunar valves prevent backflow of blood from the arteries into the ventricles Aortic semi-lunar valve Pulmonary semi-lunar valve
- 26. ORIGIN AND CONDUCTION OF HEART BEAT 1. SA-NODE (SINO-ATRIAL NODE) • Called pacemaker as it is first to originate the cardiac impulses & determines the rate of heart beat. • Cardiac impulses conducted along the tract of special cardiac muscle fibres over both the auricles. • Lies in the right atrium at the junction of superior venacava.
- 27. 2. AV-NODE(ATRIO-VENTRICULAR NODE) • Stimulated by the waves of contraction initiated by SA-node. • Generates cardiac impulses, which are conducted to the muscles of ventricles through BUNDLE OF HIS & PURKINJE FIBRES. • Lies in right posterior of inter-atrial septum.
- 28. 3. BUNDLE OF HIS • Arises from AV node, goes towards apex. • At their terminal end, it give branches called PURKINJE FIBRES.
- 32. CARDIAC CYCLE • Sequence of coordinated events which take place during a heartbeat. • Cardiac cycle involves , the phase of contraction called systole & the phase of relaxation called diastole. • A complete heart beat consists of a systole & diastole of both atria and that of both the ventricles. • The two atria contract at the same time, then they relax while the two ventricles simultaneously contract. • The contraction phase of the ventricle chambers is called systole. • The relaxation phase is called diastole. • At a normal heart rate, one cardiac cycle last for 0.8 seconds!
- 33. STEPS INVOLVED IN A CARDIAC CYCLE 1. Atrial systole – contraction of atria 2. Ventricular filling 3. Ventricular systole – first heart sound ‘lubb’ produced with longer duration (0.1 – 0.90 sec.). 4. Ventricular diastole – second heart sound ‘dubb’with shorter duration (0.10 sec.)
- 37. ElectroCardioGraph – Instrument which records the electrical activity of the heart. ElectroCardioGram – The recorded graph from electrocardiograph Provides information about a wide range of cardiac disorders. Used in catheterization laboratories, coronary care units and for routine diagnostic applications in cardiology.
- 39. • Lead Selector – The electrodes are selected two by two according to the lead program • Pre-amplifier – A three or four stage differential amplifier – Have a large negative current feedback, from the end stage to the first stage • Power amplifier – Generally push-pull differential type • Frequency selective network – Usually, an R-C network – Provides necessary damping of the pen motor and is preset by the manufacturer • Auxillary Circuits – Provide a 1mV calibration signal and automatic blocking of the amplifier during a change in position of the lead switch. – May include a speed control circuit for the chart drive motor
- 40. ECG Leads The tracing of voltage difference at ant two electrode sites due to electrical activity of the heart is called a “LEAD” ECG Lead Systems (12-lead system) 1. Bipolar Leads (3) 2. Unipolar Leads (3) 3. Unipolar Chest Leads (6)
- 43. BIPOLAR LIMB LEAD SYSTEM Electrodes are placed in Right Arm, Left Arm and Left Leg Bipolar leads represent the potential difference between two selected sites. LEAD I : P.D between LA & RA LEAD II : P.D between LL & RA LEAD III : P.D between LL & LA An electrode placed in Right Leg is earthed though the ECG machine for • For the electrical protection of the patient • To eliminate electrical interference in the recordings
- 45. In each of these lead positions, QRS of normal heart is such that • R- wave is positive • Lead II produces largest R-wave potential When amplitudes of three limb leads are measured, the R-wave amplitude of Lead II is Lead II = Lead I + Lead III This equation can be represented by the vector relationship, as shown in the equilateral triangle.
- 46. EINTHOVEN TRIANGLE The Einthoven vector contains all the information of the three separate lead components and represents the ‘electrical axis’ of the heart.
- 47. UNIPOLAR LIMB LEAD SYSTEM (AUGMENTED LEAD SYSYTEM) • Measures the electrical activity from one limb at a time • leads that take a composite potential from 3 limbs simultaneously, where signal from 2 limbs are summed in a resistor network and then applied to an inverting amplifier input and remaining limb electrode is applied to the non-inverting input
- 48. • Lead aVR - RA connected to non-inverting input while LA and LL are summed at inverting input augmented (amplified) Voltage for Right arm(aVR) • Lead aVL - LA connected to non-inverting input while RA and LL are summed at inverting input augmented (amplified) Voltage for Left arm(aVL) • Lead aVF - LL connected to non-inverting input while RA and LA are summed at inverting input augmented (amplified) Voltage for Foot(aVF)
- 50. BIPOLAR LEADS • Lead I is the voltage difference between the LA and RA electrodes (LA – RA), directed towards LA at 0° • Lead II is the voltage difference between the LL and RA electrodes (LL – RA), directed towards LL at +60° • Lead III is the voltage difference between the LL and LA electrodes (LL – LA), directed towards LL at +120° AUGMENTED UNIPOLAR LEADS • Lead aVR is directed towards the RA electrode (-150°), calculated as follows: aVR = RA – (LA + LL)/2. • Lead aVL is directed towards the LA electrode (-30°) calculated as follows: aVL = LA – (RA+LL)/2 • Lead aVF is directed towards the LL electrode (+90°), calculated as follows: aVF = LL – (LA + RA)/2
- 52. UNIPOLAR CHEST LEADS Constituted by an indifferent electrode resulting from a connection between all three standard limb leads and an exploring electrode placed on 6 points on the chest wall. The indifferent electrode forms the negative terminal and the exploring electrode forms the positive terminal
- 53. Placement of precordial leads– V1 - 4th intercostal space, right of sternum – V2, 4th ICS , left of sternum – V3 - Midway between V2 & V4 – V4 - 5th ICS , midclavicular line – V5 - 5th ICS anterior axillary line – V6 - 5th ICS mid axillary line
- 55. 12 LEAD ECG SYSTEM
- 56. ECG amplifier
- 59. Feature Description Duration RR interval The interval between an R wave and the next R wave; normal resting heart rate is between 60 and 100bpm. 0.6 to 1.2 s P wave During normal atrial depolarization, the main electrical vector is directed from the SA node towards the AV node and spreads from the right atrium to the left atrium. This turns into the P wave on the ECG. 80ms PR interval The PR interval is measured from the beginning of the P wave to the beginning of the QRS complex. The PR interval reflects the time the electrical impulse takes to travel from the sinus node through the AV node and entering the ventricles. The PR interval is, therefore, a good estimate of AV node function. 120 to 200 ms PR segment The PR segment connects the P wave and the QRS complex. The impulse vector is from the AV node to the Bundle of His to the bundle branches and then to the Purkinje fibers. This electrical activity does not produce a contraction directly and is merely traveling down towards the ventricles, and this shows up flat on the ECG. The PR interval is more clinically relevant. 50 to 120 ms QRS complex The QRS complex reflects the rapid depolarization of the right and left ventricles. The ventricles have a large muscle mass compared to the atria, so the QRS complex usually has a much larger amplitude than the P-wave. 80 to 100 ms ST segment The ST segment connects the QRS complex and the T wave. The ST segment represents the period when the ventricles are depolarized. It is isoelectric. 80 to 120 ms
- 60. T wave The T wave represents the repolarization (or recovery) of the ventricles. The interval from the beginning of the QRS complex to the apex of the T wave is referred to as the absolute refractory period. The last half of the T wave is referred to as the relative refractory period (or vulnerable period). 160 ms ST interval The ST interval is measured from the J point to the end of the T wave. 320 ms QT interval The QT interval is measured from the beginning of the QRS complex to the end of the T wave. A prolonged QT interval is a risk factor for ventricular tachyarrhythmias and sudden death. It varies with heart rate and, for clinical relevance, requires a correction for this, giving the QTc. Up to 420 ms in heart rate of 60 bpm U wave The U wave is hypothesized to be caused by the repolarization of the interventricular septum. It normally has a low amplitude, and even more often is completely absent. It always follows the T wave, and also follows the same direction in amplitude. If it is too prominent, suspect hypokalemia, hypercalcemia or hyperthyroidism.