
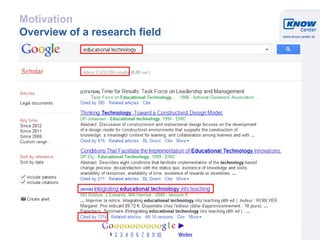
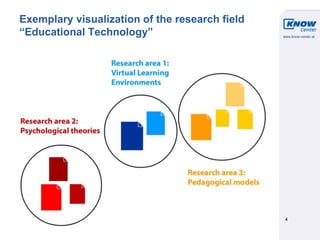
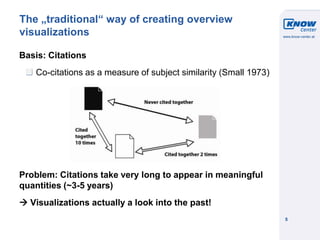
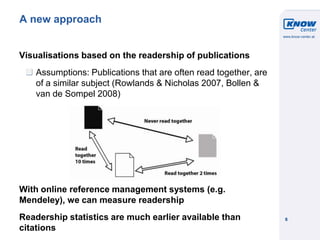
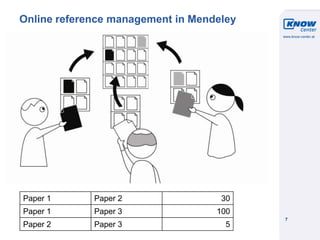
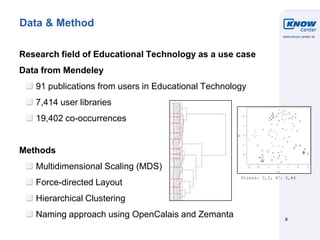
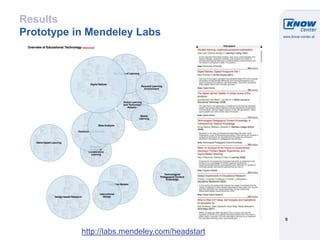
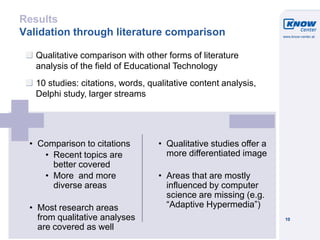

This document summarizes a presentation on using readership statistics from online reference managers like Mendeley to create overview visualizations of academic fields. It notes that traditional visualizations based on citations only show the past due to delays in citations accumulating. Readership data is available earlier and can show more recent topics and diverse areas of a field. The presentation describes a prototype visualization of the educational technology field created from Mendeley data that validated well against other literature analysis methods. It concludes that readership statistics provide a more recent and diverse view of a research field than citations alone.


