
Download to read offline

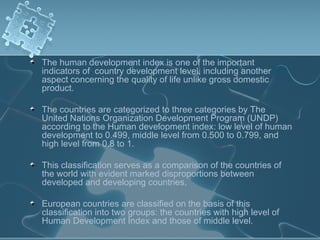
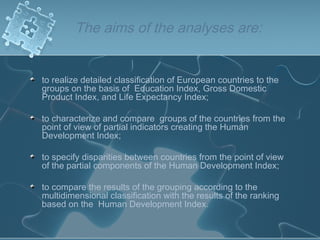
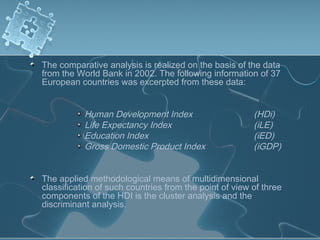
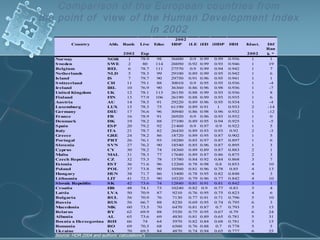
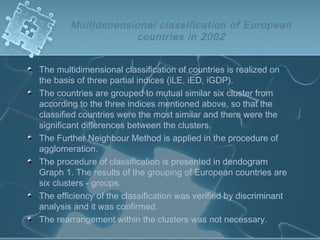
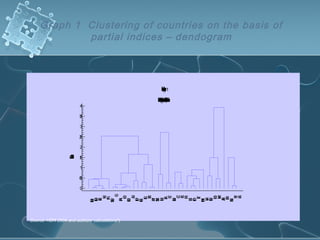
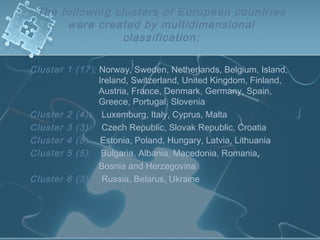
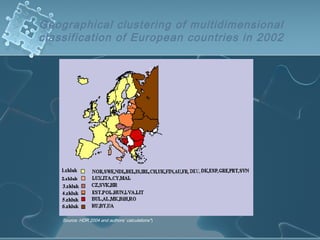
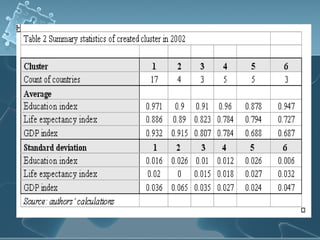
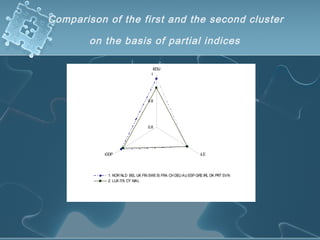

The document analyzes the human development index (HDI) of 37 European countries, categorizing them into low, middle, and high development levels based on their education, life expectancy, and GDP indices. A multidimensional classification reveals six clusters of countries with similar HDI components, confirming significant disparities among them. The conclusion emphasizes that while HDI provides an overall picture, it obscures differences in the underlying components, highlighting the need for further investigation into regional disparities, especially within the new EU member states.


