L&T Q1FY15: Buy on dips for a target of 1573 - HDFC Sec
1. RETAIL RESEARCH Page | 1
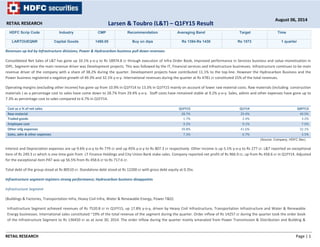
HDFC Scrip Code Industry CMP Recommendation Averaging Band Target Time
LARTOUEQNR Capital Goods 1490.05 Buy on dips Rs 1394-Rs 1430 Rs 1573 1 quarter
Revenues up led by Infrastructure divisions; Power & Hydrocarbon business pull down revenues
Consolidated Net Sales of L&T has gone up 10.1% y‐o‐y to Rs 18974.8 cr through execution of Infra Order Book, improved performance in Services business and value monetisation in
IDPL. Segment‐wise the main revenue driver was Development projects. This was followed by the IT, Financial services and Infrastructure businesses. Infrastructure continues to be main
revenue driver of the company with a share of 38.2% during the quarter. Development projects have contributed 11.1% to the top‐line. However the Hydrocarbon Business and the
Power business registered a negative growth of 49.3% and 32.1% y‐o‐y. International revenues during the quarter at Rs 4781 cr constituted 25% of the total revenues.
Operating margins (excluding other income) has gone up from 10.9% in Q1FY14 to 13.3% in Q1FY15 mainly on account of lower raw material costs. Raw materials (including construction
materials ) as a percentage cost to sales have come down to 28.7% from 29.4% y‐o‐y. Staff costs have remained stable at 9.2% y‐o‐y. Sales, admin and other expenses have gone up to
7.3% as percentage cost to sales compared to 6.7% in Q1FY14.
Cost as a % of net sales Q1FY15 Q1Y14 Q4FY13
Raw material 28.7% 29.4% 40.0%
Traded goods 1.7% 2.4% 3.2%
Employee cost 9.2% 9.1% 7.0%
Other mfg expenses 39.8% 41.6% 32.1%
Sales, adm & other expenses 7.3% 6.7% 3.5%
(Source: Company, HDFC Sec)
Interest and Depreciation expenses are up 9.6% y‐o‐y to Rs 779 cr and up 45% y‐o‐y to Rs 807.3 cr respectively. Other income is up 5.1% y‐o‐y to Rs 277 cr. L&T reported an exceptional
item of Rs 249.3 cr which is one time gain from LT Finance Holdings and City Union Bank stake sales. Company reported net profit of Rs 966.9 cr, up from Rs 458.6 cr in Q1FY14. Adjusted
for the exceptional item PAT was up 56.5% from Rs 458.6 cr to Rs 717.6 cr.
Total debt of the group stood at Rs 80510 cr. Standalone debt stood at Rs 12200 cr with gross debt equity at 0.35x.
Infrastructure segment registers strong performance; Hydrocarbon business disappoints
Infrastructure Segment
(Buildings & Factories, Transportation Infra, Heavy Civil Infra, Water & Renewable Energy, Power T&D)
Infrastructure Segment achieved revenues of Rs 7520.8 cr in Q1FY15, up 17.8% y‐o‐y, driven by Heavy Civil Infrastructure, Transportation Infrastructure and Water & Renewable
Energy businesses. International sales constituted ~19% of the total revenue of the segment during the quarter. Order inflow of Rs 14257 cr during the quarter took the order book
of the Infrastructure Segment to Rs 136450 cr as at June 30, 2014. The order inflow during the quarter mainly emanated from Power Transmission & Distribution and Building &
RETAIL RESEARCH
August 06, 2014
Larsen & Toubro (L&T) – Q1FY15 Result
2. RETAIL RESEARCH Page | 2
Factories businesses. International orders contributed to around 36% of the total order inflow of the segment during the quarter. EBIDTA margin at 10.3% during the quarter ended
June 30, 2014 vis‐à‐vis 9.7% recorded in the corresponding quarter of the previous year. The segment recorded EBIT margins of 7.9% compared to 8.2% y‐o‐y.
Power Segment
(EPC (Coal & Gas), Thermal Power Plant Constr, Critical Piping, Electrostatic Precipitators)
Power Segment recorded revenue of Rs 986.1 cr in Q1FY15, down 32% y‐o‐y due to depleting order book and lower revenue accretion on jobs nearing completion. It reported fresh
orders of Rs 1588 cr in Q1FY15 up 94% y‐o‐y on the back of international orders bagged by the segment. The Order Book of the Segment declined 4% on a y‐o‐y basis and stood at Rs
16711 cr as at June 30, 2014. Segment EBIDTA margin remained more or less stable at 20.3% compared to 20.6% y‐o‐y. However, EBIT margins stood at 14.3% compared to 17.8% y‐
o‐y.
Metallurgical & Material Handling (MMH) Segment
(Ferrous, Non Ferrous, Bulk Material Handling)
Revenues of MMH Segment during the quarter stood at Rs 941 cr, down 16.3% y‐o‐y on account of reduced opening order book and delay in receipt of new orders. MMH Segment
secured fresh orders of Rs 508 cr during the quarter ended June 30, 2014, registering a decline of 38% over the corresponding quarter of the previous year. The order inflow of the
segment was lower during the quarter on account of deferment of certain targeted orders and prevailing subdued business prospects in the sector. The Order Book of the Segment
declined by 40% on a y‐o‐y basis and stood at Rs 9375 cr as on Q1FY15. The EBIDTA margin of the segment stood at 12.5% compared to 15.7% in Q1FY14. EBIT margins stood at 9.5%
compared to 12.4% y‐o‐y.
Heavy Engineering Segment
(Process Plant Equipment, Nuclear Power Plant Equipment, Defence & Aerospace)
Heavy Engineering Segment achieved revenues of Rs 862.5 cr registering an y‐o‐y decline of 4% mainly on account of delayed order inflow and depleted order book. International
sales constituted 28% of the total customer revenue during the quarter. Heavy Engineering Segment secured fresh orders valued Rs 2566 cr, in Q1FY15 registering a growth of 56% y‐
o‐y. International orders constituted 18% of the total order inflow of the segment. The Order Book of the Segment grew 3% on a y‐o‐y basis and stood at Rs 8579 cr as at June 30,
2014. The EBIDTA margin of the segment improved to 12.7% compared to 9.6% y‐o‐y driven by progress on jobs. EBIT margins stood at 3.2% compared to 4% y‐o‐y.
Electrical & Automation (E&A) Segment
(Electrical Standard Products, Metering & Protection, Electrical System & Equipment, Control & Automation)
This segment recorded a top‐line of Rs 1054.3 cr in Q1FY15, up 4.2% y‐o‐y on the backdrop of sluggish market conditions. International sales constituted 35% of the total customer
revenue. EBIDTA Margin of the E&A Segment at 8.9% in Q1FY15 compared to 12.5% y‐o‐y due to change in sales mix during the quarter. EBIT margins stood at 4.9% in Q1FY15
compared to 8.4% y‐o‐y.
Hydrocarbon Segment
3. RETAIL RESEARCH Page | 3
(Upstream, Mid & Downstream, Construction & Pipelines)
Hydrocarbon reported a turnover of Rs 1557.3 cr, down 49% y‐o‐y mainly on account of lower opening order book and deferment of project awards. International sales constituted
51% of the sales. Hydrocarbon Segment secured fresh orders valued Rs 5704 cr in Q1FY15 registering a growth of 80% y‐o‐y driven by a large size international order. International
orders constituted 94% of the total order inflow of the segment. Order Book of the segment grew 32% y‐o‐y and stood at Rs 14580 cr in Q1FY15.
The EBIDTA margin of the segment was negative vis‐à‐vis positive margin of 5.7% in Q1FY14. The operating margin was adversely impacted due to time and cost overruns on
international jobs arising out of stringent contractual conditions, changes in specifications by customers, sharp increase in local labour costs and certain unforeseen execution
complexities. A number of measures have since been taken for strengthening international organization, risk management and contract management to achieve on‐course execution
of international jobs.
IT & Technology Services Segment
IT & Technology Services Segment reported top‐line of Rs 1750.9 cr up 21.8% y‐o‐y. International sales constituted 95% of the total revenue of the segment. The EBIDTA Margin of
the IT&TS Segment at 20.2% for the quarter ended June 30, 2014 recorded a decline over the 25.8% earned during the corresponding quarter of the previous year due to relatively
higher onsite revenue mix and increased staff cost on building of sales force. EBIT margins stood at 16.9% compared to 23% y‐o‐y.
Developmental Projects Segment
Developmental Projects Segment recorded revenue of Rs 2190 cr up from Rs 324.2 cr in Q1FY14. During the quarter, the Company has monetized a part of its developmental
projects portfolio at a gain of Rs 1350 cr leading to significant revenue growth. The EBIDTA Margin of the Developmental Projects Segment for the quarter ended June 30, 2014 was
consequently higher at 67.9% over 42.4% earned during the corresponding quarter of the previous year. EBIT margins stood 56.2% in Q1FY15.
Financial Services Segment
Financial Services Segment recorded revenue of Rs 1482 cr in Q1FY15 registering a y‐o‐y growth of 24% driven by growth in loan book and disbursements. The EBITDA margin of the
Financial Services Segment for the quarter ended June 30, 2014 stood at 15.5% over 15.3% earned during the corresponding quarter of the previous period. Segmental EBIT margins
stood at 22.9% compared to 13.4% in Q1FY14.
“Others” Segment
“Others” segment comprises Realty, Shipbuilding, Construction & Mining Equipment and Industrial Machinery & Product businesses. Top‐line in the segment stood at Rs 1335.8 cr in
Q1FY15, a growth of 26.8% y‐o‐y led by Realty and Shipbuilding businesses. International sales constituted 21% of the total customer revenue of the segment. During the quarter
ended June 30, 2014, the segment EBIDTA margin improved to 20.6% as compared to 0.6% during the corresponding quarter of the previous year consequent to improved
performance of Realty and Shipbuilding businesses. EBIT margins stood at 14.2% in Q1FY15.
Steady Growth in Order Inflows
Particulars (Rs in bn) Q1FY15 Q1FY14 % chg
Order inflow 334 300 11%
4. RETAIL RESEARCH Page | 4
Order Book 1954 1730 13%
(Source: Company, HDFC Sec)
The Company successfully won fresh orders worth Rs 334 bn at consolidated level in Q1FY15 registering a y‐o‐y growth of 11 %, on a large base. The International order inflow during the
quarter at Rs 147 bn grew more than 2 times on a y‐o‐y basis, constituting 44% of the total order inflow. Major orders during the quarter were secured by the Infrastructure,
Hydrocarbon and Heavy Engineering segments. Consolidated Order Book of the group stood at Rs 1954 bn. International Order Book constituted 26% of the total Order Book.
Other highlights
• FY15 guidance ‐ Consolidated intake +20%, consolidated revenue +15% and consolidated EBIDTA margins (excluding Services) to be vulnerable by 50‐100bps.
L&T IDPL has successfully raised funds: i) FDI Investment (Canada Pension Fund, INR20b in two tranches) ii) Asset sale (Dhamra Port at EV of INR55b ‐ 50% stake, etc). Also, the
management stated that the intent is to unlock value in L&T Infotech and L&T Technology through a listing by July 2016. The transactions will also provide growth capital. REIT
structure for monetizing the six operational road projects continues to under evaluation.
• Effective April 1, 2014, the Company has revised the useful life of fixed assets based on Schedule II to the Companies Act, 2013 for the purposes of providing depreciation on fixed
assets. Accordingly, the carrying amount of the assets as on April 1, 2014 has been depreciated over the remaining revised useful life of the fixed assets. Consequently, the
depreciation for the quarter ended June 30, 2014 is higher and the profit before tax is lower to the extent of Rs. 132.82 cr.
Concerns
• Political Instability, government ability to fund infrastructure
• Safety concerns in Nuclear Power projects
• Multiplier effect of loss making Discoms
• Technology Acquisition
• Aggressive Competition
• Long bid‐to‐award timelines
• Land acquisition – increasingly sensitive issue
• Environmental and mining leases clearances.
• Value chain migration
• Slowdown in economy, decelerating Investment plans
• High debt in consolidated accounts accompanied by poor margin visibility in infra subsidiaries
Valuation and Outlook
L&T is among the most diversified engineering & infrastructure developer in the country with a presence across all segments of infrastructure i.e. power, roads, hydrocarbons &
process industries. It is also planning to scale up in niche areas like defence, nuclear power and shipbuilding, which have the potential to add significantly to overall revenues in the
next three to five years (for instance, opening of defence FDI and ordering can help L&T achieve scale of 5x in terms of defence segment revenues from current Rs 1000 crore run
rate). Over the last couple of years, L&T has added capacity to meet increasing volumes. For instance, the company had added 5000 MW of power equipment facility, the heavy
engineering facility in Oman (FY10) and recently added complex shipbuilding facility.
In Q1FY15, L&T reported consolidated revenues of Rs 18974.8 cr, up 10.1% y‐o‐y through execution of Infra Order Book, improved performance in Services business and value
monetization in IDPL. Operating margins have improved to 13.3% from 10.9% y‐o‐y. Company reported net profit of Rs 966.9 cr, up from Rs 458.6 cr (an increase of +100% y‐o‐y) in
5. RETAIL RESEARCH Page | 5
Q4FY14. This included an exceptional income of Rs 249.3 cr on account of stake sale in LTFHL and City Union. If this were to be excluded, consolidated net profit stood at Rs 717.6 cr.
Order inflows were up 11% y‐o‐y at Rs 334 bn while Order Book stood at Rs 1954 bn (~2.3x Sales) up 13% over last year.
L&T management feels continuing challenges in infrastructure bottlenecks, resources availability, and high fiscal and current account deficit are key concerns for resumption of capex
spend. Moreover, constraints to the speedy implementation of the reform process are adversely impacting the investment climate in India. L&T is exposed to several levers across
business/geographic segments and has emerged as the E&C partner of choice in India, which provides a robust foundation to capitalize on the next leg of investment cycle. Hence,
despite the increased skepticism on the overseas business, we remain positive on L&T in the long term. Manufacturing businesses (like Shipyard, Power BTG, Forgings etc) also
present interesting possibilities in the longer term. Many of these businesses are difficult to replicate and L&T is strongly positioned as a dominant player.
The management stated that FY15 is also likely to be challenging for the business and the attempt will be to complete the projects which are now in final stages. The new orders
factor in the initial learnings in the project bids and hence the business should bounce back to a more normative profit levels going forward. The management has set out 2016 as the
timeline for listing of L&T Infotech. LT has recently sold Dhamra port to Adani Ports for an enterprise value of Rs 55b; L&T booked capital gains of Rs13.5b in Q1FY15. Plans are in place
to raise ~Rs 40b in next 2 years to fund projects in IDPL.
The core sectors such as infrastructure, power, minerals & metals, defence, oil & gas which hold business prospects for the Company await fresh impetus through focused policy
decisions and rigorous implementation. The development agenda of the new government is expected to remove the bottle‐necks presently stifling the growth in India and create an
enabling business environment.
On the international front, the Middle East region offers promising prospects in infrastructure and oil & gas sectors. L&T’s overseas expansion has reduced its exposure to the weak
capex cycle in India. However, weak Hydrocarbon business performance in Q1FY15 highlight the overseas risk hitting the P&L. L&T took provisions (including foreseeable losses) of Rs9
bn for six Middle East projects in the Hydrocarbon subsidiary, pushing the subsidiary into losses on the EBITDA line and bringing home the risk on the rising foreign backlog (26% of
total now). The hydrocarbon order book of Rs.146 bn still contains about Rs.40‐50 bn of at‐risk orders, which may get executed in FY15 at zero percent EBITDA margin.
We are revising FY15 estimates considering underlying risk in hydrocarbon business in near term. We are also introducing FY16 estimates. FY16 could be better for the company both
in topline growth and margin improvement but we expect the pace of improvement to be more gradual in the coming two years. New government’s focus on revival of capex cycle
will benefit L&T the most. L&T is comfortably placed given strong order intake and diversified exposure. Value unlocking through stake sale and listing of subsidiaries could positively
impact RoEs. L&T is well placed to capitalize on long‐term infrastructure demand. While we remain positive on the stock for the longer term we expect the company to face some
headwinds in the near‐term post the recent run up it has had on the bourses.
In our Q4FY14 result dated June 4, 2014 we had recommended investors to buy at CMP and add on dips to Rs.1515 ‐ 1545 band (25x‐25.5xFY15E EPS) for a target of Rs.1757 (29x
FY15E EPS) in 1 quarter. Post the update the stock touched a high of Rs 1776.6 thus achieving our target. After that it made a low of Rs 1463 on 01st
August 2014.
Investors could look to buy the stock on dips to Rs 1394‐1430 band (19.5x‐20xFY16E EPS) for a target of Rs.1573 (22x FY16E EPS) in 1 quarter. Over a longer period (3‐4 quarters)
the stock price can move up to Rs.1716 (24xFY16E EPS).
Financials Consolidated:
(Rs in crs) FY10 FY11 FY12 FY13 FY14 FY15(E) FY15(RE) FY16E
Total Income 43514 53012.6 65142.1 75593.9 86110.3 97304.7 93983.4 108539.4
EBIDTA (incl OI) 6439 8646.2 9712.9 10955.1 11715.0 13622.7 12148.6 15247.7
EBIDTA (%) 14.8% 16.3% 14.9% 14.5% 13.6% 14.0% 12.9% 14.0%
Reported PAT 3797 4456.2 4693.7 5205.7 4902.0 5604.7 5123.9 6633.7
7. RETAIL RESEARCH Page | 7
Segmental Revenue Q1FY15 Q1FY14 % chg Q4FY14 % chg
Infrastructure 7520.8 6383.3 17.8 14272.3 ‐47.3
Power 986.1 1451.6 ‐32.1 1480.9 ‐33.4
Metallurgical and Material Handling 940.7 1123.6 ‐16.3 1828.5 ‐48.6
Heavy Engineering 862.5 896.5 ‐3.8 1449.6 ‐40.5
Electrical & Automation 1054.3 1012.0 4.2 1535.4 ‐31.3
Hydrocarbon 1557.3 3074.6 ‐49.3 1858.7 ‐16.2
IT 1750.9 1437.2 21.8 1722.3 1.7
Financial Ser 1482.7 1190.6 24.5 1393.0 6.4
Dev Prj 2190.6 324.2 575.7 675.4 224.3
Others 1335.9 1053.2 26.8 1672.3 ‐20.1
Total 19681.6 17946.7 9.7 27888.3 ‐29.4
Less Intersegment revenue 558.2 527.2 5.9 935.7 ‐40.3
Total Segment Revenue 19123.3 17419.6 9.8 26952.6 ‐29.0
% Split in revenue Q1FY15 Q1FY14 Q4FY14
Infrastructure 38.2% 35.6% 51.2%
Power 5.0% 8.1% 5.3%
Metallurgical and Material Handling 4.8% 6.3% 6.6%
Heavy Engineering 4.4% 5.0% 5.2%
Electrical & Automation 5.4% 5.6% 5.5%
Hydrocarbon 7.9% 17.1% 6.7%
IT 8.9% 8.0% 6.2%
Financial Ser 7.5% 6.6% 5.0%
Dev Prj 11.1% 1.8% 2.4%
Others 6.8% 5.9% 6.0%
Total 100.0% 100.0% 100.0%
Segmental PBIT Q1FY15 Q1FY14 % chg Q4FY14 % chg
Infrastructure 590.7 526.3 12.2 1453.5 ‐59.4
Power 141.4 257.9 ‐45.2 394.3 ‐64.1
Metallurgical and Material Handling 89.7 139.2 ‐35.5 304.8 ‐70.6
Heavy Engineering 27.7 36.0 ‐22.9 245.8 ‐88.7
Electrical & Automation 51.3 85.4 ‐39.9 217.9 ‐76.4
Hydrocarbon ‐942.1 125.7 ‐849.7 ‐114.6 722.3
IT 296.3 331.1 ‐10.5 287.9 2.9
Financial Ser 339.5 159.0 113.6 257.9 31.6
Dev Prj 1230.5 ‐29.2 ‐4311.2 925.4 33.0
Others 189.8 ‐48.8 ‐489.2 443.3 ‐57.2
8. RETAIL RESEARCH Page | 8
Total 2014.8 1582.6 27.3 4416.2
Segmental PBIT % Q1FY15 Q1FY14 Q4FY14
Infrastructure 7.9% 8.2% 10.2%
Power 14.3% 17.8% 26.6%
Metallurgical and Material Handling 9.5% 12.4% 16.7%
Heavy Engineering 3.2% 4.0% 17.0%
Electrical & Automation 4.9% 8.4% 14.2%
Hydrocarbon ‐60.5% 4.1% ‐6.2%
IT 16.9% 23.0% 16.7%
Financial Ser 22.9% 13.4% 18.5%
Dev Prj 56.2% ‐9.0% 137.0%
Others 14.2% ‐4.6% 26.5%
Total 10.2% 8.8% 15.8%
Segmental Capital Employed Q1FY15 Q1FY14 % chg Q4FY14 % chg
Infrastructure 13117.3 11084.0 18.3 12783.8 2.6
Power 2131.9 1723.5 23.7 1824.5 16.9
Metallurgical and Material Handling 3451.9 2830.0 22.0 3169.1 8.9
Heavy Engineering 4556.7 3946.0 15.5 4276.3 6.6
Electrical & Automation 2550.5 2352.1 8.4 2400.8 6.2
Hydrocarbon 3376.1 2960.4 14.0 3903.2 ‐13.5
IT 2813.2 2136.4 31.7 2626.1 7.1
Financial Ser 7462.3 6418.5 16.3 6990.1 6.8
Dev Prj 29770.3 23895.6 24.6 30501.3 ‐2.4
Others 9355.1 9478.6 ‐1.3 9456.9 ‐1.1
Total 78585.2 66825.0 17.6 77932.1 0.8
Analyst: Siji A Philip – Banks, Capital Goods, Power & Midcaps Email ID: siji.philip@hdfcsec.com
RETAIL RESEARCH Tel: (022) 3075 3400 Fax: (022) 2496 5066 Corporate Office
HDFC securities Limited, I Think Techno Campus, Building - B, "Alpha", Office Floor 8, Near Kanjurmarg Station, Opp. Crompton Greaves, Kanjurmarg (East), Mumbai 400 042 Phone: (022) 3075 3400 Fax: (022)
2496 5066 Website: www.hdfcsec.com Email: hdfcsecretailresearch@hdfcsec.com
Disclaimer: This document has been prepared by HDFC Securities Limited and is meant for sole use by the recipient and not for circulation. This document is not to be reported or copied or made available to
others. It should not be considered to be taken as an offer to sell or a solicitation to buy any security. The information contained herein is from sources believed reliable. We do not represent that it is accurate or
complete and it should not be relied upon as such. We may have from time to time positions or options on, and buy and sell securities referred to herein. We may from time to time solicit from, or perform investment
banking, or other services for, any company mentioned in this document. This report is intended for non-Institutional Clients