Download to read offline
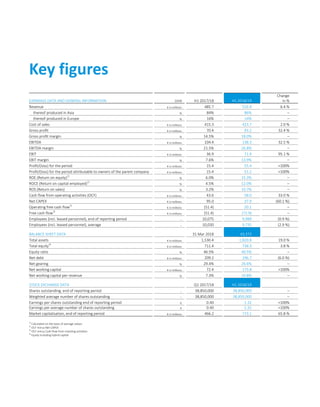


- AT&S, a manufacturer of high-end printed circuit boards and IC substrates, increased revenue and profits in the first half of the 2018/19 fiscal year compared to the same period last year. Revenue grew 6.4% to €516.9 million driven by additional capacity from new Chinese plants and strong demand for IC substrates. - EBITDA improved 32.5% to €138.3 million due to the positive contributions from the Chinese plants, and the EBITDA margin increased to 26.8%. Net profit more than tripled to €55.4 million. - The company upgraded its full-year guidance, now expecting 6-8% revenue growth and an EBITDA margin of


