


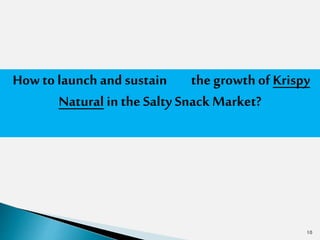


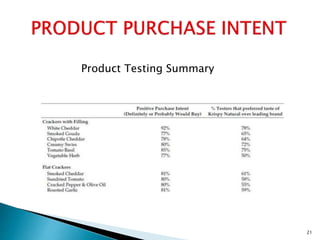


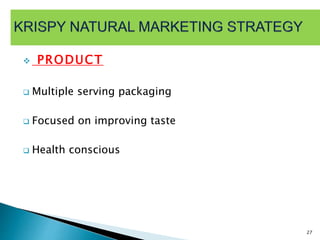
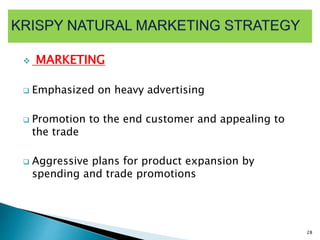
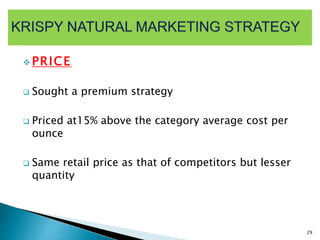
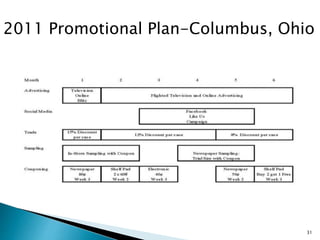

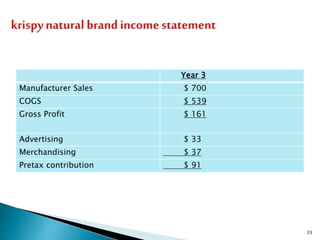

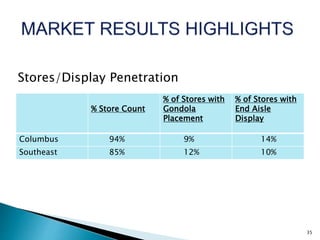
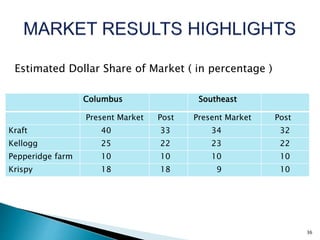


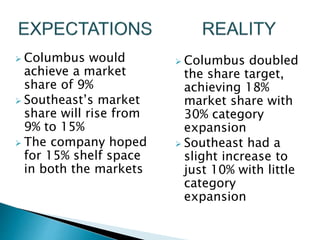

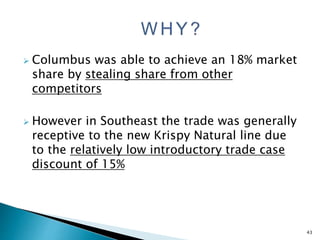
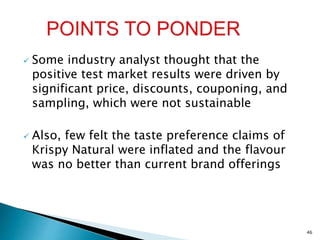
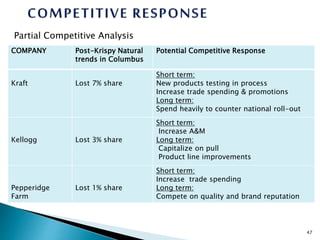

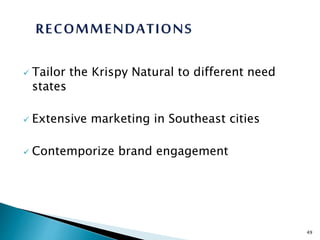


Pemberton, a snack food company, launched Krispy Natural crackers to enter the salty snacks market. They tested the product in Columbus, Ohio and Southeast cities. In Columbus, aggressive promotions helped Krispy Natural gain 18% market share in year one. In Southeast, a premium pricing strategy led to 10% market share. Overall, the test was successful. Pemberton recommends further marketing in Southeast and tailoring Krispy Natural to different consumer needs to sustain long term growth. Competitors may respond by increasing promotions and investing in new products.


![[rokonz.com] Glossary of Semantic SEO Part-3.pdf](https://cdn.slidesharecdn.com/ss_thumbnails/rokonz-260123200835-55123e1e-thumbnail.jpg?width=640&height=640&fit=bounds)
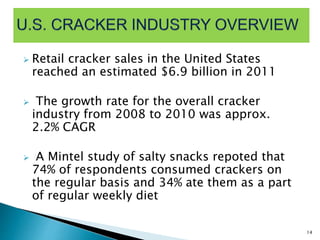
![[rokonz.com] Glossary of Semantic SEO Part-1.pdf](https://cdn.slidesharecdn.com/ss_thumbnails/rokonz-260123200456-440e4060-thumbnail.jpg?width=640&height=640&fit=bounds)


