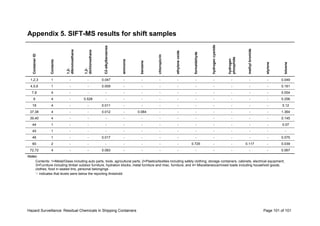
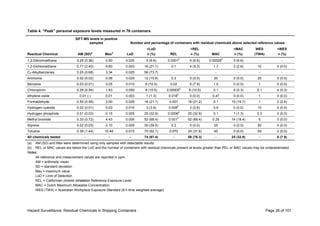
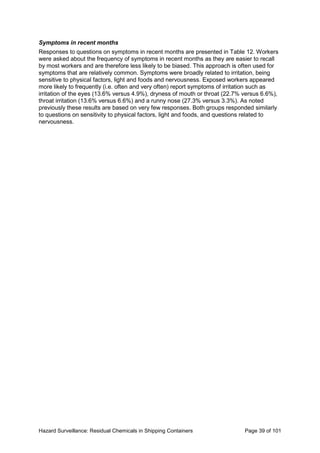
- Residual chemicals were detected in 97.4% of containers sampled, with toluene, C2-alkylbenzenes and methyl bromide most commonly found. 8% of containers exceeded Australian exposure standards and one-third exceeded Dutch standards.
- Very high levels of fumigants were found in some product samples, which poses risks for workers and consumers opening boxes.
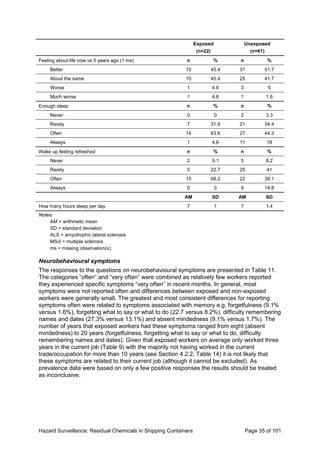
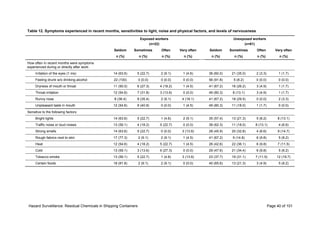
- Exposed workers reported symptoms like memory loss, irritation and asthma more frequently than unexposed workers, though the data is inconclusive due to the small sample size and lack of controls.
- While most workers received training, there was still uncertainty around risks from container fumes. Improvements to practices like placarding

![Hazard Surveillance: Residual Chemicals in Shipping Containers Page ii of 101
This report was commissioned by Safe Work Australia and was undertaken by Mark
Wagstaffe, Brad Prezant, Sam Keer, Naomi Brewer, and Jeroen Douwes, (Centre for Public
Health Research, Massey University) and James McGlothlin and Mark Scharp (Purdue
University).
The report was peer reviewed by the Monash Centre for Occupational and Environmental
Health, Monash University.
Disclaimer
The information provided in this document can only assist you in the most general way. This
document does not replace any statutory requirements under any relevant state and territory
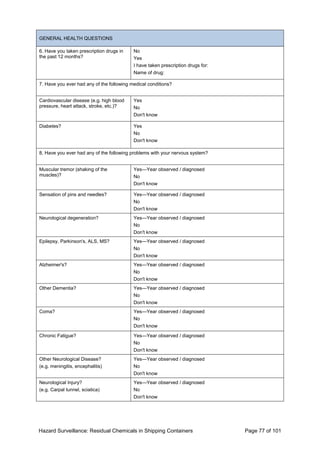
legislation. Safe Work Australia is not liable for any loss resulting from any action taken or
reliance made by you on the information or material contained on this document. Before
relying on the material, users should carefully make their own assessment as to its accuracy,
currency, completeness and relevance for their purposes, and should obtain any appropriate
professional advice relevant to their particular circumstances. The views in this report should
not be taken to represent the views of Safe Work Australia unless otherwise expressly
stated.
Creative Commons
With the exception of the Safe Work Australia logo, this report is licensed by Safe Work
Australia under a Creative Commons 3.0 Australia Licence. To view a copy of this licence,
visit http://creativecommons.org/licenses/by/3.0/au/deed.en
In essence, you are free to copy, communicate and adapt the work, as long as you attribute
the work to Safe Work Australia and abide by the other licensing terms. The report should be
attributed as the Hazard Surveillance: Residual Chemicals in Shipping Containers.
Enquiries regarding the licence and any use of the report are welcome at:
Copyright Officer
Safe Work Australia
GPO Box 641 Canberra ACT 2601
Email: copyrightrequests@safeworkaustralia.gov.au
ISBN 978-0-642-78705-7 [PDF]
ISBN 978-0-642-78706-4 [RTF]](https://image.slidesharecdn.com/2262f25a-5fc1-4d72-8106-0df78363f3cc-160114002013/85/Hazard-Surveillance-Residual-Chemicals-Shipping-Containers-2-320.jpg)
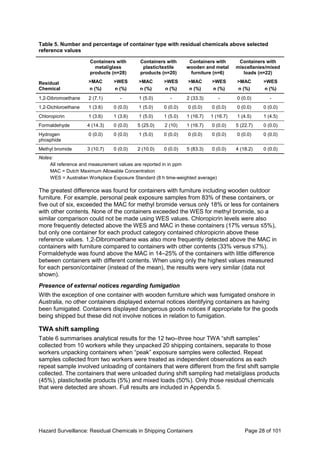
![Hazard Surveillance: Residual Chemicals in Shipping Containers Page 19 of 101
and RAGS equipped backpack were typically visible for the duration of the sampling
periods, as well as significant periods prior to and following grab (Tedlar bag) sampling.
Video was transmitted to the computer running the VEM software via Wi-Fi
• PID (to assess instantaneous exposures to VOCs) (more information provided below),
and
• RAGS (Remote Activated Grab Sampler) (more information provided below).
Photo-ionisation detector (PID)
A TSI Velocicalc 9565X equipped with a VOC probe and 10.6 eV lamp was used. This lamp
has sufficient ionization energy to derive readings from many common chemicals found off-
gassing from consumer products, including aliphatics (C4–C12), aromatics (benzene, toluene,
xylene), and ketones (acetone, methyl ethyl ketone [MEK]). VOCs with ionization energies
higher than 10.6 eV are detected by the PID but at reduced efficiency. The reduced
sensitivity for VOCs with higher ionization energies was not considered to be of significance
for the study design because the PID readings were not considered to be quantitative
(Tedlar/Kynar bag sampling was employed for this purpose) and grab sampling was
conducted regardless of whether a PID reading was detected during container unloading.
The VOC reading, in parts per million (ppm) isobutylene equivalents, represented the sum
(including any positive or negative interaction) of all residual gases present and was used to
provide information on potential exposure levels while shipping containers were unpacked. A
peak PID reading was intended to be used to manually trigger the grab sample collection
taken during unloading. PID readings were transmitted to the laptop using Bluetooth
protocols, and the readings integrated into the VEM software.
The PID was used to monitor container air, to provide real-time exposure measurements for
VEM and RAGS, and to survey warehouses.
Remote Activated Grab Sampler (RAGS)
For the purpose of this study a RAGS was custom-made to take four independent peak
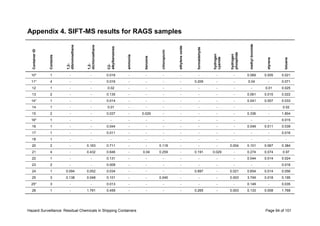
personal exposure air samples in Tedlar or Kynar bags for SIFT-MS analysis. More
information on SIFT-MS analysis is presented in the laboratory analyses section.
Bag sampling is often conducted by placing the bag inside a sealed rigid-walled container,
such as a suitcase with a gasket closure. A tube from the bag sampling port leads to outside
the container. As air is evacuated from the container the ensuing vacuum draws air through
the sampling tubing into the flexible bag, which expands and fills the vacuum. RAGS utilises
this approach to fill one of four bags contained within the sealed acrylic container with the
addition of the capability to trigger each bag sample independently and remotely using a
radio frequency signal. Teflon sampling tubes and valves and medical grade stainless steel
fittings were used to minimise potential contamination from RAGS and from adsorption or
absorption onto the surfaces of the sampler. RAGS was designed so that the four samples
did not share any of the tubing or valves, thus eliminating the possibility of cross-
contamination.
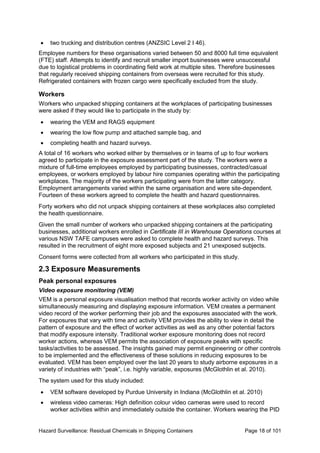
The PID and RAGS were placed inside a backpack worn by workers (see Photograph 1).
Researchers remotely triggered sample collection when peak levels were observed on the
PID providing data to the VEM system. Typically samples were collected over a period of
20–30 seconds which provided sufficient sample volume for analysis. Unfortunately there
were many instances where VEM was unable to be used when containers were unpacked.
This occurred for a number of reasons including occasions when there was electrical
interference with the Bluetooth signal, the distance between the container and the receiving
computer was too great and/or the workers declined to wear the sampling pack. A small
percentage of workers were not willing to wear the RAGS sampler in conjunction with the
PID as this made their tasks too difficult e.g. they could not wear it and drive a forklift or get](https://image.slidesharecdn.com/2262f25a-5fc1-4d72-8106-0df78363f3cc-160114002013/85/Hazard-Surveillance-Residual-Chemicals-Shipping-Containers-19-320.jpg)


![Hazard Surveillance: Residual Chemicals in Shipping Containers Page 63 of 101
5. References
AIHW Australian Centre for Asthma Monitoring (2005). Asthma in Australia 2005. AIHW
Asthma Series 2. AIHW cat. no. ACM 6. Canberra: Australian Institute of Health and
Welfare (AIHW).
Anger, Moody, Burg, Brightwell, Taylor, Russo, et al. (1986). Neurobehavioral evaluation of
soil and structural fumigators using methyl bromide and sulfuryl fluoride.
Neurotoxicology, 7(3):137-56.
Asher, Montefort, Bjorksten, Lai, Strachan, Weiland, et al. (2006). Worldwide time trends in
the prevalence of symptoms of asthma, allergic rhinoconjunctivitis, and eczema in
childhood: ISAAC Phases One and Three repeat multicountry cross-sectional
surveys. Lancet, 368(9537):733-43.
Baur, Yu, Poschadel, Veldman & Vos (2006). Health risks by bromomethane and other toxic
gases in import cargo ship containers. Int Marit Health, 57(1-4):46-55.
Baur, Poschadel & Budnik (2010a). High frequency of fumigants and other toxic gases in
imported freight containers - an underestimated occupational and community health
risk. Occup Environ Med, 67(3):207-12.
Baur, Budnik & Preisser (2010b). [Health risks of residual fumigants in international transport
containers]. Dtsch Med Wochenschr, 135(11):516-21.
Breeman (2009). Methylbromide intoxication: a clinical case study. Adv Emerg Nurs J,
31(2):153-60.
Budnik, Kloth, Velasco-Garrido & Baur (2012). Prostate cancer and toxicity from critical use
exemptions of methyl bromide: Environmental protection helps protect against
human health risks. Environ Health, 11(1):5.
Burgess, Morrissey, Keifer & Robertson (2000). Fumigant-related illnesses: Washington
State's five-year experience. J Toxicol Clin Toxicol, 38(1):7-14.
Calvert, Mueller, Fajen, Chrislip, Russo, Briggle, et al. (1998). Health effects associated with
sulfuryl fluoride and methyl bromide exposure among structural fumigation workers.
Am J Public Health, 88(12):1774-80.
Chan-Yeung & Malo (1994). Aetiological agents in occupational asthma. Eur Respir J,
7(2):346-71.
ComCare (2011). Safety Alert: Methyl Bromide - Toxic Fumigant In Cargo Containers:
Australian Government: ComCare.
de Groot (2007). Trend analysis of harmful gases in shipping containers
(summary)(20070190 IMD gmdg):7: Rijksinstituut voor Volksgezondheid en Milieu
(RIVM).
Drawneek, O'Brien, Goldsmith & Bourdillon (1964). Industrial Methyl-Bromide Poisoning in
Fumigators. A Case Report and Field Investigation. Lancet, 2(7364):855-6.
Frost (2010). Safety in Sea Container Examination - The Australian Experience. WCO
Technology and Innovation Forum. Cairo, Egypt: World Customs Organization.
Gilioli (1993). EURONEST: a concerted action of the European community for the study of
organic solvents neurotoxicity. Environ Res, 62(1):89-98.
Heblich, Preisser, Ruckleben & Baur (2009). Data Base: Patients intoxicated with Fumigants
[Datenbank: Patienten mit Begasungsmittel-Intoxikation]. Zentralblatt fur
Arbeitsmedizin, Arbeitsschutz und Ergonomie, 59(6):166-169.
IARC Working Group on the Evaluation of Carcinogenic Risks to Humans (2006).
Formaldehyde, 2-Butoxyethanol and 1-tert-Butoxypropan-2-ol. IARC Monographs on
the Evaluation of Carcinogenic Risks to Humans Vol. 88. Lyon, France: International
Agency for Research on Cancer.
International Maritime Organization (2012). International Maritime Dangerous Goods (IMDG)
Code. 2010 Edition. Viewed 20 August 2012.
Knol-de Vos (2003). Measuring the amount of gas in import containers(Letter Report 729/02
IEM, RIVM Report 609021025/2003): Dutch National Institute for Public Health and
the Environment (RIVM).](https://image.slidesharecdn.com/2262f25a-5fc1-4d72-8106-0df78363f3cc-160114002013/85/Hazard-Surveillance-Residual-Chemicals-Shipping-Containers-63-320.jpg)
: Institute of Environmental Medicine, Karolinska Institutet.
Tortarolo (2011). Fumigants and dangerous gases in freight containers - Italian experience.
Zentralblatt fur Arbeitsmedizin, Arbeitsschutz und Ergonomie, 61(11):371-377.
Valcin, Henneberger, Kullman, Umbach, London, Alavanja, et al. (2007). Chronic bronchitis
among nonsmoking farm women in the agricultural health study. J Occup Environ
Med, 49(5):574-83.
WorkSafe NT (2006). 04.02.06 Bulletin - Class 2.3 Toxic Gas: Ventilation of Fumigated
Freight Containers with Methyl Bromide Mixtures: Northern Territory Government:
WorkSafe Northern Territory.
WorkSafe Victoria (2009). A Health and Safety Solution: Fumigated shipping containers -
Venting prior to unpacking (by end user): WorkSafe Victoria.
WorkSafe Victoria (2010). Guidance Note: Unpacking shipping containers: State
Government of Victoria.](https://image.slidesharecdn.com/2262f25a-5fc1-4d72-8106-0df78363f3cc-160114002013/85/Hazard-Surveillance-Residual-Chemicals-Shipping-Containers-64-320.jpg)