1. Electricity is generated in a nuclear power station.
Fission is the process by which energy is released in the nuclear reactor.
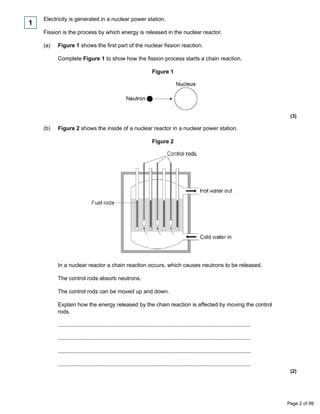
(a) Figure 1 shows the first part of the nuclear fission reaction.
Complete Figure 1 to show how the fission process starts a chain reaction.
Figure 1
(3)
1
(b) Figure 2 shows the inside of a nuclear reactor in a nuclear power station.
Figure 2
In a nuclear reactor a chain reaction occurs, which causes neutrons to be released.
The control rods absorb neutrons.
The control rods can be moved up and down.
Explain how the energy released by the chain reaction is affected by moving the control
rods.
.............................................................................................................................
.............................................................................................................................
.............................................................................................................................
.............................................................................................................................
(2)
Page 2 of 99
2. (c) Figure 3 shows how the power output of the nuclear reactor would change if the control
rods were removed.
Figure 3
Calculate the rate of increase of power output at 10 minutes.
.............................................................................................................................
.............................................................................................................................
.............................................................................................................................
.............................................................................................................................
Rate of increase of power output = .................. MW / minute
(2)
(Total 7 marks)
Alpha particles, beta particles and gamma rays are types of nuclear radiation.
(a) Describe the structure of an alpha particle.
.............................................................................................................................
.............................................................................................................................
(1)
2
Page 3 of 99
3. (b) Nuclear radiation can change atoms into ions by the process of ionisation.
(i) Which type of nuclear radiation is the least ionising?
Tick (✔) one box.
alpha particles
beta particles
gamma rays
(1)
(ii) What happens to the structure of an atom when the atom is ionised?
...................................................................................................................
...................................................................................................................
(1)
(c) People working with sources of nuclear radiation risk damaging their health.
State one precaution these people should take to reduce the risk to their health.
.............................................................................................................................
.............................................................................................................................
(1)
(d) In this question you will be assessed on using good English, organising information
clearly and using specialist terms where appropriate.
The type of radiation emitted from a radioactive source can be identified by comparing the
properties of the radiation to the properties of alpha, beta and gamma radiation.
Describe the properties of alpha, beta and gamma radiation in terms of their:
• penetration through materials
• range in air
• deflection in a magnetic field.
(6)
(Total 10 marks)
(a) Radioactive sources that emit alpha, beta or gamma radiation can be dangerous.
What is a possible risk to health caused by using a radioactive source?
........................................................................................................................
........................................................................................................................
(1)
3
Page 4 of 99
4. (b) In an experiment, a teacher put a 2 mm thick lead sheet in front of a radioactive source.
She used a detector and counter to measure the radiation passing through the lead
sheet in one minute.
She then put different numbers of lead sheets, each 2 mm thick, in front of the radioactive
source and measured the radiation passing through in one minute.
The apparatus the teacher used is shown in Figure 1.
(i) When using a radioactive source in an experiment, how could the teacher reduce the
risk to her health?
Suggest one way.
...............................................................................................................
...............................................................................................................
(1)
(ii) The number recorded on the counter is actually higher than the amount of radiation
detected from the source.
Complete the following word equation.
The number
recorded on
the counter
=
The amount of
radiation detected
from the source
+ ..................................... radiation
(1)
Page 5 of 99
5. (c) The readings taken by the teacher are plotted in Figure 2.
(i) Draw a line of best fit to complete Figure 2.
(1)
(ii) How does the amount of radiation absorbed by the lead change as the total
thickness of the lead is increased?
...............................................................................................................
...............................................................................................................
(1)
(iii) Use Figure 2 to estimate the reading on the counter when the total thickness of the
lead is increased to 12 mm.
Estimated counter reading = .........................................
(1)
Page 6 of 99
6. (d) What type of radiation was emitted from the radioactive source?
Draw a ring around the correct answer.
alpha beta gamma
Give a reason for your answer.
........................................................................................................................
........................................................................................................................
(2)
(Total 8 marks)
Different radioactive isotopes have different values of half-life.
(a) What is meant by the ‘half-life’ of a radioactive isotope?
........................................................................................................................
........................................................................................................................
........................................................................................................................
(1)
4
(b) Figure 1 shows how the count rate from a sample of a radioactive isotope varies with time.
Figure 1
Time in days
Use information from Figure 1 to calculate the half-life of the radioactive isotope.
Show clearly on Figure 1 how you obtain your answer.
Half-life = ...................................... days
(2)
Page 7 of 99
7. (c) The table below shows data for some radioactive isotopes that are used in schools.
Radioactive
isotope
Type of radiation
emitted
Half-life in
years
Americium-241 Alpha and gamma 460
Cobalt-60 Gamma 5
Radium-226 Alpha, beta and gamma 1600
Strontium-90 Beta 28
Thorium-232 Alpha and beta 1.4 x 10¹⁰
(i) State which radioactive isotope in the table above emits only radiation that is not
deflected by a magnetic field.
Give a reason for your choice.
...............................................................................................................
...............................................................................................................
...............................................................................................................
...............................................................................................................
(2)
Page 8 of 99
8. (ii) Figure 2 shows a radioactive isotope being used to monitor the thickness of paper
during production.
Figure 2
State which radioactive isotope in the table should be used to monitor the thickness
of the paper.
Explain your choice.
...............................................................................................................
...............................................................................................................
...............................................................................................................
...............................................................................................................
...............................................................................................................
(3)
All the radioactive isotopes in the table have practical uses.
State which source in the table would need replacing most often.
Explain your choice.
...............................................................................................................
...............................................................................................................
...............................................................................................................
...............................................................................................................
...............................................................................................................
(3)
Page 9 of 99
10. Nuclear fission and nuclear fusion are two processes that release energy.
(a) (i) Use the correct answer from the box to complete each sentence.
Geiger counter nuclear reactor star
Nuclear fission takes place within a ........................................................ .
Nuclear fusion takes place within a ......................................................... .
(2)
5
(ii) State one way in which the process of nuclear fusion differs from the process of
nuclear fission.
................................................................................................................
................................................................................................................
(1)
(b) The following nuclear equation represents the fission of uranium-235 (U-235).
Chemical symbols:
Ba - barium
Kr - krypton
(i) Use the information in the equation to describe the process of nuclear fission.
................................................................................................................
................................................................................................................
................................................................................................................
................................................................................................................
................................................................................................................
................................................................................................................
................................................................................................................
................................................................................................................
(4)
Page 11 of 99
11. (ii) An isotope of barium is Ba-139.
Ba-139 decays by beta decay to lanthanum-139 (La-139).
Complete the nuclear equation that represents the decay of Ba-139 to La-139.
(3)
(Total 10 marks)
A teacher used the equipment shown in the diagram to measure the count rate at different
distances from a radioactive source.
Metre rule
(a) Her results are shown in Table 1.
Table 1
Distance in metres
Count rate in counts
per minute
Corrected count rate in
counts per minute
0.4 143 125
0.6 74 56
0.8 49 31
1.0 38 20
1.2 32 14
1.4 28 10
1.6 18 0
1.8 18 0
2.0 18 0
The background count rate has been used to calculate the corrected count rate.
(i) What is the value of the background count rate?
Background count rate = .............................. counts per minute
(1)
6
Page 12 of 99
12. (ii) What information does the corrected count rate give?
................................................................................................................
................................................................................................................
(1)
(iii) The radioactive source used in the demonstration emits only one type of radiation.
The radioactive source is not an alpha emitter.
How can you tell from the data in the table?
................................................................................................................
................................................................................................................
(1)
(iv) Plot a graph of corrected count rate against distance for distances between 0.4 m and
1.4 m.
Draw a line of best fit to complete the graph.
Distance in metres
(3)
Page 13 of 99
13. (v) The ‘half-distance’ is the distance a detector has to be moved away from a
radioactive source for the corrected count rate to halve.
A student has the hypothesis:
A radioactive source has a constant ‘half-distance’.
Table 1 has been repeated for your information.
Table 1
Distance in metres
Count rate in counts
per minute
Corrected count rate in
counts per minute
0.4 143 125
0.6 74 56
0.8 49 31
1.0 38 20
1.2 32 14
1.4 28 10
1.6 18 0
1.8 18 0
2.0 18 0
Use Table 1 to determine if the hypothesis is correct for this radioactive source.
You should use calculations in your answer.
................................................................................................................
................................................................................................................
................................................................................................................
................................................................................................................
................................................................................................................
................................................................................................................
................................................................................................................
(3)
Page 14 of 99
14. (b) A teacher places a beta source and a detector in a magnetic field.
The arrangement of the magnetic field is shown.
.......The teacher repeated the experiment with the magnetic field in a different direction.
A set of results is shown in Table 2.
Table 2
Distance
between source
and detector
in metres
Count rate
in counts per
minute without
magnetic field
Count rate
in counts per
minute in
Experiment 1
Count rate
in counts per
minute in
Experiment 2
0.8 48 48 32
(i) Describe and explain the effect of the magnetic field on the count rate detected by
the detector.
................................................................................................................
................................................................................................................
................................................................................................................
................................................................................................................
................................................................................................................
................................................................................................................
(2)
Page 15 of 99
15. (ii) The experiment is repeated with a different distance between the source and the
detector.
Table 3 shows the repeated results.
Table 3
Distance between
source and
detector
in metres
Count rate
in counts per
minute without
magnetic field
Count rate
in counts per
minute in
Experiment 1
Count rate
in counts per
minute in
Experiment 2
1.8 19 18 20
Explain these results.
................................................................................................................
................................................................................................................
................................................................................................................
................................................................................................................
................................................................................................................
................................................................................................................
(2)
(Total 13 marks)
(a) Sources of background radiation are either natural or man-made.
Which two of the sources listed in the box are natural sources of background radiation?
Draw a ring around each of your answers.
cosmic rays nuclear accidents X-rays radon gas
(2)
7
Page 16 of 99
16. (b) A teacher used a Geiger-Műller (GM) tube and counter to measure the background
radiation in her laboratory. The teacher reset the counter to zero, waited one minute and
then took the count reading. The teacher repeated this two more times.
The three readings taken by the teacher are given in the table.
Count
17
21
19
(i) The three readings are different.
What is the most likely reason for this?
Tick ( ) one box.
The teacher did not reset the counter to zero.
Radioactive decay is a random process.
The temperature in the laboratory changed.
(1)
(ii) Calculate the mean (average) value of the three readings given in the table.
...............................................................................................................
Mean (average) value = .................................................. counts
(1)
Page 17 of 99
17. (iii) The diagram shows how the teacher used the GM tube and counter to measure the
radiation emitted from a radioactive source.
The counter was reset to zero. The count after one minute was 159.
Calculate how many counts were due to the radiation from the radioactive source.
...............................................................................................................
...............................................................................................................
Counts due to the radiation from the radioactive source = ...................
(1)
(iv) The teacher then put a powerful magnet between the radioactive source and the GM
tube.
The counter was reset to zero. The number on the counter shows the count after one
minute.
What type of radiation was being emitted from the radioactive source?
Draw a ring around your answer.
alpha beta gamma
Explain the reason for your answer.
...............................................................................................................
...............................................................................................................
...............................................................................................................
...............................................................................................................
(3)
Page 18 of 99
18. (c) At the end of the lesson the teacher put the radioactive source back inside its storage box.
Why is the inside of the box lined with lead?
........................................................................................................................
........................................................................................................................
(1)
(d) Which one of the following questions cannot be answered by scientific study?
Tick ( ) one box.
Where does background radiation come from?
What is meant by the half-life of a radioactive source?
Should radioactive waste be dumped in the oceans?
(1)
(Total 10 marks)
Page 19 of 99
19. (a) A teacher used a Geiger-Műller (GM) tube and counter to measure the background
radiation in her laboratory.
The teacher reset the counter to zero, waited one minute and then took the count reading.
The teacher repeated the procedure two more times.
(i) Background radiation can be either from natural sources or from man-made sources.
Name one man-made source of background radiation.
...............................................................................................................
(1)
8
(ii) The three readings taken by the teacher are given in the table.
Count after
one minute
15
24
18
The readings given in the table are correct.
Why are the readings different?
...............................................................................................................
...............................................................................................................
(1)
Page 20 of 99
20. (b) Some scientists say they have found evidence to show that people living in areas of high
natural background radiation are less likely to develop cancer than people living in similar
areas with lower background radiation.
The evidence these scientists found does not definitely mean that the level of background
radiation determines whether a person will develop cancer.
Suggest a reason why.
........................................................................................................................
........................................................................................................................
(1)
(c) An atom of the isotope radon-222 emits an alpha particle and decays into an atom of
polonium.
An alpha particle is the same as a helium nucleus. The symbol below represents an alpha
particle.
(i) How many protons and how many neutrons are there in an alpha particle?
Number of protons = ...............
Number of neutrons = ...............
(2)
(ii) The decay of radon-222 can be represented by the equation below.
Complete the equation by writing the correct number in each of the two boxes.
(2)
Page 21 of 99
21. (d) The graph shows how, in a sample of air, the number of radon-222 nuclei changes with
time.
Time in days
Use the graph to find the half-life of radon-222.
Show clearly on the graph how you obtain your answer.
Half-life = .................................................. days
(2)
(Total 9 marks)
Page 22 of 99
22. A doctor uses the radioactive isotope technetium-99 to find out if a patient’s kidneys are working
correctly.
The doctor injects a small amount of technetium-99 into the patient’s bloodstream.
Technetium-99 emits gamma radiation.
If the patient’s kidneys are working correctly, the technetium-99 will pass from the bloodstream
into the kidneys and then into the patient’s urine.
Detectors are used to measure the radiation emitted from the kidneys.
The level of radiation emitted from each kidney is recorded on a graph.
(a) How do the graphs show that technetium-99 is passing from the bloodstream into each
kidney?
........................................................................................................................
........................................................................................................................
(1)
9
Page 23 of 99
23. (b) By looking at the graphs, the doctor is able to tell if there is a problem with the patient’s
kidneys.
Which one of the following statements is correct?
Put a tick ( ) in the box next to your answer.
Only the right kidney is working correctly.
Only the left kidney is working correctly.
Both kidneys are working correctly.
Explain the reason for your answer.
........................................................................................................................
........................................................................................................................
........................................................................................................................
........................................................................................................................
(3)
(Total 4 marks)
Page 24 of 99
24. The pie chart shows the average proportions of background radiation from various sources in the
UK.
(a) Three sources of background radiation are given in List A.
Statements about sources of background radiation are given in List B.
Draw one line to link each source of background radiation in List A to the statement about
that source given in List B.
Draw only three lines.
List A List B
Are used to show broken bones.
X-rays
The radiation comes from outer
space.
Cosmic rays
Comes from soil containing a
radioactive isotope of potassium.
Radon gas
On average gives 50% of all
background radiation.
(3)
10
Page 25 of 99
25. (b) The level of background radiation from cosmic rays is not the same everywhere. For every
30 metres above sea level, the amount of background radiation increases by one unit.
The diagram shows the position of two villages, A and B, built on a hill.
How is the amount of background radiation from cosmic rays different in village A
compared to village B?
To obtain full marks, you must include a calculation in your answer.
........................................................................................................................
........................................................................................................................
........................................................................................................................
........................................................................................................................
........................................................................................................................
........................................................................................................................
(3)
(Total 6 marks)
Page 26 of 99
26. The pie chart shows the sources of the background radiation and the radiation doses that the
average person in the UK is exposed to in one year.
Radiation dose is measured in millisieverts (mSv).
(a) (i) What is the total radiation dose that the average person in the UK receives?
...............................................................................................................
...............................................................................................................
Total radiation dose = .................................................. mSv
(1)
11
(ii) A student looked at the pie chart and then wrote down three statements.
Which one of the following statements is a correct conclusion from this data?
Put a tick ( ) in the box next to your answer.
In the future, more people will be exposed to a
greater proportion of radon gas.
People that have never had an X-ray get
50 % of their radiation dose from radon gas.
The radiation dose from natural sources
is much greater than from artificial sources.
(1)
Page 27 of 99
27. (b) The concentration of radon gas inside a home can vary from day to day.
The table gives data for the radiation measured in homes in four different parts of the UK.
The radiation was measured using two detectors, one in the living room and one in the
bedroom. The measurements were taken over 3 months.
Area of the UK
Number of
homes in the
area
Number of
homes in the
sample
Average
radiation
in Bq/m3
Maximum
radiation
in Bq/m3
A 590 000 160 15 81
B 484 000 130 18 92
C 221 000 68 000 162 10 000
D 318 000 35 300 95 6 900
(i) Give one reason why the measurements were taken over 3 months using detectors
in different rooms.
...............................................................................................................
...............................................................................................................
(1)
(ii) Use information from the table to suggest why a much higher proportion of homes
were sampled in areas C and D than in areas A and B.
...............................................................................................................
...............................................................................................................
...............................................................................................................
(2)
(Total 5 marks)
The table shows the average background radiation dose from various sources that a person
living in the UK receives in one year.
Source of background radiation Average radiation dose received
each year in dose units
Cosmic rays (from space) 300
Food and drink 250
Medical treatments
(including X-rays)
350
Radon gas 1250
Rocks 350
TOTAL 2500
12
Page 28 of 99
28. (a) (i) A student looked at the data in the table and then wrote down four statements.
Only two of the statements are true.
Put a tick ( ) in the boxes next to the two true statements.
More than half of the average radiation dose comes from radon gas.
On average, cosmic rays produce less background radiation than rocks.
Everyone living in the UK receives the same background radiation dose.
Having no X-rays reduces a person’s radiation dose.
(2)
(ii) Each time a chest X-ray is taken, the patient receives about 100 units of radiation.
How many chest X-rays would just exceed the yearly average dose for medical
treatments?
........................................................................................................................
Number of chest X-rays = ..................................................
(2)
(b) Exposure to radiation can cause cancer.
The graphs, A, B and C, show three different ways that the exposure to radiation and the
risk of getting cancer could be linked.
(i) What do all three of these graphs suggest happens to the risk of getting cancer when
the radiation dose goes from moderate to high?
...............................................................................................................
...............................................................................................................
(1)
Page 29 of 99
29. (ii) Some scientists believe that exposure to low radiation doses reduces the chance that
a person will get cancer. This effect is called ‘radiation hormesis’.
Which one of the graphs, A, B or C, shows ‘radiation hormesis’?
Write your answer in the box.
Give a reason for your answer.
...............................................................................................................
...............................................................................................................
...............................................................................................................
(2)
(c) Scientists did an experiment in which mice were exposed to different doses of radiation.
The results from the experiment are given in the table.
Description of exposure Percentage of mice
getting cancer
Mice exposed to a low dose of
radiation and then a high dose of
radiation.
16%
Mice exposed to a high dose of
radiation only.
46%
(i) Do the results from this experiment provide evidence to support ‘radiation hormesis’?
Draw a ring around your answer. NO YES
Explain the reason for your answer.
........................................................................................................................
........................................................................................................................
........................................................................................................................
........................................................................................................................
........................................................................................................................
(2)
Page 30 of 99
30. (ii) Complete the following sentence by drawing a ring around the correct word in the
box.
environmental
Using animals in scientific experiments raises ethical issues.
social
(1)
(Total 10 marks)
The pie chart shows the sources of the background radiation and the radiation doses that the
average person in the UK is exposed to in one year.
Radiation dose is measured in millisieverts (mSv).
13
(a) (i) What is the radiation dose that the average person in the UK receives from radon gas?
...............................................................................................................
...............................................................................................................
Radiation dose from radon gas = ................................... mSv
(1)
Page 31 of 99
31. (ii) A person may receive a higher than average dose of radiation from background
sources.
Suggest two reasons why.
1 ............................................................................................................
...............................................................................................................
2 ............................................................................................................
...............................................................................................................
(2)
(b) Exposure to radon gas can cause lung cancer.
A recent study has compared the risk of getting lung cancer, by the age of 75 years, for
cigarette smokers and non-smokers.
The people in the study had been exposed throughout their lives to different levels of radon
gas.
A summary of the data produced from the study is given in the table.
Exposure to
radon gas
Risk of lung cancer by age of 75
Non-smoker Smoker
No exposure 0.4 % 10 %
Moderate
exposure
1.0 % 14 %
Very high
exposure
1.5 % 32 %
(i) Why were people that have had no exposure to radon gas included in the study?
...............................................................................................................
...............................................................................................................
(1)
(ii) Using information from the table, what conclusions can be made about exposure to
radon gas and the risk of getting lung cancer?
...............................................................................................................
...............................................................................................................
...............................................................................................................
...............................................................................................................
...............................................................................................................
(2)
Page 32 of 99
32. (c) At the moment, the regulations designed to protect people from over-exposure to radiation
are based on a model called the ‘linear no-threshold’ (LNT) model.
Some scientists believe that the LNT model is too simple.These scientists believe that at
low radiation levels a process called ‘radiation hormesis’ happens.
The graphs show that each model suggests a link between the risk of developing a cancer
and exposure to low levels of radiation.
The link between the risk of developing cancer and exposure to low levels of radiation
suggested by each of the models is different.
Describe how.
........................................................................................................................
........................................................................................................................
........................................................................................................................
........................................................................................................................
........................................................................................................................
(2)
Page 33 of 99
33. (d) Scientists have conducted experiments in which mice have been exposed to different
levels of radiation. The number of mice developing a cancer has then been measured.
Discuss whether it is ethical to use animals in scientific experiments.
........................................................................................................................
........................................................................................................................
........................................................................................................................
........................................................................................................................
........................................................................................................................
(2)
(Total 10 marks)
Page 34 of 99
34. Food irradiation is a process that exposes food to radiation. Irradiation can be used to kill the
bacteria that cause food poisoning or to slow down the ripening of fresh fruit and vegetables.
Frozen foods and food inside packaging can also be irradiated.
(a) The table gives information about five radioactive isotopes.
Isotope Half-life Radiation emitted
Caesium-134 2.1 years beta
Cobalt-60 5.3 years gamma
Curium-242 160 days alpha
Strontium-90 28 years beta
Technetium-99 6 hours gamma
Which of these radioactive isotopes would be most suitable for irradiating food?
........................................................................................................................
Explain the reasons for your choice.
........................................................................................................................
........................................................................................................................
........................................................................................................................
........................................................................................................................
........................................................................................................................
(3)
14
(b) Many people think that food should not be irradiated. Consumer groups have said that they
are worried about the nutritional value and safety of eating irradiated foods.
(i) Suggest one reason why some people may be concerned about the safety of eating
irradiated food.
...............................................................................................................
...............................................................................................................
(1)
Page 35 of 99
35. (ii) Independent scientific committees in several countries, including Sweden, Canada
and the UK, have concluded that it is safe to eat irradiated food.
These scientific committees need to be independent from government influence.
Suggest why.
...............................................................................................................
...............................................................................................................
(1)
(iii) One group of scientists has compared the vitamin content of non-irradiated foods with
irradiated foods.
The table below gives the data obtained for 1 kg of cooked chicken.
Vitamin Non-irradiated food
in milligrams
Irradiated food
in milligrams
B6 1.22 1.35
B12 21.00 28.00
E 3.30 2.15
Niacin 58.00 55.50
Riboflavin 2.10 2.25
Considering only the data in the table, is it valid to conclude that irradiated food is
less nutritional than non-irradiated food?
Explain your answer.
...............................................................................................................
...............................................................................................................
...............................................................................................................
...............................................................................................................
...............................................................................................................
(2)
Page 36 of 99
36. (iv) In a restaurant, meals with ingredients that have been irradiated must be clearly
identified on the menu.
It is important that people eating in a restaurant are given this information.
Suggest why.
...............................................................................................................
...............................................................................................................
(1)
(c) The isotope caesium-137 decays by emitting beta radiation.
Caesium-137 has a half-life of 30 years.
(i) What is a beta particle, and from which part of an atom is a beta particle emitted?
...............................................................................................................
...............................................................................................................
(1)
(ii) A sample containing caesium-137 has a count rate of 600 counts per minute.
Calculate how long it would take for the count rate from the sample to fall to 75
counts per minute.
Show clearly how you work out your answer.
...............................................................................................................
...............................................................................................................
...............................................................................................................
Time taken = .................................................. years
(2)
(Total 11 marks)
Page 37 of 99
37. The pie chart shows the average proportions of natural background radiation from various
sources in the UK.
(a) (i) Complete the following sentence.
On average, .......................................................... of the natural background radiation
in the UK comes from radon gas.
(1)
15
Page 38 of 99
38. (ii) Radon gas is found inside homes.
The table shows the results from measuring the level of radon gas inside four homes
in one area of the UK.
Home
Level of radon gas in
Bq per m3
of air
1 25
2 75
3 210
4 46
Mean 89
One of the homes has a much higher level of radon gas than the other three homes.
What should be done to give a more reliable mean for the homes in this area of the
UK?
Put a tick ( ) in the box next to your answer.
ignore the data for home number 3
measure the radon gas level in more homes in this area
include data for homes from different areas of the UK
(1)
(b) Each atom of radon has 86 protons and 136 neutrons.
(i) How many electrons does each atom of radon have?
Draw a ring around your answer.
50 86 136 222
(1)
Page 39 of 99
39. (ii) How many particles are there in the nucleus of a radon atom?
Draw a ring around your answer.
50 86 136 222
(1)
(Total 4 marks)
(a) Background radiation is all around us all the time.
(i) Radon is a natural source of background radiation.
Name another natural source of background radiation.
...............................................................................................................
(1)
16
(ii) X-rays are an artificial source of background radiation.
Name another artificial source of background radiation.
...............................................................................................................
(1)
(iii) An atom of radon-222 decays by emitting an alpha particle.
The equation representing the decay is shown below.
How can you tell from the equation that ‘X’ is not an atom of radon?
...............................................................................................................
...............................................................................................................
(1)
Page 40 of 99
40. (b) Having an X-ray taken increases your exposure to radiation.
The table gives:
• the radiation doses received for 6 different medical X-rays;
• the number of days’ of exposure to natural background radiation each dose is
equivalent to.
Medical X-ray
Radiation dose
received
(in arbitrary units)
Equivalent number of days
of exposure to natural
background radiation
Chest 2 2.4
Skull 7 8.4
Pelvis 22 26.4
Hip 44 52.8
Spine 140
CT head scan 200 240
A hospital patient has an X-ray of the spine taken.
Calculate the number of days of exposure to natural background radiation that an X-ray of
the spine is equivalent to.
Show how you work out your answer.
........................................................................................................................
........................................................................................................................
........................................................................................................................
Equivalent number of days = ..................................................
(2)
Page 41 of 99
41. (c) Scientists have shown that X-rays increase the risk of developing cancer.
The scientists came to this conclusion by studying the medical history of people placed in
one of two groups, A or B.
The group into which people were put depended on their X-ray record.
(i) Person J has been placed into group A.
Place each of the people, K, L, M, N and O, into the appropriate group, A or B.
Person
J K L M N O
Medical
X-ray
record
3 arm None None 2 skull None 4 leg
Group A Group B
J
(1)
(ii) To be able to make a fair comparison, what is important about the number of people
in each of the two groups studied by the scientists?
...............................................................................................................
...............................................................................................................
(1)
(iii) What data would the scientists have compared in order to come to the conclusion that
X-rays increase the risk of developing cancer?
...............................................................................................................
...............................................................................................................
(1)
Page 42 of 99
42. (iv) The chance of developing cancer due to a CT head scan is about 1 in 10 000.
The chance of developing cancer naturally is about 1 in 4.
A hospital patient is advised by a doctor that she needs to have a CT head scan.
The doctor explains to the patient the risks involved.
Do you think that the patient should give her permission for the CT scan to be taken?
Draw a ring around your answer.
Yes No
Give a reason for your answer.
...............................................................................................................
...............................................................................................................
(1)
(Total 9 marks)
Page 43 of 99
43. The pie chart shows the average proportions of background radiation from various sources in the
UK.
Three sources of background radiation are given in List A.
Statements about sources of background radiation are given in List B.
Draw one line to link each source of background radiation in List A to the statement about that
source given in List B.
Draw only three lines.
List A List B
Are used to show broken bones.
X-rays
The radiation comes from outer
space.
Cosmic rays
Comes from soil containing a
radioactive isotope of potassium.
Radon gas
Gives about 50 % of all background
radiation.
(Total 3 marks)
17
Page 44 of 99
44. (a) A doctor uses the radioactive isotope technetium-99 to find out if a patient’s kidneys are
working correctly.
The doctor injects a small amount of technetium-99 into the patient’s bloodstream.
Technetium-99 emits gamma radiation.
Give two reasons why an isotope that emits gamma radiation is injected into the patient
rather than an isotope that emits alpha radiation.
1......................................................................................................................
........................................................................................................................
2......................................................................................................................
........................................................................................................................
(2)
18
Page 45 of 99
45. (b) If the patient’s kidneys are working correctly, the technetium-99 will pass from the
bloodstream into the kidneys and then into the patient’s urine.
Detectors are used to measure the radiation emitted from the kidneys.
The level of radiation emitted from each kidney is recorded on a graph.
(i) How do the graphs show that technetium-99 is passing from the bloodstream into
each kidney?
...............................................................................................................
...............................................................................................................
(1)
(ii) By looking at the graphs, the doctor is able to tell if there is a problem with the
patient’s kidneys.
Which one of the following statements is correct?
Put a tick ( ) in the box next to your answer.
Only the right kidney is working correctly.
Only the left kidney is working correctly.
Both kidneys are working correctly.
Explain the reason for your answer.
...............................................................................................................
...............................................................................................................
...............................................................................................................
...............................................................................................................
(3)
Page 46 of 99
46. (c) The patient was worried about having a radioactive isotope injected into their body. The
doctor explained that the risk to the patient’s health was very small as technetium-99 has a
short half-life.
(i) What does the term half-life mean?
...............................................................................................................
...............................................................................................................
(1)
(ii) Explain why it is important that the doctor uses an isotope with a short half-life rather
than an isotope with a long half-life.
...............................................................................................................
...............................................................................................................
...............................................................................................................
...............................................................................................................
(2)
(Total 9 marks)
Page 47 of 99
47. The pie chart shows the sources of the background radiation and the radiation doses that the
average person in the UK is exposed to in one year.
Radiation dose is measured in millisieverts (mSv).
(a) (i) What is the total radiation dose that the average person in the UK receives?
...............................................................................................................
...............................................................................................................
Total radiation dose = .................................................. mSv
(1)
19
Page 48 of 99
48. (ii) A student looked at the pie chart and then wrote down three statements.
Which one of the following statements is a correct conclusion from this data?
Put a tick ( ) in the box next to your answer.
In the future, more people will be exposed to a greater proportion of
radon gas.
People that have never had an X-ray get 50% of their radiation dose from
radon gas.
The radiation dose from natural sources is much greater than from artificial
sources.
(1)
(b) The concentration of radon gas inside a home can vary from day to day. In some homes,
the level can build up to produce a significant health risk. It is estimated that each year
1000 to 2000 people die because of the effects of radiation from radon gas.
(i) It is not possible to give an exact figure for the number of deaths caused by the
effects of radiation from radon gas. Why?
...............................................................................................................
...............................................................................................................
(1)
Page 49 of 99
49. The table gives data for the radiation levels measured in homes in 4 different parts of
the UK. The radiation levels were measured using two detectors, one in the living
room and one in the bedroom. The measurements were taken over 3 months.
Area
of
the UK
Number of
homes
in the area
Number of homes
in the sample
Average
radiation
level in
Bq/m3
Maximum
radiation
level in
Bq/m3
A 590 000 160 15 81
B 484 000 130 18 92
C 221 000 68 000 162 10 000
D 318 000 35 300 95 6 900
(ii) Give one reason why the measurements were taken over 3 months using detectors
in different rooms.
...............................................................................................................
...............................................................................................................
(1)
(iii) Use information from the table to suggest why a much higher proportion of homes
were sampled in areas C and D than in areas A and B.
...............................................................................................................
...............................................................................................................
...............................................................................................................
(2)
(Total 6 marks)
Page 50 of 99
50. (a) The pie chart shows the average proportions of natural background radiation from various
sources in one part of the UK.
20
(i) What proportion of the background radiation comes from radon gas?
...................................................................................................................
(1)
(ii) Suggest why our bodies are slightly radioactive.
...................................................................................................................
...................................................................................................................
(1)
(b) The level of background radiation from cosmic rays is not the same everywhere. For every
30 metres above sea level, the amount of background radiation increases by one unit.
The diagram shows the position of two villages, A and B, built on a hill.
Page 51 of 99
51. How is the amount of background radiation from cosmic rays different in village A
compared to village B?
To obtain full marks you must include a calculation in your answer.
.............................................................................................................................
.............................................................................................................................
.............................................................................................................................
.............................................................................................................................
.............................................................................................................................
.............................................................................................................................
(3)
(Total 5 marks)
A radioactive source emits alpha (α), beta (β) and gamma (γ) radiation. The diagram shows what
happens to the radiation as it passes between two charged metal plates.
(a) Which line P, Q or R shows the path taken by:
21
(i) alpha radiation ....................
(1)
(ii) gamma radiation? ....................
(1)
Page 52 of 99
52. (b) The diagram shows three different boxes and three radioactive sources. Each source emits
only one type of radiation and is stored in a different box. The box reduces the amount of
radiation getting into the air.
Draw three lines to show which source should be stored in which box so that the minimum
amount of radiation gets into the air.
(2)
(c) The graphs show how the count rates from three different radioactive sources, J, K, and L,
change with time.
Page 53 of 99
53. (i) Which source, J, K, or L, has the highest count rate after 24 hours?
..............
(1)
(ii) For source L, what is the count rate after 5 hours?
............................. counts per second
(1)
(iii) Which source, J, K, or L, has the longest half-life?
........................................
(1)
(iv) A radioactive source has a half-life of 6 hours.
What might this source be used for?
Put a tick ( ) in the box next to your choice.
To monitor the thickness of paper as it is made in a factory
To inject into a person as a medical tracer
To make a smoke alarm work
(1)
(Total 8 marks)
(a) A radioactive source emits alpha (α), beta (β) and gamma (γ) radiation.
(i) Which two types of radiation will pass through a sheet of card?
...................................................................................................................
(1)
(ii) Which two types of radiation would be deflected by an electric field?
...................................................................................................................
(1)
(iii) Which type of radiation has the greatest range in air?
...................................................................................................................
(1)
22
Page 54 of 99
54. (b) A student suggests that the radioactive source should be stored in a freezer at – 20 °C.
The student thinks that this would reduce the radiation emitted from the source.
Suggest why the student is wrong.
.............................................................................................................................
.............................................................................................................................
(1)
(c) Phosphorus-32 is a radioactive isotope that emits beta radiation.
(i) How is an atom of phosphorus-32 different from an atom of the stable isotope
phosphorus-31?
...................................................................................................................
...................................................................................................................
(1)
(ii) The graph shows how the count rate of a sample of phosphorus-32 changes with
time.
Use the graph to calculate the half-life of phosphorus-32.
Show clearly how you used the graph to obtain your answer.
...................................................................................................................
...................................................................................................................
Half-life = ....................................... days
(2)
Page 55 of 99
55. (iii) Plants use phosphorus compounds to grow. Watering the root system of a plant with
a solution containing a phosphorus-32 compound can help scientists to understand
the growth process.
Explain why phosphorus-32 is suitable for use as a tracer in this situation.
...................................................................................................................
...................................................................................................................
...................................................................................................................
...................................................................................................................
(2)
(Total 9 marks)
The table shows the average background radiation dose from various sources that a person
living in Britain receives in one year.
Source of background
radiation
Average amount each year in
dose units
Buildings 50
Food anddrink 300
Medicaltreatments (including X-rays) 300
Radon gas 1250
Rocks 360
Space(cosmic rays) 240
TOTAL 2500
23
Page 56 of 99
56. (a) Only two of the following statements are true.
Tick ( ) the boxes next to the true statements.
Half the average background radiation dose comes from radon gas.
Everyone receives the same background radiation dose.
Cosmic rays produce less background radiation than food and
drink.
(1)
(b) Most sources of background radiation are natural but some are artificial (man-made).
Which source of background radiation given in the table is artificial?
.............................................................................................................................
(1)
(c) Each time a dental X-ray is taken, the patient receives about 20 units of radiation.
How many dental X-rays would give the yearly average dose for medical treatments?
.............................................................................................................................
.............................................................................................................................
Number of X-rays = ...............................................
(2)
(Total 4 marks)
Page 57 of 99
57. (a) The names of three types of nuclear radiation are given in List A. Some properties of
these three types of radiation are given in List B.
Draw a straight line to link each type of radiation in List A to its correct property in List B.
Draw only three lines.
List A List B
Type of nuclear radiation Property of radiation
(3)
24
(b) Nuclear radiation is given out from the centre of some types of atom.
What name is given to the centre of an atom? ..........................................................
(1)
Page 58 of 99
58. (c) One of the substances in the table is used as a radioactive tracer. A hospital patient
breathes in air containing the tracer. The radiation given out is measured by a doctor using
a detector outside the patient’s body.
Substance
Radiation
given out
Solid, liquid
or gas
X alpha gas
Y gamma gas
Z gamma solid
Which one of the substances, X, Y or Z, should be used as the tracer? ....................
Give two reasons for your answer.
1 ..........................................................................................................................
.............................................................................................................................
2 ..........................................................................................................................
.............................................................................................................................
(3)
(d) Radiation can also be used to kill the bacteria on fresh food.
Give one reason why farmers, shop owners or consumers may want food to be treated
with radiation.
.............................................................................................................................
.............................................................................................................................
(1)
(Total 8 marks)
Page 59 of 99
59. In 1986, a nuclear reactor exploded in a power station at Chernobyl in the Ukraine.
(a) The table gives information about some of the radioactive substances released into the air
by the explosion.
Radioactive
substance
Half-life
Type of
radiation
emitted
Iodine-131 8 days beta and gamma
Caesium-134 2 years beta
Caesium-137 30 years beta
(i) How is the structure of a caesium-134 atom different from the structure of a
caesium-137 atom?
...................................................................................................................
(1)
25
(ii) What is a beta particle and from which part of an atom is a beta particle emitted?
...................................................................................................................
...................................................................................................................
(1)
(iii) Once a radioactive substance is dissolved in rainwater, it can enter the food chain.
Following the Chernobyl explosion, some milk supplies were found to be radioactive.
If one litre of milk contaminated with iodine-131 gives a count rate of 400
counts/second, how long will it take for the count rate to fall to 25 counts/second?
Show clearly how you work out your answer.
...................................................................................................................
...................................................................................................................
...................................................................................................................
Time taken = ................................................. days
(2)
Page 60 of 99
60. (iv) After 20 years, the caesium-137 emitted into the atmosphere is a more serious
problem than the iodine-131.
Explain why.
...................................................................................................................
...................................................................................................................
...................................................................................................................
...................................................................................................................
...................................................................................................................
(2)
(b) The bar chart compares the incidence of thyroid cancer in Ukrainian children, aged 0–14
years, before and after the Chernobyl explosion.
Of the children that developed thyroid cancer, 64% lived in the areas most contaminated
by the radiation.
Page 61 of 99
61. Considering this data, can you be certain that a child who developed thyroid cancer
between 1986 and 1990 did so because of the Chernobyl explosion?
Explain the reason for your answer.
.............................................................................................................................
.............................................................................................................................
.............................................................................................................................
.............................................................................................................................
(2)
(c) In 1991, some scientists compared the health of two groups of people: a control group and
a group that had been exposed to the radiation from Chernobyl.
What people would have been in the control group?
.............................................................................................................................
(1)
(d) Although there are some risks associated with nuclear power stations, it is likely that new
ones will be built.
Give two reasons to justify the use of nuclear power.
1 ..........................................................................................................................
.............................................................................................................................
2 ..........................................................................................................................
.............................................................................................................................
(2)
(Total 11 marks)
Page 62 of 99
62. (a) The table gives information about the radioactive isotope, radon-222.
mass number 222
atomic number 86
radiation
emitted
alpha
particle
(i) Complete the following sentence.
The mass number is the total number of ............................................................ and
.................................................. inside an atom.
(2)
26
(ii) Radon-222 is an isotope of radon.
How many protons are there in an atom of radon-222?
...................................
(1)
(iii) When an atom of radon-222 emits an alpha particle, the radon-222 changes into an
atom of polonium-218.
An alpha particle consists of 2 protons and 2 neutrons.
How is the structure of the nucleus of a polonium-218 atom different from the
structure of the nucleus of a radon-222 atom?
...................................................................................................................
(1)
Page 63 of 99
63. (b) The pie chart shows the average radiation dose that a person in the UK receives each year
from natural background radiation.
The doses are measured in millisieverts (mSv).
(i) Calculate the proportion of natural background radiation that comes from radon.
Show clearly how you work out your answer.
...................................................................................................................
...................................................................................................................
Proportion of radon = .................................................
(2)
(ii) Not all background radiation is from natural sources.
Name one source of background radiation that is not natural.
...................................................................................................................
(1)
Page 64 of 99
64. (c) The bar chart shows the average yearly dose from natural background radiation in different
European countries.
(i) How many times bigger is the average annual background dose in Germany
compared to the UK?
...................................................................................................................
(1)
Page 65 of 99
65. (ii) The following table gives the effects of different radiation doses on the human body.
Radiation dose in mSv Effects
10 000 Immediate illness; death within a few weeks
1 000 Radiation sickness; unlikely to cause death
50 Lowest dose with evidence of causing cancer
A family goes to Germany for a two-week holiday. Should they be concerned about
the higher level of background radiation in Germany?
Draw a ring around your answer.
Yes No
Explain your answer.
...................................................................................................................
...................................................................................................................
...................................................................................................................
...................................................................................................................
(2)
(Total 10 marks)
Page 66 of 99
66. (a) The names of three types of radiation are given in List A. Various properties of these three
types of radiation are given in List B.
Draw a line to link each type of radiation in List A to its correct property in List B. Draw
only three lines.
(3)
27
(b) This sign warns people that a radioactive source is being used in a laboratory.
Why is it important to warn people that a radioactive source is being used?
.............................................................................................................................
.............................................................................................................................
(1)
(c) To study the blood flow in a patient’s lungs, a doctor injects some technetium-99 compound
into the patient. The gamma radiation given out by the technetium-99
atoms is detected using a gamma camera outside the patient’s body.
Which statement gives the reason why gamma radiation is used? Put a tick ( ) in the box
next to your choice.
It can travel through a vacuum.
It is not affected by a magnet.
It can pass through the human body.
(1)
Page 67 of 99
67. (d) The graph shows how the count rate from a sample of technetium-99 changes with time.
(a) Alpha particles (α), beta particles (β) and gamma rays (γ) are types of nuclear radiation.
28
(i) Which of the three types of radiation is the most strongly ionising?
...................................................................................................................
(1)
(ii) What effect does nuclear radiation have on living cells?
...................................................................................................................
(1)
Page 68 of 99
68. (b) The diagrams show a G-M tube and counter used to measure the radiation emitted from a
source. Both diagrams show the reading on the counter one minute after it was switched
on.
Explain why the counter readings show that the source is giving out only gamma radiation.
.............................................................................................................................
.............................................................................................................................
.............................................................................................................................
.............................................................................................................................
(2)
(c) The box gives information about the radioactive isotope technetium-99.
Type of radiation emitted: gamma
Half-life: 6 hours
Used as a medical tracer
What is meant by the term half-life?
.............................................................................................................................
.............................................................................................................................
(1)
Page 69 of 99
69. (d) To study the blood flow in a patient’s lungs, a doctor injects a small quantity of a
technetium-99 compound into the patient. The radiation emitted by the technetium-99
atoms is detected outside the patient’s body.
Explain why a doctor would not use a radioactive isotope with a very short half-life, such as
2 seconds, as a medical tracer.
.............................................................................................................................
.............................................................................................................................
.............................................................................................................................
.............................................................................................................................
(2)
(Total 7 marks)
Some types of food are treated with gamma radiation. Low doses of radiation slow down the
ripening of fresh fruit and vegetables while higher doses of radiation kill the bacteria that make
the food go off.
(a) (i) What is gamma radiation?
...................................................................................................................
(1)
29
(ii) Food packed in crates or boxes can be treated using this method.
Why must a source that emits gamma radiation be used?
...................................................................................................................
...................................................................................................................
(1)
(iii) A suitable source of gamma radiation is the isotope caesium 137.
Complete the following sentence by choosing the correct word from the box.
electrons neutrons protons
An atom of caesium 137 has two more .............................................. than an atom of
caesium 135.
(1)
Page 70 of 99
70. (b) The diagram shows how a conveyor belt can be used to move food past the radioactive
source.
(i) How do the concrete walls reduce the radiation hazard to workers outside the food
treatment area?
...................................................................................................................
...................................................................................................................
(1)
(ii) Suggest one way that the dose of radiation received by the food could be increased
other than by changing the radioactive source.
...................................................................................................................
...................................................................................................................
(1)
(c) Some people may not like the idea of eating food treated with radiation.
(i) What evidence could a food scientist produce to show that food treated with radiation
is safe to eat?
...................................................................................................................
...................................................................................................................
...................................................................................................................
...................................................................................................................
(2)
Page 71 of 99
71. (ii) The diagram shows the sign displayed on food treated with radiation.
Why is it important for people to know which foods have been treated with radiation?
...................................................................................................................
...................................................................................................................
(1)
(Total 8 marks)
The diagram shows a radiation detector and counter being used to measure background
radiation. The number shows the count ten minutes after the counter was reset to zero.
30
(i) Name one source of background radiation.
.............................................................................................................................
(1)
Page 72 of 99
72. (ii) Calculate the average background radiation level, in counts per second. Show clearly how
you work out your answer.
.............................................................................................................................
.............................................................................................................................
Background radiation level = ...................... counts per second
(2)
(Total 3 marks)
(a) The table gives information about six radioactive isotopes.
Isotope Type of radiation emitted Half-life
hydrogen-3 beta particle 12 years
iridium-192 gamma ray 74 days
polonium-210 alpha particle 138 days
polonium-213 alpha particle less than 1 second
technetium-99 gamma ray 6 days
uranium-239 beta particle 24 minutes
(i) What is an alpha particle?
...................................................................................................................
(1)
31
(ii) Two isotopes of polonium are given in the table. How do the nuclei of these two
isotopes differ?
...................................................................................................................
(1)
Page 73 of 99
73. (iii) A doctor needs to monitor the blood flow through a patient’s heart. The doctor injects
a radioactive isotope into the patient’s bloodstream. The radiation emitted by the
isotope is then detected outside the body.
Which one of the isotopes in the table would the doctor inject into the bloodstream?
...................................................................................................................
Explain the reasons for your choice.
...................................................................................................................
...................................................................................................................
...................................................................................................................
...................................................................................................................
(3)
(b) Igneous rock contains uranium-238 which eventually changes to the stable isotope
lead-206. The graph shows how the percentage of uranium-238 nuclei present in an
igneous rock changes with time.
Page 74 of 99
74. A rock sample is found to have seven atoms of uranium-238 for every three atoms of
lead-206. Use the graph to estimate the age of the rock. Show clearly how you obtain your
answer.
.............................................................................................................................
.............................................................................................................................
Age of rock = .................................... million years
(2)
(Total 7 marks)
The diagram shows a badge used to monitor radiation. It measures the amount of radiation a
worker has been exposed to in one month.
32
(i) What is used inside the badge to detect radiation?
.............................................................................................................................
(1)
(ii) What would indicate that the worker has been exposed to a high level of radiation as
opposed to a low level of radiation?
.............................................................................................................................
.............................................................................................................................
(1)
(iii) Why is it important to monitor the amount of radiation the worker has been exposed to?
.............................................................................................................................
.............................................................................................................................
(1)
(Total 3 marks)
Page 75 of 99
75. Radiation is around us all of the time. The pie chart shows the sources of this radiation.
33
(i) What is the main source of this radiation?
.............................................................................................................................
(1)
(ii) What name is given to the radiation that is around us all of the time?
.............................................................................................................................
(1)
(Total 2 marks)
The table shows how the count rate from a radioactive substance changes in 10 days.
Time in days 0 2 4 6 8 10
Count rate in
countsper minute
880 555 350 220 140 90
34
Page 76 of 99
76. (a) Draw a graph of count rate against time.
The first two points have been plotted for you.
(3)
(b) (i) Use your graph to find out how long it takes for the count rate to fall from 880 counts
per minute to 440 counts per minute.
Time = ....................................... days
(1)
(ii) What is the half-life of this substance?
Half-life = ....................................... days
(1)
Page 77 of 99
77. (c) The table gives the half-life and type of radiation given out by four different radioactive
isotopes.
Radioactive
isotope
Half-life
in days
Radiation given out
bismuth-210 5.0 beta
polonium-210 138.0 alpha and gamma
radon-222 3.8 alpha
thorium-234 24.1 beta and gamma
Some samples of each isotope have the same count rate today. Which sample will have
the lowest count rate one month from today?
.............................................................................................................................
Give a reason for your answer.
.............................................................................................................................
(2)
(Total 7 marks)
The different sources of radiation to which we are exposed are shown in the pie chart. Some
sources are natural and some artificial.
35
Page 78 of 99
78. (i) Name one natural source of radiation shown in the pie chart.
.............................................................................................................................
(1)
(ii) Name one artificial source of radiation shown in the pie chart.
.............................................................................................................................
(1)
(Total 2 marks)
(a) A radioactive source can give out three types of emission:
alpha particles
beta particles
gamma radiation.
The diagram shows the paths taken by the radiation emitted by two sources, X and Y.
What types of radiation are emitted by each of the sources?
Source X emits ...................................................................................................
Source Y emits ...................................................................................................
(2)
36
Page 79 of 99
79. (b) The diagram shows a disposable syringe sealed inside a plastic bag. After the bag has
been sealed the syringe is sterilised using radiation.
Explain why radiation can be used to sterilise the syringe.
.............................................................................................................................
.............................................................................................................................
.............................................................................................................................
.............................................................................................................................
(3)
(Total 5 marks)
The pie chart shows the main sources of background radiation. Each source contributes to the
average yearly radiation dose.
37
(i) What is meant by the term background radiation?
.............................................................................................................................
.............................................................................................................................
(1)
Page 80 of 99
80. (ii) Suggest why an airline pilot is likely to get a higher than average yearly radiation dose.
.............................................................................................................................
.............................................................................................................................
.............................................................................................................................
(2)
(Total 3 marks)
(a) The diagram shows three different boxes and three radioactive sources. Each source is
stored in a different box.
38
Draw lines to show which source should be stored in each box so that the risk of radiation
leakage is a minimum.
(2)
Page 81 of 99
81. (b) A leak in an underground oil pipe can be found by injecting a radioactive isotope into the
oil. The ground is then tested with a radiation detector and counter.
(i) State the type of detector used.
...................................................................................................................
(1)
(ii) Complete the sketch graph to show how the reading on the detector will change as it
passes along the ground above the pipe.
(1)
(c) Gamma radiation can be used to kill cancer cells inside a person’s head. During the
treatment the patient is kept perfectly still while the source of gamma radiation moves in a
circle.
(i) Why is a source of gamma radiation the most suitable for this treatment?
...................................................................................................................
(1)
Page 82 of 99
82. (ii) Suggest why a moving source of radiation is used rather than one which is kept
stationary.
...................................................................................................................
...................................................................................................................
...................................................................................................................
...................................................................................................................
(2)
(iii) Gamma radiation is an electromagnetic wave. Give two properties common to all
electromagnetic waves.
1 ................................................................................................................
...................................................................................................................
2 ................................................................................................................
...................................................................................................................
(2)
(Total 9 marks)
(a) The table shows the half-life of some radioactive isotopes.
Radioactive isotope Half-life
magnesium-27 10 minutes
sodium-24 15 hours
sulphur-35 87 days
cobalt-60 5 years
39
(i) What is meant by the term radioactive?
...................................................................................................................
...................................................................................................................
(1)
Page 83 of 99
83. (ii) Which one of the isotopes in the table could form part of a compound to be used as a
tracer in medicine? Explain the reason for your choice.
...................................................................................................................
...................................................................................................................
...................................................................................................................
...................................................................................................................
...................................................................................................................
(3)
(iii) Draw a graph to show how the number of radioactive atoms present in the isotope
cobalt-60 will change with time.
(3)
Page 84 of 99
84. (b) Nuclear power stations provide about 17% of the world’s electricity. They add less than 1%
to the total background levels of radiation. Some people are opposed to the use of nuclear
fuels for the generation of electricity. Explain why.
.............................................................................................................................
.............................................................................................................................
.............................................................................................................................
.............................................................................................................................
.............................................................................................................................
.............................................................................................................................
(3)
(Total 10 marks)
(a) The pie-chart shows the main sources of background radiation.
40
(i) Which source in the pie-chart adds the smallest amount of radiation to
background levels?
...................................................................................................................
(1)
(ii) Name two natural sources of background radiation in the pie-chart.
1. ...............................................................................................................
2. ...............................................................................................................
(2)
Page 85 of 99
85. (b) The diagrams show how a radiation detector and counter can be used to measure radiation
levels. In each case the numbers show the count one minute after the counter is switched
on.
(i) How many counts are just from background
radiation?
.........................................................
(ii) How many counts are just from the source?
........................................................
(iii) What type of radiation did the source give out?
........................................................
Give a reason for your answer.
........................................................
........................................................
........................................................
........................................................
(4)
(Total 7 marks)
(a) A radiation detector and counter were used to detect and measure the radiation emitted
from a weak source. The graph shows how the number of counts recorded in one minute
changed with time.
41
Page 86 of 99
86. (i) Even though the readings from the counter were accurately recorded, not all the
points fit the smooth curve. What does this tell us about the process of radioactive
decay?
...................................................................................................................
(1)
(ii) After ten minutes the number of counts recorded each minute is almost constant.
Explain why.
...................................................................................................................
...................................................................................................................
...................................................................................................................
(2)
(b) The radioactive isotope sodium-24 injected into the bloodstream can be used to trace blood
flow to the heart. Sodium-24 emits both beta particles and gamma rays.
(i) What is a beta particle?
...................................................................................................................
(1)
(ii) What is a gamma ray?
...................................................................................................................
...................................................................................................................
(1)
(iii) The count rate from a solution containing sodium-24 decreases from 584 counts per
minute to 73 counts per minute in 45 hours. Calculate the half-life of sodium-2.2.
Show clearly how you work out your answer.
...................................................................................................................
...................................................................................................................
...................................................................................................................
Half-life = ............................. hours
(3)
Page 87 of 99
87. (iv) Give one advantage of using sodium-24 to trace blood flow compared to using an
isotope with a half-life of:
[A] ten years; .............................................................................................
...................................................................................................................
(1)
[B] ten seconds. ........................................................................................
...................................................................................................................
(1)
(Total 10 marks)
(a) Tritium ( ) is an isotope of hydrogen. Tritium has a proton number of 1 and a mass
number of 3.
(i) The diagram below shows a simple model of a tritium atom. Complete the diagram by
adding the names of the particles indicated by the labels.
(4)
42
(ii) Explain how the nucleus of an ordinary hydrogen atom is different from the nucleus of
a tritium atom. Ordinary hydrogen atoms ( ) have a mass number of 1.
...................................................................................................................
...................................................................................................................
...................................................................................................................
(2)
(iii) Tritium is a radioactive substance which emits beta (β) radiation.
Why do the atoms of some substances give out radiation?
...................................................................................................................
...................................................................................................................
(2)
Page 88 of 99
88. (b) Tritium is one of the elements found in the waste material of the nuclear power industry.
The diagram below shows a worker behind a protective screen. The container holds a
mixture of different waste materials which emit alpha (α), beta (β) and gamma (γ) radiation.
Suggest a suitable material for the protective screen. The material should prevent radiation
from the container reaching the worker. Explain your answer.
.............................................................................................................................
.............................................................................................................................
.............................................................................................................................
(2)
(Total 10 marks)
Page 89 of 99