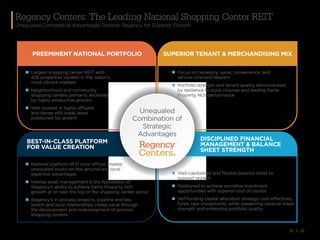
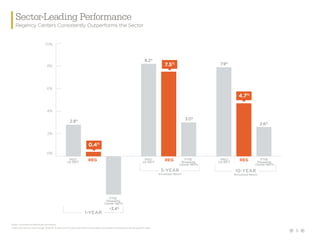
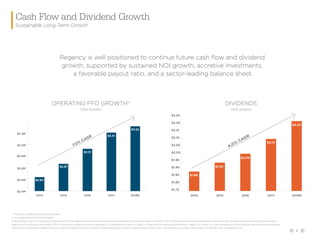
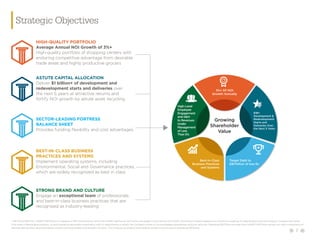
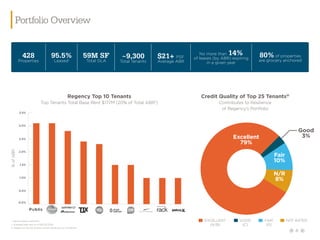
Regency Centers is the preeminent national owner, operator, and developer of shopping centers located in affluent and densely populated trade areas. Our portfolio includes thriving properties merchandised with highly productive grocers, restaurants, service providers, and best-in-class retailers that connect to their neighborhoods, communities, and customers. Operating as a fully integrated real estate company, Regency Centers is a qualified real estate investment trust (REIT) that is self-administered, self-managed, and an S&P 500 Index member. For more information, please visit regencycenters.com.
We have world-class expertise building world-class businesses. We are leading global experts in qualified, professional and skilled recruitment and employ 9,214 people in 33 countries across 20 specialisms.
Visit https://www.haysplc.com/investors/annual-report-2016 to view and download the full Annual Report 2016.
4Q 2018 Investor Presentation - Regency Centers Jan Hanak
Regency Centers is the preeminent national owner, operator, and developer of shopping centers located in affluent and densely populated trade areas. Our portfolio includes thriving properties merchandised with highly productive grocers, restaurants, service providers, and best-in-class retailers that connect to their neighborhoods, communities, and customers. Operating as a fully integrated real estate company, Regency Centers is a qualified real estate investment trust (REIT) that is self-administered, self-managed, and an S&P 500 Index member. For more information, please visit regencycenters.com.
2Q 2019 Investor Presentation - Regency Centers Jan Hanak
Regency Centers is the preeminent national owner, operator, and developer of shopping centers located in affluent and densely populated trade areas. Our portfolio includes thriving properties merchandised with highly productive grocers, restaurants, service providers, and best-in-class retailers that connect to our neighborhoods, communities, and customers. Operating as a fully integrated real estate company, Regency Centers is a qualified real estate investment trust (REIT) that is self-administered, self-managed, and an S&P 500 Index member. For more information, please visit regencycenters.com.
3Q 2018 Investor Presentation - Regency Centers Jan Hanak
Regency Centers is the preeminent national owner, operator, and developer of shopping centers located in affluent and densely populated trade areas. Our portfolio includes thriving properties merchandised with highly productive grocers, restaurants, service providers, and best-in-class retailers that connect to their neighborhoods, communities, and customers. Operating as a fully integrated real estate company, Regency Centers is a qualified real estate investment trust (REIT) that is self-administered, self-managed, and an S&P 500 Index member. For more information, please visit regencycenters.com.
1Q 2018 Investor Presentation - Regency Centers Jan Hanak
Regency Centers is the preeminent national owner, operator, and developer of shopping centers located in affluent and densely populated trade areas. Our portfolio includes thriving properties merchandised with highly productive grocers, restaurants, service providers, and best-in-class retailers that connect to their neighborhoods, communities, and customers. Operating as a fully integrated real estate company, Regency Centers is a qualified real estate investment trust (REIT) that is self-administered, self-managed, and an S&P 500 Index member. For more information, please visit regencycenters.com.
Mercer Capital's Value Focus: Auto Dealer Industry | Mid-Year 2018Mercer Capital
Mercer Capital's Auto Dealer Industry newsletter provides perspective on valuation issues. Each newsletter also includes a macroeconomic trends, industry trends, and guideline public company metrics.
Regency Centers is the preeminent national owner, operator, and developer of shopping centers located in affluent and densely populated trade areas. Our portfolio includes thriving properties merchandised with highly productive grocers, restaurants, service providers, and best-in-class retailers that connect to their neighborhoods, communities, and customers. Operating as a fully integrated real estate company, Regency Centers is a qualified real estate investment trust (REIT) that is self-administered, self-managed, and an S&P 500 Index member. For more information, please visit regencycenters.com.
Recent Trends Fueling The Surge in Farmhouse Demand in IndiaFarmland Bazaar
Embarking on the journey to acquire a farmhouse for sale is just the beginning; the real investment lies in crafting an environment that contributes to our mental and physical well-being while satisfying the soul. At Farmlandbazaar.com, India’s leading online marketplace dedicated to farm land, farmhouses, and agricultural lands, we understand the importance of transforming a humble farmland into a warm and inviting sanctuary. Let's explore the fundamental aspects that can elevate your farmhouse into a tranquil haven.
Dynamics 365 Bid Management for Construction ProjectsDynamic Netsoft
This PDF provides a straightforward guide to using Dynamics 365 for efficient bid management in construction projects. Learn how to streamline processes, improve accuracy, and enhance productivity with practical tips and step-by-step instructions.
https://dnetsoft.com/dynamics-365-bid-management-software
Investing In The US As A Canadian… And How To Do It RIGHT!! (feat. Erwin Szet...Volition Properties
=== Investing In The US As A Canadian… And How To Do It RIGHT!! (feat. Erwin Szeto) ===
Ever been curious about Real Estate Investing in the US?? At Volition, for the past 14 years, we have been focused on helping investors invest in over $250M of real estate and generate $100M of wealth in the Toronto market, but we are always open to learning more about other business models and learning from other investors.
The US has always been an intriguing market to invest in. But the US is a big place… if you’re interested in investing in the US, you probably have a lot of questions, like:
☑️ Specifically WHERE should you invest?
☑️ What are the best markets to invest in and why?
☑️ How much are property prices there?
☑️ What are the returns like?
☑️ What is cashflow like?
☑️ Compared to investing in Toronto or other cities in Ontario, what are the benefits / tradeoffs?
☑️ What ownership structure should I use?
☑️ What are the tax implications?
☑️ Can I get financing?
☑️ What are tenants like?
Enter Erwin Szeto, a longtime friend of Volition. Since 2005, Erwin Szeto and his team have navigated the challenging landscape of being landlords in Ontario. Now, they are shifting their focus and guiding their clients' investments toward the more landlord-friendly environment of the USA. This decision comes after assisting Canadian clients in transacting over $440,000,000 in income properties. Faced with issues like affordability constraints, tenant-friendly laws, rent control, and rental licensing in Canada, Erwin sees a clear opportunity in the U.S. Here, there is a significant influx of investments leading to the creation of high-paying manufacturing jobs. Erwin and his clients are poised to capitalize on these opportunities where landlord rights are stronger and there is no rent control.
To facilitate this transition, Erwin has partnered with and become a client of SHARE, a one-stop-shop U.S. Asset Manager. Founded by Canadians for Canadians, SHARE enables as passive an ownership experience as possible for landlords in the U.S., while still maintaining direct, 100% ownership.
Erwin is “Making Real Estate Investing Great Again”!!
Website: https://www.infinitywealth.ca/
Facebook: https://www.facebook.com/iwinrealestate and https://www.facebook.com/ErwinSzetoOfficial
Podcast: https://www.truthaboutrealestateinvesting.ca/
Instagram: https://www.instagram.com/iwinrealestate/ and https://www.instagram.com/erwinszeto/
Keep Your Home Naturally Cool and Warm Out Change in Seasons
Vinra Construction is a private limited company registered under the ROC. The management has an experience of over 15 years of understanding the needs and delivering apt solutions to the end users We are providing turnkey solutions in construction fields. like Construction, Interior Designing Facility Management, Plantation Management, etc..
Vinra Construction Tech Enabled Company for Eco-Friendly Home Construction
Contact With Vinra for a Greener Future >>> Call us @ 888 4898 765
Discover Yeni Eyup Evleri 2, nestled among the rising values of Eyupsultan, offering the epitome of modern living in Istanbul.
With its spacious living areas, contemporary architecture, and meticulous details, Yeni Eyup Evleri 2 is poised to be the star of your happiest moments. Situated in the new favorite district of Eyupsultan, claim your spot and unlock the doors to a peaceful life alongside your loved ones. Nestled next to the historical and natural beauties of Eyupsultan, embrace the comfort of modern living and rediscover life.
Social Amenities:
Yeni Eyup 2 offers a life filled with joy with its green landscaping areas, gym, sauna, children’s play areas, café, outdoor pool, and basketball court. Reserve your place for unforgettable moments!
Reliable Structure:
With 1+1, 2+1, and 3+1 apartment options, Yeni Eyup Evleri 2 is designed with first-class materials and craftsmanship. The doors to a safe and comfortable life are here! Choose the option that suits you best and step into your dream home.
Project:
Yeni Eyup 2 is conveniently located, with Istanbul Airport just 26 minutes away, the Mecidiyeköy Metro Line 4 minutes away, and the Tram Stop 5 minutes away, making your life easier with its central location.
Location:
Your home is positioned in a privileged location, providing easy access to the city center, shopping malls, restaurants, schools, and other important places.
Yeni Eyup 2 offers 1+1, 2+1, and 3+1 apartment options designed to meet different needs. Find an option suitable for every lifestyle and open the doors to a comfortable life in your dream home.
https://listingturkey.com/property/yeni-eyup-evleri-2/
Brigade Insignia offers meticulously designed apartments with modern architecture and premium finishes. The project features spacious 3,3.5,4 and 5 BHK units, each thoughtfully planned to provide maximum comfort, natural light, and ventilation.
https://www.newprojectbangalore.com/brigade-insignia-yelahanka-bangalore.html
One FNG by Group 108 Sector 142 Noida Construction UpdateOne FNG
One FNG by Group 108 is launching a new commercial project in Sector 142 Noida. Office space and high street retail shops on the FNG and Noida Expressway. For more information visit the website https://www.onefng.com/
Simpolo Tiles & Bathware
Tile ho,
toh Simpolo.
Since the first steps were taken in 1977, Simpolo Ceramics has carved its niche as a consistently growing organisation with unparalleled innovation and passion rooted in simplicity.
We endure gratification for every experience we offer, created to share something meaningful. It may not resonate with the majority, but that makes us a class apart. If only a handful were to understand the purpose of our existence, we would be proud to have found our believers. Rather, people with whom we can share our beliefs.
VISUALIZER
Design your space in your style with our very own Visualizer. Now, you can choose the tiles of your liking from our wide selection and see how they would look in a space. Select the tile from the multiple options and the visualiser will replace the surfaces in the image with the selected tiles. This way, instead of just your imagination, you can choose the tiles for your place by getting an actual picture of how they would look in a space. So, design your space the way you desire digitally and implement it in real life to get the best results!
You can also share this visualiser with others to help them design their space.
Committed to delighting customers with world-class ceramic products and services. Make Simpolo synonymous with the best quality and set new benchmarks of excellence for all stakeholders. Pursue best business practices with utmost integrity to make Simpolo an exciting organisation to work with, for vendors, channel partners, investors and employees alike.
Gain worldwide recognition in the field of ceramic building products through Research and Innovation and bring an enhanced lifestyle within reach for every household.
The KA Housing - Catalogue - Listing TurkeyListing Turkey
Welcome to KA Housing, a distinguished real estate development nestled in the heart of Eyüpsultan, one of Istanbul’s most promising districts.
Just 10 minutes from the bustling city center, Eyüpsultan offers a serene escape with the convenience of urban living. The direct metro line ensures seamless connectivity to all parts of Istanbul, making it an ideal location for residents who seek both tranquility and vibrancy.
KA Housing boasts unparalleled accessibility, with proximity to Istanbul Airport only 30 minutes away, facilitating easy international travel. Effortless city access is guaranteed by direct metro and transportation links to Istanbul’s cultural and commercial hubs. Quick access to key metro lines connects you to every corner of the city within minutes, making commuting and exploring the city hassle-free.
The development offers luxurious living spaces with a range of unit layouts from 1+1 to 4+1, designed with meticulous attention to detail. Each unit features balconies or terraces, providing stunning vistas of Istanbul and enhancing the living experience. High-quality materials and superior craftsmanship ensure durability and elegance, while sound-proof insulation and high ceilings (2.95 m) offer comfort and sophistication.
Residents of KA Housing enjoy exclusive on-site amenities, including a state-of-the-art gym, outdoor swimming pool, yoga area, and walking paths. Entertainment options abound with a private cinema, children’s playground, and a variety of dining options including a café and restaurant. Security and convenience are paramount with 24/7 security, a dedicated carpark garage, and an IP intercom system.
KA Housing represents a prime investment opportunity with limited availability in a high-demand area, ensuring enduring value and potential for lucrative returns. Homes in this development provide exceptional value without compromising on quality, offering affordable luxury for discerning buyers. The construction is of the highest quality, built to the latest seismic and disaster resistance standards, ensuring safety and resilience.
The community and surroundings of KA Housing are enriched by close proximity to prestigious universities such as Haliç University, Bilgi University, and Istanbul Ticaret University, making it an ideal location for students and academics. The development is adjacent to the Alibeyköy stream leading into the Halic waters, offering serene natural escapes amidst lush greenery. Residents can enjoy the cultural richness of the area, surrounded by historical and cultural landmarks that blend leisure, nature, and culture seamlessly.
https://listingturkey.com/property/the-ka-housing/
500 acres of brilliance await you here at Riverview City which offers modern living, effortless convenience, and a beautiful natural setting. It is a mega township by Magarpatta City in Loni Kalbhor, Pune. Enjoy easy access to work, schools, and fun while experiencing a perfect work-life balance.
Visit - magarpattacity.developerprojects.in
Omaxe Sports City Dwarka stands out as a premier residential and recreational destination, offering a blend of luxury and sports-centric living. Located in the thriving area of Dwarka, this project by Omaxe Limited is designed to cater to modern lifestyle needs while promoting a healthy, active living environment.
Rams Garden Bahcelievler - Istanbul - ListingTurkeyListing Turkey
Implemented by Rams Global in Bahcelievler, the Rams Garden Bahcelievler Apartments includes 796 residences of different types from 2+1 to 5+1.
Next to the project, which will have 33 thousand square meters of green area, there will be 42 thousand 300 square meters of woodland. There will also be a 210-meter-long pond in the landscape of the project. There are 94.5 square meters of green space per flat.
Rams Garden Bahcelievler Apartments, which has 8 times more green space than the average of Istanbul with its 33 thousand square meters of green area located within a total of 75 thousand square meters, offers various housing options from 2+1 to 5+1.RAMS Garden has brought a lifeline to the construction industry.
Rams Global, which has signed projects in many places from Dubai to Phuket and delivered more than 20 thousand residences, is now starting new projects in Istanbul.
Rams Garden Bahcelievler is located 9 minutes from Metroport AVM, 5 minutes from Marmara Forum AVM, 12 minutes from Kazlıçeşme beach, 9 minutes from Yıldız Technical University, 7 minutes from Istinye University, 9 minutes from Ramada Hotel and Medicana Hospital.
https://listingturkey.com/property/rams-garden-bahcelievler-apartments/
Presentation to Windust Meadows HOA Board of Directors June 4, 2024: Focus o...Joseph Lewis Aguirre
Presentation to Windust Meadows HOA Board of Directors June 4, 2024: Focus on Public Safety as Job #1, Engagement, Wealth of HOA, Branding, Communication, Culture, Civic Responsibility
Need MCA leads? No sweat! MCAs are great for small biz funding. Learn how to snag top-notch leads: businesses needing cash, with repayment ability, decision-makers, and accurate contacts. Use content, social ads, lead platforms, partnerships, and capture processes for quality leads.
https://www.leadgeneration.media/blog/b/streamline-your-mca-sales-process-with-pre-qualified-leads
Sense Levent Kagithane Catalog - Listing TurkeyListing Turkey
Sense Levent offers a luxurious living experience in the heart of Istanbul’s vibrant Levent district.
This cutting-edge development seamlessly integrates modern design with natural elements, featuring live evergreen plants maintained by an advanced irrigation system, ensuring lush greenery year-round.
The building’s elegant ceramic balconies are both stylish and durable, enhancing the overall aesthetic and functionality. Residents can enjoy the 700m Sky Lounge, which provides breathtaking views of Istanbul and a perfect space to relax and unwind.
Sense Levent promotes a healthy and active lifestyle with a full gym, swimming pool, sauna, and steam room, all available in the building. The interiors are crafted with high-quality materials, ensuring a luxurious and inviting living space.
Designed with young professionals in mind, Sense Levent features 1+1 and 2+1 units with smart floor plans and balconies. The project promises high investment returns, with an expected annual return of 6.5-7%, significantly above Istanbul’s average ROI.
Located in the rapidly growing and highly desirable Levent area, the development benefits from ongoing urban regeneration projects. Its prime location offers proximity to shopping malls, municipal buildings, universities, and public transportation, adding immense value to your investment.
Early investors can take advantage of discounted units during the construction phase, with an expected capital appreciation of +45% USD upon completion. Property Turkey provides comprehensive rental management services, ensuring a seamless and profitable investment experience.
Additionally, robust legal support and significant tax advantages are available through Property Turkey’s licensed Real Estate Investment Fund. Levent is a dynamic urban hub, ideal for young professionals with its numerous corporate headquarters and shopping malls.
Sense Levent is more than just a residence; it’s a place where dreams and opportunities come to life. Contact us today to secure your place in this exclusive development and experience the best of Istanbul living. Sense Levent: Sense the Opportunity. Live the Dream.
https://listingturkey.com/property/sense-levent/
2. 2
Regency Centers: The Leading National Shopping Center REIT
Unequaled Competitive Advantages Position Regency for Superior Growth
nn Largest shopping center REIT with
428 properties located in the nation's
most vibrant markets
nn Neighborhood and community
shopping centers primarily anchored
by highly productive grocers
nn Well located in highly affluent
and dense infill trade areas
positioned for growth
nn National platform of 21 local offices creates
unequaled boots-on-the-ground and local
expertise advantages
nn Intense asset management is the foundation of
Regency's ability to achieve Same Property NOI
growth at or near the top of the shopping center sector
nn Regency's in-process projects, pipeline and key
tenant and local relationships create value through
the development and redevelopment of premier
shopping centers
PREEMINENT NATIONAL PORTFOLIO
BEST-IN-CLASS PLATFORM
FOR VALUE CREATION
SUPERIOR TENANT & MERCHANDISING MIX
DISCIPLINED FINANCIAL
MANAGEMENT & BALANCE
SHEET STRENGTH
nn Focus on necessity, value, convenience, and
service-oriented retailers
nn Portfolio strength and tenant quality demonstrated
by resilience to store closures and leading Same
Property NOI performance
nn Well-capitalized and flexible balance sheet to
support growth
nn Positioned to achieve accretive investment
opportunities with superior cost of capital
nn Self-funding capital allocation strategy cost-effectively
funds new investments, while preserving balance sheet
strength and enhancing portfolio quality
Unequaled
Combination of
Strategic
Advantages
3. 3
Notes: Assumes dividends are reinvested.
1 year total returns are through 7/26/18. 5-year and 10-year total returns have been converted to compound annual growth rates.
Sector-Leading Performance
Regency Centers Consistently Outperforms the Sector
0%
2%
4%
6%
8%
10%
FTSE
Shopping
Center REITs
REGMSCI
US REIT
7.5%
4.7%
3.0%
8.2%
7.9%
2.6%
0.4%
-3.4%
2.8%
1-YEAR
MSCI
US REIT
REG FTSE
Shopping
Center REITs
5-YEAR
Annualized Return
MSCI
US REIT
REG FTSE
Shopping
Center REITs
10-YEAR
Annualized Return
4. 4
7.0%
CAGR
$2.4M
$2.6M
$2.8M
$3.0M
$3.2M
$3.4M
2018Ei
2017201620152014
$2.64
$2.87
$3.13
$3.41
$3.52
$1.75
$1.80
$1.85
$1.90
$1.95
$2.00
$2.05
$2.10
$2.15
$2.20
$2.25
2018Eii
2017201620152014
$1.88
$1.94
$2.00
$2.10
$2.22
4.0%
CAGR
Regency is well positioned to continue future cash flow and dividend
growth, supported by sustained NOI growth, accretive investments,
a favorable payout ratio, and a sector-leading balance sheet.
OPERATING FFO GROWTHiii
(PER SHARE)
DIVIDENDS
(PER SHARE)
Cash Flow and Dividend Growth
Sustainable Long-Term Growth
i. Mid point of 2018 Operating FFO Guidance
ii. Annualized Q1 and Q2 2018 dividend
iii. Operating Funds From Operations (Operating FFO): An additional performance measure used by Regency as the computation of NAREIT FFO includes certain non-comparable items that affect the Company's period-over-period performance.
Operating FFO excludes from NAREIT FFO: (i) transaction related income or expenses; (ii) impairments on land; (iii) gains or losses from the early extinguishment of debt; (iv) certain non-cash components of earnings derived from above and below
market rent amortization, straight-line rents, and amortization of mark-to-market of debt adjustments; and (v) other amounts as they occur. The Company provides a reconciliation of NAREIT FFO to Operating FFO.
5. 5
Retail Landscape
The Evolution Future of Retail Real Estate
Regency's neighborhood
community shopping centers,
conveniently located close to the
customer, are enhanced by our
Fresh Look® philosophy that focuses
on optimizing merchandising,
placemaking and connecting at our
shopping centers.
RELEVANT RETAILERS
Successful retailers understand the
importance of a physical location and being
close to the customer. These operators are
seeking well-located, well-conceived and well-
merchandised centers to enhance customer
experience and promote brand interaction.
Regency's superior merchandising
mix consists primarily of best-in-class
necessity, value and service-oriented
retailers that draw consumers and
drive foot traffic.
CONSUMER PREFERENCES
Consumer preferences have shifted toward
convenience, value and experiential offerings
located in shopping centers that allow
them to interact and connect with
brands and each other.
Regency's high-quality portfolio,
evidenced by ABR PSF among
the highest in the sector as well as
attractive demographics averaging
146,000 people and average
incomes of $120,000, is positioned
to thrive long term and sustain
NOI growth of 3%+.
Roosevelt Square
LOCATION QUALITY
Retail real estate is experiencing a
bifurcation between high and lower quality,
which continues to accelerate, where
lower quality shopping centers are more
substantially impacted by today's disruptors.
6. 6
Retail Landscape
Better Brands and Operators are Still Expanding
0 100 200 300 400 500 600
Costco Wholesale US
Christian Brothers Automotive
Cumberland Farms
El Pollo Loco
Texas Roadhouse
Ulta
Kroger
Casey's General Store
Checkers and Rally's Resturants
QuikTrip
Gander Outdoors
Love's Travel Stops Country Stores
Valvoline Instant Oil Change
Discount Tire
Panda Express
Racetrac Petroleum
Sprouts Farmers Markets
Target
Burger King US
Popeyes Louisiana Kitchen
Arby's
Dunkin Donuts
Family Dollar
Panera Bread
Circle-K
Dollar Tree
Chick-fil-A
Pokeworks
Publix
CVS
Lidl
Chipotle Mexican Grill
Blaze Grill
Altitude Trampoline Park
Taco Bell
Murphy Oil USA, Inc.
Starbucks US
Wawa
Five Below
Raising Cane's Chicken Fingers
Jersey Mike's
AutoZone
7-Eleven US
Orangetheory Fitness
ALDI
Amazing Lash Studio
O'Reilly Auto Parts
Burgerim
Club Pilates
Dollar General
This group of 50 retailers is expected to
open more than 3,100 stores in 2018.
Expected 2018 Store Openings
Creditntell as of 7/24/18
7. 7
Strategic Objectives
i. EBITDAre (EBITDA): NAREIT EBITDAre is a measure of REIT performance, which the NAREIT defines as net income, computed in accordance with GAAP, excluding (i) interest expense; (ii) income tax expense; (iii) depreciation and amortization; (iv) gains and losses
from sales of depreciable property; (v) and operating real estate impairments; and (vi) adjustments to reflect the Company’s share of unconsolidated partnerships and joint ventures. Operating EBITDAre excludes from NAREIT EBITDAre certain non-cash components of
earnings derived from above and below market rent amortization and straight-line rents. The Company provides a reconciliation of Net Income (Loss) to Operating EBITDAre.
Growing
Shareholder
Value
High-Level
Employee
Engagement
and GA
to Revenues
Under
Management
of Less
Than 5%
3%+ SP NOI
Growth Annually
$1B+
Development
Redevelopment
Starts and
Deliveries Over
the Next 5 Years
Target Debt to
EBITDArei
of low-5x
Best-In-Class
Business Practices
and Systems
HIGH-QUALITY PORTFOLIO
Average Annual NOI Growth of 3%+
High-quality portfolio of shopping centers with
enduring competitive advantage from desirable
trade areas and highly productive grocers
SECTOR-LEADING FORTRESS
BALANCE SHEET
Provides funding flexibility and cost advantages
STRONG BRAND AND CULTURE
Engage an exceptional team of professionals
and best-in-class business practices that are
recognized as industry-leading
BEST-IN-CLASS BUSINESS
PRACTICES AND SYSTEMS
Implement operating systems, including
Environmental, Social and Governance practices,
which are widely recognized as best in class
ASTUTE CAPITAL ALLOCATION
Deliver $1 billion+ of development and
redevelopment starts and deliveries over
the next 5 years at attractive returns and
fortify NOI growth by astute asset recycling
8. 8
Portfolio Overview
428
Properties
95.5%
Leasedi
59M SF
Total GLA
80%of properties
are grocery anchored
No more than 14%
of leases (by ABR) expiring
in a given year
~9,300
Total Tenants
Regency Top 10 Tenants
Top Tenants Total Base Rent $177M (20% of Total ABRii
)
0.0%
0.5%
1.0%
1.5%
2.0%
2.5%
3.0%
3.5%
9.0%
%ofABR
i. Same property portfolio
ii. Average base rent as of 06/30/2018
iii. Regency’s top 25 tenants. Credit rating source-Creditntell
Excellent
79%
Fair
10%
Good
3%
N/R
8%
Credit Quality of Top 25 Tenantsiii
Contributes to Resilience
of Regency’s Portfolio
EXCELLENT
(A/B)
GOOD
(C)
FAIR
(D)
NOT RATED
$21+ PSF
Average ABR
9. 9
Leading National Portfolio
Significant Presence in Top Markets with Strategic Advantages from National Breadth and Local Expertise
HIGH
QUALITY
PORTFOLIO
SEATTLE
MINNEAPOLIS
NASHVILLE
CHARLOTTE
BOSTON
NEW YORK
AUSTIN
PORTLAND
SAN FRANCISCO
BAY AREA
LOS ANGELES
DENVER
DALLAS
HOUSTON
SAN DIEGO
CHICAGO
CINCINNATI
ATLANTA
JACKSONVILLE
RALEIGH
TAMPA
SOUTHEAST
FLORIDA
WASHINGTON, DC
BALTIMORE
PHILADELPHIA
MID-ATLANTIC
FLORIDA
# of properties 102
% of NOI 21%
GLA 11,000
AHHI $83,000
POP 91,000
# of properties 51
% of NOI 9%
GLA 3,900
AHHI $127,000
POP 115,000
NORTHEAST
# of properties 38
% of NOI 12%
GLA 4,000
AHHI $132,000
POP 272,000
CALIFORNIA
# of properties 77
% of NOI 29%
GLA 9,600
AHHI $114,000
POP 144,000
TEXAS
# of properties 30
% of NOI 7%
GLA 3,300
AHHI $128,000
POP 101,000
428 PROPERTIES
21 REGIONAL OFFICES
i. Peers are BRX, DDR, FRT, KIM, ROIC, RPAI, and WRI
*Source: Evercore ISI Annual Demographic Update 3/13/18, Green Street Advisors, Strip Centers Sector Update 5/17/18
ATTRACTIVE OVERALL DEMOGRAPHICS*
Regency Peersi
Average trade area population 146,000 128,000
Average household income $120,000 $105,000
College educated 48% 41%
*Within 3-mile radius
TOP REGIONS/STATES
25% of NOI
10% - 25 % of NOI
5% - 10% of NOI
5% of NOI
TOP 5 MARKETS
% of NOI
San Francisco 12%
Miami 12%
Los Angeles 7%
Washington, DC 6%
New York 6%
10. 10
Premier centers are those with inherent characteristics that will position a center with long-term
competitive advantages, resulting in superior NOI growth, including strong trade areas that feature
buying power and spending growth surrounding a shopping center with a top competitive position.
Asset Quality DNAi
95% of our
shopping centers
are positioned
to thrive
Premier
Plus
21%
Quality
Core
20%
Non-Core 5%
Premier
54%
TRADE
AREA
SHOPPING
CENTER
Positioned
for
Sustainable
Growth
Density
Income Wealth
Buying Power Growth
Relative Supply
Competitive Position
GLA Quality
Access Visibility
Dominant Anchor
+ Merchandising Mix
EXCEPTIONAL
STRONG
ABOVE AVERAGE
Premier Asset Quality and Trade AreasHIGH
QUALITY
PORTFOLIO
i. Based upon Regency Centers proprietary quality model.
11. 11
100000
110000
120000
130000
140000
150000 146,000
50
53
56
59
62
65
68
66
REG PEERS REG PEERS
Population Density
$100,000
$105,000
$110,000
$115,000
$120,000
$120,000
20%
30%
40%
50% 48%
REG PEERS
REG PEERS
Average Household Income % Higher Educational Attainment
Green Street’s TAP Score
Superior Trade Areas and DemographicsHIGH
QUALITY
PORTFOLIO
Regency's shopping centers are located in stronger trade areas than its peers,
with demographics meaningfully above the peer average.
Source: Evercore ISI Annual Demographic Update 3/13/18, Green Street Advisors, Strip Centers Sector Update 5/17/18
12. 12
Note: Most recent reported sales for grocers reporting
*Prorata share of base rent from grocers as of 06/30/2018
$25M
$26M
$27M
$28M
$29M
$30M
$31M
$32M
$33M
20172016201520142013
$29M
$30M
$31M
$32M $32M
$33M
$0
$100
$200
$300
$400
$500
$600
$700
$800
Low Tier
5% Grocer Rent*
Mid Tier
10% Grocer Rent*
Top Tier
85% Grocer Rent*
$500
$700
$400
GROCERSALESPSF
0.0%
0.5%
1.0%
1.5%
2.0%
2.5%
3.0%
3.5%
4.0%
4.5%
1.8%
3.8%
Portfolio Avg. ~$650 PSF
(2.0% Occupancy Cost)
3.6%
OCCUPANCYCOSTS
REGENCY GROCER SALES GROCER SALES AND OCCUPANCY COSTS
Regency’s grocer sales average ~$650 PSF annually versus the national average of $400 PSF.
A testament to the locations, relevance of grocers, and enduring quality of our centers.
HIGH
QUALITY
PORTFOLIO
Highly Productive Grocers
Grocer Strength Health
GROCER SALES OCCUPANCY COST
13. 13
HIGH
QUALITY
PORTFOLIO
Superior Merchandising Mix
A Necessity, Service, Convenience, and Value Focus is Increasingly Critical in Today’s Retail
Landscape and Resistant to Store Rationalization from Disruptors, Including E-Commerce.
RESTAURANTS
SERVICE ORIENTED
(50% OF ABR)
nn Nearly 20% of tenant base is
restaurants
nn Both service-oriented retailers and
restaurants increase return visits and
foster longer dwell time
NECESSITY BASED
(25% OF ABR)
nn 20% of tenant base includes
best-in-class national, regional and
specialty grocers who are highly
adaptable and innovative, incorporating
“click and collect” and grocery delivery
to enhance customer convenience
nn Drivers of strong foot traffic that attract
high-quality side shop tenants
BEST-IN-CLASS RETAILERS
(20% OF ABR)
nn Off-price brands like TJ Maxx
and retailers with growing
service components such as
Best Buy, encourage frequent
and sustained in-person visits
AT-RISK RETAILERS
(5% OF ABR)
nn Low exposure to shrinking
brands and e-commerce
affected categories
nn In place platform to
re-merchandise closing
stores and create value
nn Only 35 store closures expected
from previously announced
closures and bankruptcies
during 2017/2018, representing
approximately 40 bps of ABR
14. 14
HIGH
QUALITY
PORTFOLIO
Track Record of Sustained Outperformance
Astutely Navigating Disruptors
Amidst store rationalization and bankruptcies, Regency’s asset quality and demographic profile
mitigate downtime while allowing for merchandising upgrades typically at accretive rents.
i. Company filings, Peers are FRT, WRI, RPAI, KIM, BRX, and DDR
ii. Green Street (5/17/18) Decent start, but staying grounded.
REGENCY PEERS
Anchor Occupancyi
Exposure to At-Risk Tenantsii
95%
96%
97%
98%
99%
100%
1Q'184Q'173Q'172Q'171Q'174Q'163Q'162Q'161Q'164Q'153Q'152Q'151Q'154Q'143Q'142Q'141Q'14
98.9%
98.2%
98.5%
98.9%
98.8%
98.8%
98.8%
98.4%
98.7% 98.7%
98.2%
98.3%
98.4%
98.1%
98.2%
98.6%
97.7%
97.5%
97.8%
97.9%
98.1%
98.2%
97.9%
97.9%
97.8%
97.6%
97.6%
96.7%
96.4%
96.3%
96.3%
96.8%
96.6%
96.3%
Significant store closures/BKs
• Fresh Easy
• Haggen
• Sports Authority
• Sports Chalet
• Golfsmith
• HHGregg
• Toys R US
• Office Depot/
Office Maxx
• The Fresh Market
• Sears/Kmart
• Gander Mountain
• Gordmans
ESTIMATED % OF ABR
0%
2%
4%
6%
8%
10%
12%
14%
16%
DDRRPAIKIMBRXWRIFRTREGROIC
3.9%
6.2%
8.5% 8.7%
11.2%
12.0%
15.2%
4.8%
15. 15
MERCHANDISING
We blend best-in-class local merchants with
top national retailers in a considerate, curated, and
calculated merchandising strategy.
Each retailer is hand-selected not only for what
they can bring to our centers, but for what our
centers can bring to their business.
PLACEMAKING
The perfect retail environment is a physical
reflection of what makes the surrounding areas unique,
while providing optimal walkability and access.
We source top local artists and designers to create a
pleasing, relaxing, and individualized setting ideal for
shopping, dining, and gathering.
CONNECTING
We’re people people.
We actively engage with local communities
through special events, charitable initiatives,
social media best practices, and anything else
that creates a unique touch-point between
our retailers and their shoppers.
HIGH
QUALITY
PORTFOLIO Philosophy
15
16. 16
nn Mark-to-market rent spreads
opportunity with 40 anchor lease
expirations over next 5 years
nn Anchor lease mark-to-market of 40%+
supports goal of 10% rent spreads
nn 1% rent spread = 12 bps same
property NOI growth
nn Current % leased = 95.5%
nn Current % commenced = 93.8%
nn Converting 20 bps of leased
occupancy to commenced
occupancy contributes 25 bps to
same property NOI growth
nn Improve annual
increases with
focused leasing
nn Current 1.3%
nn Target 1.5%
n $50-$100M
in annual
redevelopment
spend at 7%+
ROI contributes
50-100 bps to
same property
NOI growth
Significant Embedded Growth Opportunities
Multiple Levers to Drive Same Property NOI and NAV Growth
HIGH
QUALITY
PORTFOLIO
VALUE CREATION
OPPORTUNITIES
CONTRACTUAL
RENT STEPS
LOCAL MARKET
EXPERTISE
BEST-IN-CLASS
OPERATING PRACTICES
RENT PAYING
OCCUPANCY
LEASE MARK-
TO-MARKET
ROADMAP TO
SAME-PROPERTY
NOI GROWTH
17. 17
i. 2018 for peers is average mid-point of peer guidance. Peers are FRT, RPAI, KIM, WRI, BRX, ROIC, and DDR.
Irreplaceable portfolio of
well-located, high-quality
assets anchored by
best-in-class tenants driving
sector-leading NOI growth.
17
HIGH
QUALITY
PORTFOLIO
Track Record of Sustained
Out Performance
Same Property NOI Growth By Year
REGENCY PEERS
0%
1%
2%
3%
4%
5%
2018E (i)20172016201520142013
4.0%
4.0%
4.4%
3.5% 3.6%
2.75%
-3.25%
18. 18
Funding Capacity for $500M of
High-Quality Investments
Enhances Portfolio Quality Preserves
Strong Balance Sheet
Free
cash flow is the
foundation of
funding plan
Sale of lower quality/
lower growth assets
Disciplined Funding Strategy
PROPERTY
SALES
1% - 2%
of Assets
Annually
FREE
CASH FLOW
~$160M
Annually
DEVELOPMENT/
REDEVELOPMENT
Compelling Margins
ACQUISITIONS
Superior Growth
EQUITY
When priced
attractively
DEBT
Low-5x debt
to EBITDArei
target
Stock
Repurchases
when priced
attractively
Astute Capital Allocation
Self-funding Strategy Enhances Portfolio Quality
ASTUTE
CAPITAL
ALLOCATION
i. EBITDAre (EBITDA): NAREIT EBITDAre is a measure of REIT performance, which the NAREIT defines as net income, computed in accordance with GAAP, excluding (i) interest expense; (ii) income tax expense; (iii) depreciation and amortization; (iv) gains and losses
from sales of depreciable property; (v) and operating real estate impairments; and (vi) adjustments to reflect the Company’s share of unconsolidated partnerships and joint ventures. Operating EBITDAre excludes from NAREIT EBITDAre certain non-cash components of
earnings derived from above and below market rent amortization and straight-line rents. The Company provides a reconciliation of Net Income (Loss) to Operating EBITDAre.
19. 19
Disciplined Strategy
Leading to Significant Value Creationi
Premier
Shopping Centers
with Long-Term
Growth Potential
Focus on Dense
Infill and Affluent
Trade Areas with
Leading Grocers
Distinctive Design
and Key Attributes
of Retail Centers
Sourced by Local
Market Expertise
and Relationships
Densification
Opportunities –
Mixed-Use
Partnering with
Premier Operators
Discipline
Through
Internal Guidelines
(Commitments
2x EBITDAreii
)
Leverage Flexible
Capital Structure
i. Value Creation is the estimated incremental value at completion using underwritten NOI at stabilization valued at a market cap rate less estimated development costs. Commitment threshold of 2x EBITDAre at 6/30/2018 was $1.6B.
ii. EBITDAre (EBITDA): NAREIT EBITDAre is a measure of REIT performance, which the NAREIT defines as net income, computed in accordance with GAAP, excluding (i) interest expense; (ii) income tax expense; (iii) depreciation and amortization; (iv) gains and losses
from sales of depreciable property; (v) and operating real estate impairments; and (vi) adjustments to reflect the Company’s share of unconsolidated partnerships and joint ventures. Operating EBITDAre excludes from NAREIT EBITDAre certain non-cash components of
earnings derived from above and below market rent amortization and straight-line rents. The Company provides a reconciliation of Net Income (Loss) to Operating EBITDAre.
Astute Capital Allocation
Disciplined Investment
ASTUTE
CAPITAL
ALLOCATION
20. 20
i. Represents the ratio of Regency’s underwritten NOI at stabilization to total estimated net development costs, before any adjustments for expected JV partner buyouts.
ii. Value Creation is the estimated incremental value at completion using underwritten NOI at stabilization valued at a market cap rate less estimated development costs.
TOTAL PROJECT COST EST VALUE CREATION VALUE CREATION MARGIN
Historical Development and Redevelopment Starts
7.8% Average Return On Investmenti
$0
$50
$100
$150
$200
$250
$300
$350
$400
$450
201720162015201420132012
$170
$100
$110
$150
$60
$110
$120
$200
$240
$120
$220
$230
59% 57% 63% 51% 52%50%
MILLIONS
Total Estimated
Value Creation:
$650 Millionii
Astute Capital Allocation
Track Record of Value Creation
ASTUTE
CAPITAL
ALLOCATION
21. 21
Developments
Redevelopments
MARKET AT
SPRINGWOODS VILLAGE
Houston, TX
nn 167,000 SF
nn 91% leased
nn $13M/9.8% yield
nn $103K AHHI/61K pop.
nn Start Q1-2016
PINECREST PLACE
Miami, FL
nn 70,000 SF
nn 82% leased
nn $16M/7.5% yield
nn $133K AHHI/97K pop.
nn Start Q1-2017
THE FIELD AT
COMMONWEALTH
Metro D.C.
nn 169,000 SF
nn 85% leased
nn $44M/7.5% yield
nn $140K AHHI/85K pop.
nn Start Q1-2017
INDIGO SQUARE
Charleston, SC
nn 51,000 SF
nn 72% Leased
nn $17M/8.3% yield
nn $106K AHHI/44K pop.
nn Start Q4-2017
PACES FERRY PLAZA
Atlanta, GA
nn 82,000 SF
nn 97% leased
nn $15M/9.0% yield
nn $163K AHHI/62K pop.
nn Start Q1-2017
MIDTOWN EAST
Raleigh, NC
nn 174,000 SF
nn 77% Leased
nn $22M/8.0% yield
nn $89K AHHI/87K pop.
nn Start Q4-2017
THE VILLAGE
AT RIVERSTONE
Houston, TX
nn 167,000 SF
nn 88% leased
nn $31M/8.0% yield
nn $157K AHHI/65K pop.
nn Start Q4-2016
MELLODY FARM
Chicago, IL
nn 272,000 SF
nn 69% leased
nn $103M/6.8% yield
nn $131K AHHI/54K pop.
nn Start Q2-2017
BALLARD BLOCKS II
Seattle, WA
nn 114,000 SF
nn 57% Leased
nn $31M/6.3% yield
nn $117K AHHI/219K pop.
nn Start Q1-2018
Astute Capital Allocation
Select In-Process Development Redevelopment
ASTUTE
CAPITAL
ALLOCATION
22. 22
OVERVIEW
nn Strategically located off a highly trafficked
intersection and adjacent to Regency-owned
Holly Park shopping center
nn 174,000 SF development anchored by
best-in-class grocer Wegmans
MELLODY FARM
Chicago, IL
MIDTOWN EAST
Raleigh, NC
BALLARD BLOCKS II
Seattle, WA
OVERVIEW
nn Located in affluent Lake County, with
household income ranked in the top 2% of
counties in the United States
nn 272,000 SF development with strong anchor
lineup including Whole Foods, Nordstrom
Rack, REI, and HomeGoods
OVERVIEW
nn Located in the dense urban core of Seattle in a
dominant retail node
nn 114,000 SF development anchored by
specialty grocer PCC Community Markets
STATUS
nn 80% leased and committed
nn Total pro-rata project costs of $22M
yielding 8.0%
nn Stabilization projected for 2020
STATUS
nn 73% leased and committed
nn Total project costs of $103M yielding
a 6.8% return on capital
nn Stabilization projected for 2019
STATUS
nn 68% leased and committed
nn Total pro-rata project costs of $31M yielding
6.3% return on capital
nn Stabilization projected for 2020
Regency’s Disciplined Approach to
Development Grows Net Asset Value
ASTUTE
CAPITAL
ALLOCATION
23. 23
WESTWOOD COMPLEX
Bethesda, MD
OVERVIEW
nn Situated on 22 acres in one of the most affluent
areas in D.C. Metro area
nn 467,000 SF outdated center and ancillary
buildings anchored by highly productive
Giant supermarket
OPPORTUNITY
nn The dated shopping center on an underutilized
site provides an unparalleled redevelopment
opportunity
nn New zoning in place with current entitlement work
focused on maximizing value to result in a viable
mixed-use development approval
nn Will include new grocery-anchored retail,
complemented by a mix of additional uses
including multifamily and for sale residential,
planned in partnership with best-in-class
residential developers
THE ABBOT
Cambridge, MA
MARKET COMMON CLARENDON
Arlington, VA
OVERVIEW
nn Located in an extremely dense, highly educated
trade area with significant daytime populations
within close proximity to Harvard University
nn Three existing retail and office buildings
representing 41,000 SF
nn Working closely with the community and focused
on preservation of Harvard Square
OPPORTUNITY
nn Unique opportunity to unlock a densification
redevelopment which is currently undergoing
entitlement
nn Regency has made thoughtful modifications to
the redevelopment plans to allow for phased
construction
OVERVIEW
nn Well located, highly desirable real estate
positioned for future value creation
nn Only Whole Foods Market in the retail corridor
along with other national powerhouse retailers
including Apple, and thriving local concepts
OPPORTUNITY
nn Repurpose a former mid-20th century
department store building into a self-ecosystem
of office, retail and restaurants, located near the
entrance of the center
nn Additional activation through enhancement of
The Loop, an iconic area to include pop-up retail
and community areas
Regency’s National Platform is Positioned to Unlock
Meaningful Upside Through Future Redevelopment
ASTUTE
CAPITAL
ALLOCATION
Future Investment Over 5+ Years: $1B+ (Estimated Value Creation of $400Mi
)
i. Value Creation is the estimated incremental value at completion using underwritten NOI at stabilization valued at a market cap rate less estimated development costs.
24. 24
Commitment to Conservative Financial Ratios
Sector-leading Balance Sheet Affords Financial Flexibility
0x
1x
2x
3x
4x
5x
6x
7x
8x
9x
ROICBRXDDRKIMFRTREGWRIRPAI
5.6x
5.4x 5.4x
5.7x
6.7x 6.8x 6.9x
8.1x
Net Debt To EBITDArei
Capital structure
(% of total capitalization)
4.1x
Fixed Charge Coverage
BBB+
Rating From SP
Baa1
Rating From Moody’s
$1.25B
Line Of Credit
nn Well-laddered debt
maturity profile with
limited near-term
maturities
nn Substantial liquidity
and capacity with
$1.25 billion line of credit
nn Large unencumbered
asset pool and deep
lender relationships
nn SP 500 inclusion
enhances liquidity
5.6x
Net Debt to EBITDArei
SECTOR-LEADING
FORTRESS
BALANCE SHEET
8%
71%
8%
20%
$14.9 Billion
Total
Capitalization
1%
EQUITY
UNSECURED DEBT
SECURED DEBT
CREDIT FACILITIES
Source: Company filings as of 6/30/18 and Green Street Advisors as of 4/23/18 for peers.
i. EBITDAre (EBITDA): NAREIT EBITDAre is a measure of REIT performance, which the NAREIT defines as net income, computed in accordance with GAAP, excluding (i) interest expense; (ii) income tax expense; (iii) depreciation and amortization; (iv) gains and losses
from sales of depreciable property; (v) and operating real estate impairments; and (vi) adjustments to reflect the Company’s share of unconsolidated partnerships and joint ventures. Operating EBITDAre excludes from NAREIT EBITDAre certain non-cash components of
earnings derived from above and below market rent amortization and straight-line rents. The Company provides a reconciliation of Net Income (Loss) to Operating EBITDAre.
25. 25
Debt Maturity Profile ($mm)i
Target: 15% of total debt maturing annually
$119
$42
$316
$469
$651
$422
$292 $299
$377
$332
$586
$425
$44
$0
$100
$200
$300
$400
$500
$600
$700
$800
20472029-204620282027202620252024202320222021202020192018
UNSECURED DEBT CONSOLIDATED DEBT - SECURED UNCONSOLIDATED DEBT - SECURED
Only 12 REITS have
accessed 30-year
bond market
Well-Laddered Maturity Profile
SECTOR-LEADING
FORTRESS
BALANCE SHEET
i. Maturity profile as of 6/30/18.
Source: Company filings as of 6/30/18.
26. 26
nn Expands operating
platform by leveraging
partnership capital
nn Generates annual fee
income of ~$25 million
GRI OPERF CalSTRS USAA NYCRF Total
Number of
Properties
70 21 7 7 6 111
Total GLA
(in Millions)
9.1 2.8 0.7 0.7 1.2 14.5
Pro Rata NOI -
Trailing 4Q’s
(in Millions)
$68.4 $11.7 $3.3 $2.7 $5.2 $91.2
Regency’s Ownership 40% 20% - 30% 25% 20% 30%
Co-Investment
Partnerships
26
SECTOR-LEADING
FORTRESS
BALANCE SHEET
27. 27
We are our
people.
We perform
for our
investors.
We provide
exceptional
service to our
customers.
We do what
is right.
We work
together to
sustain
superior
results.
We add
value.
We are the
industry
leader.
We connect
to our
communities.
27
Our Values
STRONG
BRAND AND
CULTURE
28. 28
STRONG
BRAND AND
CULTURE
Leading Environmental, Social and Governance (ESG) Practices
Connecting to Our Stakeholders While Executing Our Strategy
0
10
20
30
40
50
60
70
80
66
61
73
REGENCY PEERS1
ALL REITS
Green Street Corporate Governance Scorei
i. Green Street Advisors; Peers are BRX, DDR, FRT, KIM, ROIC, RPAI, and WRI
ii. Institutional Shareholder Services. (ISS) as of 06-01-18.
Regency is committed to sustainability
through reduced energy consumption,
water use, greenhouse gas emissions
and waste.
nn Received GRESB Green Star accolade for
three consecutive years
nn First U.S. REIT to issue a Green Bond
nn Implementation of Regency Green Building
Standards applied to all development and
redevelopment projects
nn Continued energy efficiency implementation to
further reduce energy consumption
nn Expanded solar energy program offering solar
power at shopping centers
Regency is committed to maintaining a
strong culture that successfully attracts,
retains and engages talented people
who contribute to the communities
where we work and operate.
nn Dedicated to fair compensation,
fostering a dynamic and balanced work
environment, and providing employees
developmental opportunities
nn Commitment to providing award-winning
and best-in-class benefits
nn Committed to contributing to the betterment
of our communities through volunteer
involvement as well as monetary contributions,
which are matched by Regency
Regency maintains best-in-class
corporate governance practices to
promote long-term value creation
for our stakeholders, a strong culture
of business ethics and compliance,
and transparency in our reporting.
nn Received the highest ISS score of 1 (on a
scale of 1 to 5) versus the peer average of 5ii
nn Adopted majority voting
nn Adopted an executive compensation
clawback policy
nn Increased Board gender diversity to 27%
nn Independent directors represent 82%
nn Adopted a proxy access right for shareholders
ENVIRONMENTAL SOCIAL GOVERNANCE
29. 29
Martin E. “Hap” Stein, Jr.
Chairman and
Chief Executive Officer
Years of Experience
Regency 41 | Industry 41
Lisa Palmer
President and
Chief Financial Officer
Years of Experience
Regency 21 | Industry 21
Mac Chandler
Executive Vice President,
Investments
Years of Experience
Regency 18 | Industry 26
Jim Thompson
Executive Vice President,
Operations
Years of Experience
Regency 36 | Industry 36
Alan Roth
Managing Director
Years of Experience
Regency 20 | Industry 21
Mike Mas
Managing Director, Finance
Years of Experience
Regency 15 | Industry 15
Nick Wibbenmeyer
Managing Director
Years of Experience
Regency 13 | Industry 15
John Delatour
Managing Director
Years of Experience
Regency 21 | Industry 35
Craig Ramey
Managing Director
Years of Experience
Regency 20 | Industry 31
SEATTLE
MINNEAPOLIS
NASHVILLE
CHARLOTTE
BOSTON
NEW YORK
AUSTIN
PORTLAND
SAN FRANCISCO
BAY AREA
LOS ANGELES
DENVER
DALLAS
HOUSTON
SAN DIEGO
CHICAGO
CINCINNATI
ATLANTA
JACKSONVILLE
RALEIGH
TAMPA
SOUTHEAST
FLORIDA
WASHINGTON, DC
BALTIMORE
PHILADELPHIA
Experienced and Deep Management Team
STRONG
BRAND AND
CULTURE
30. 30
Forward-looking statements involve risks and uncertainties. Actual future performance, outcomes and results may differ materially
from those expressed in forward-looking statements. Please refer to the documents filed by Regency Centers Corporation with
the SEC, specifically the most recent reports on forms 10K and 10Q, which identify important risk factors which could cause actual
results to differ from those contained in the forward-looking statements.
This presentation references certain non-GAAP financial measures. More information regarding these non-GAAP financial measures
can be found in company documents filed with the SEC.
Safe Harbor and Non-GAAP Disclosures