Download to read offline


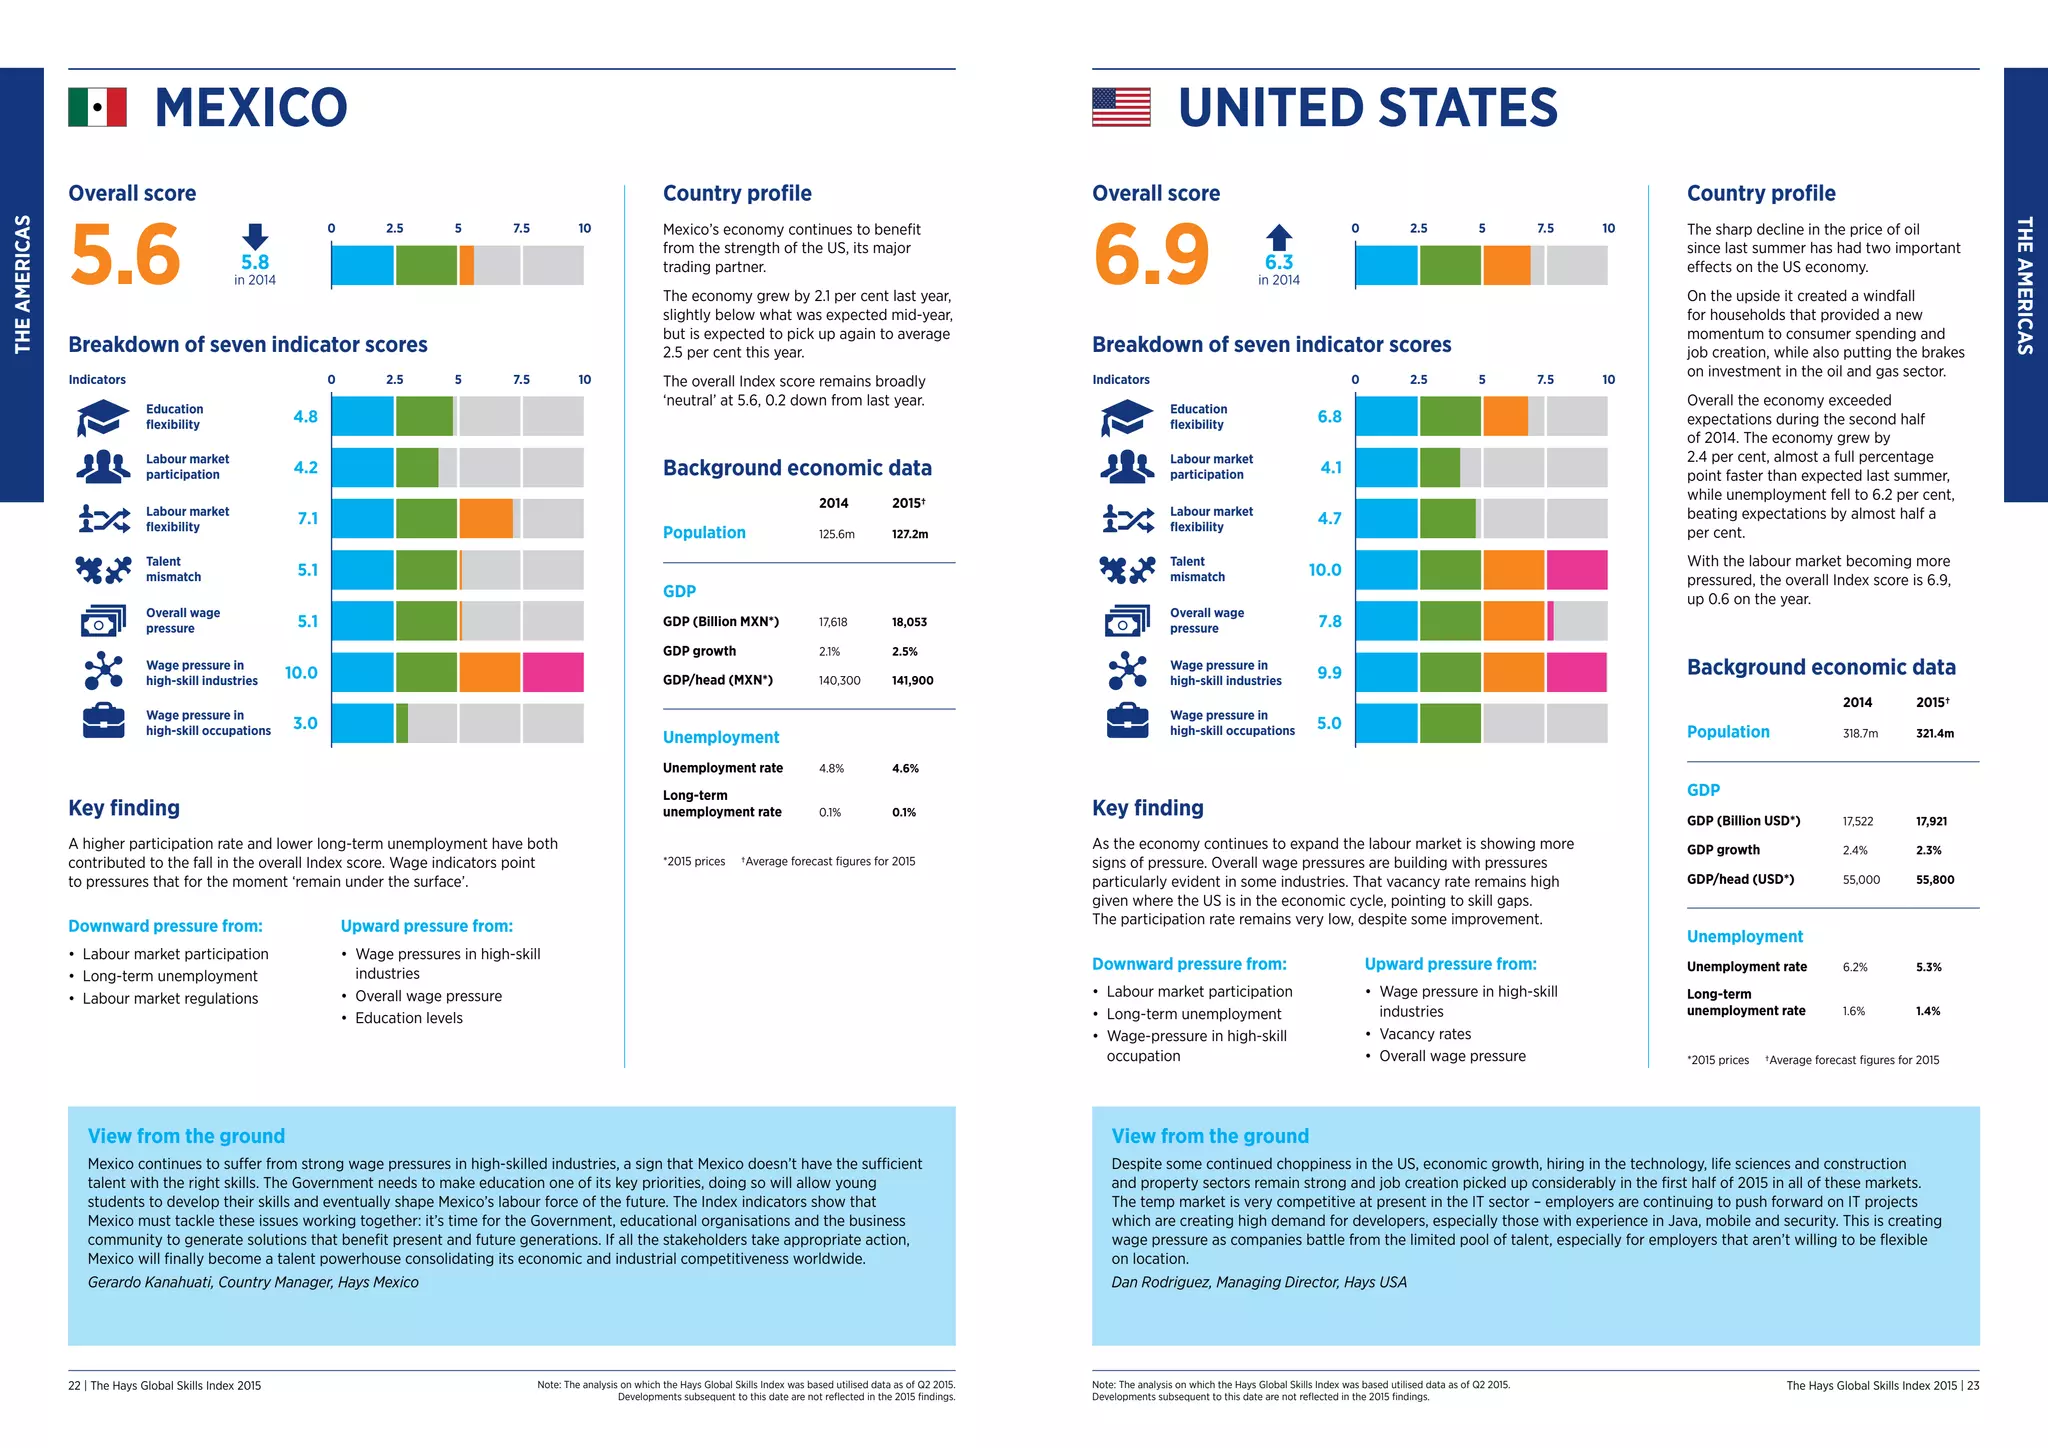
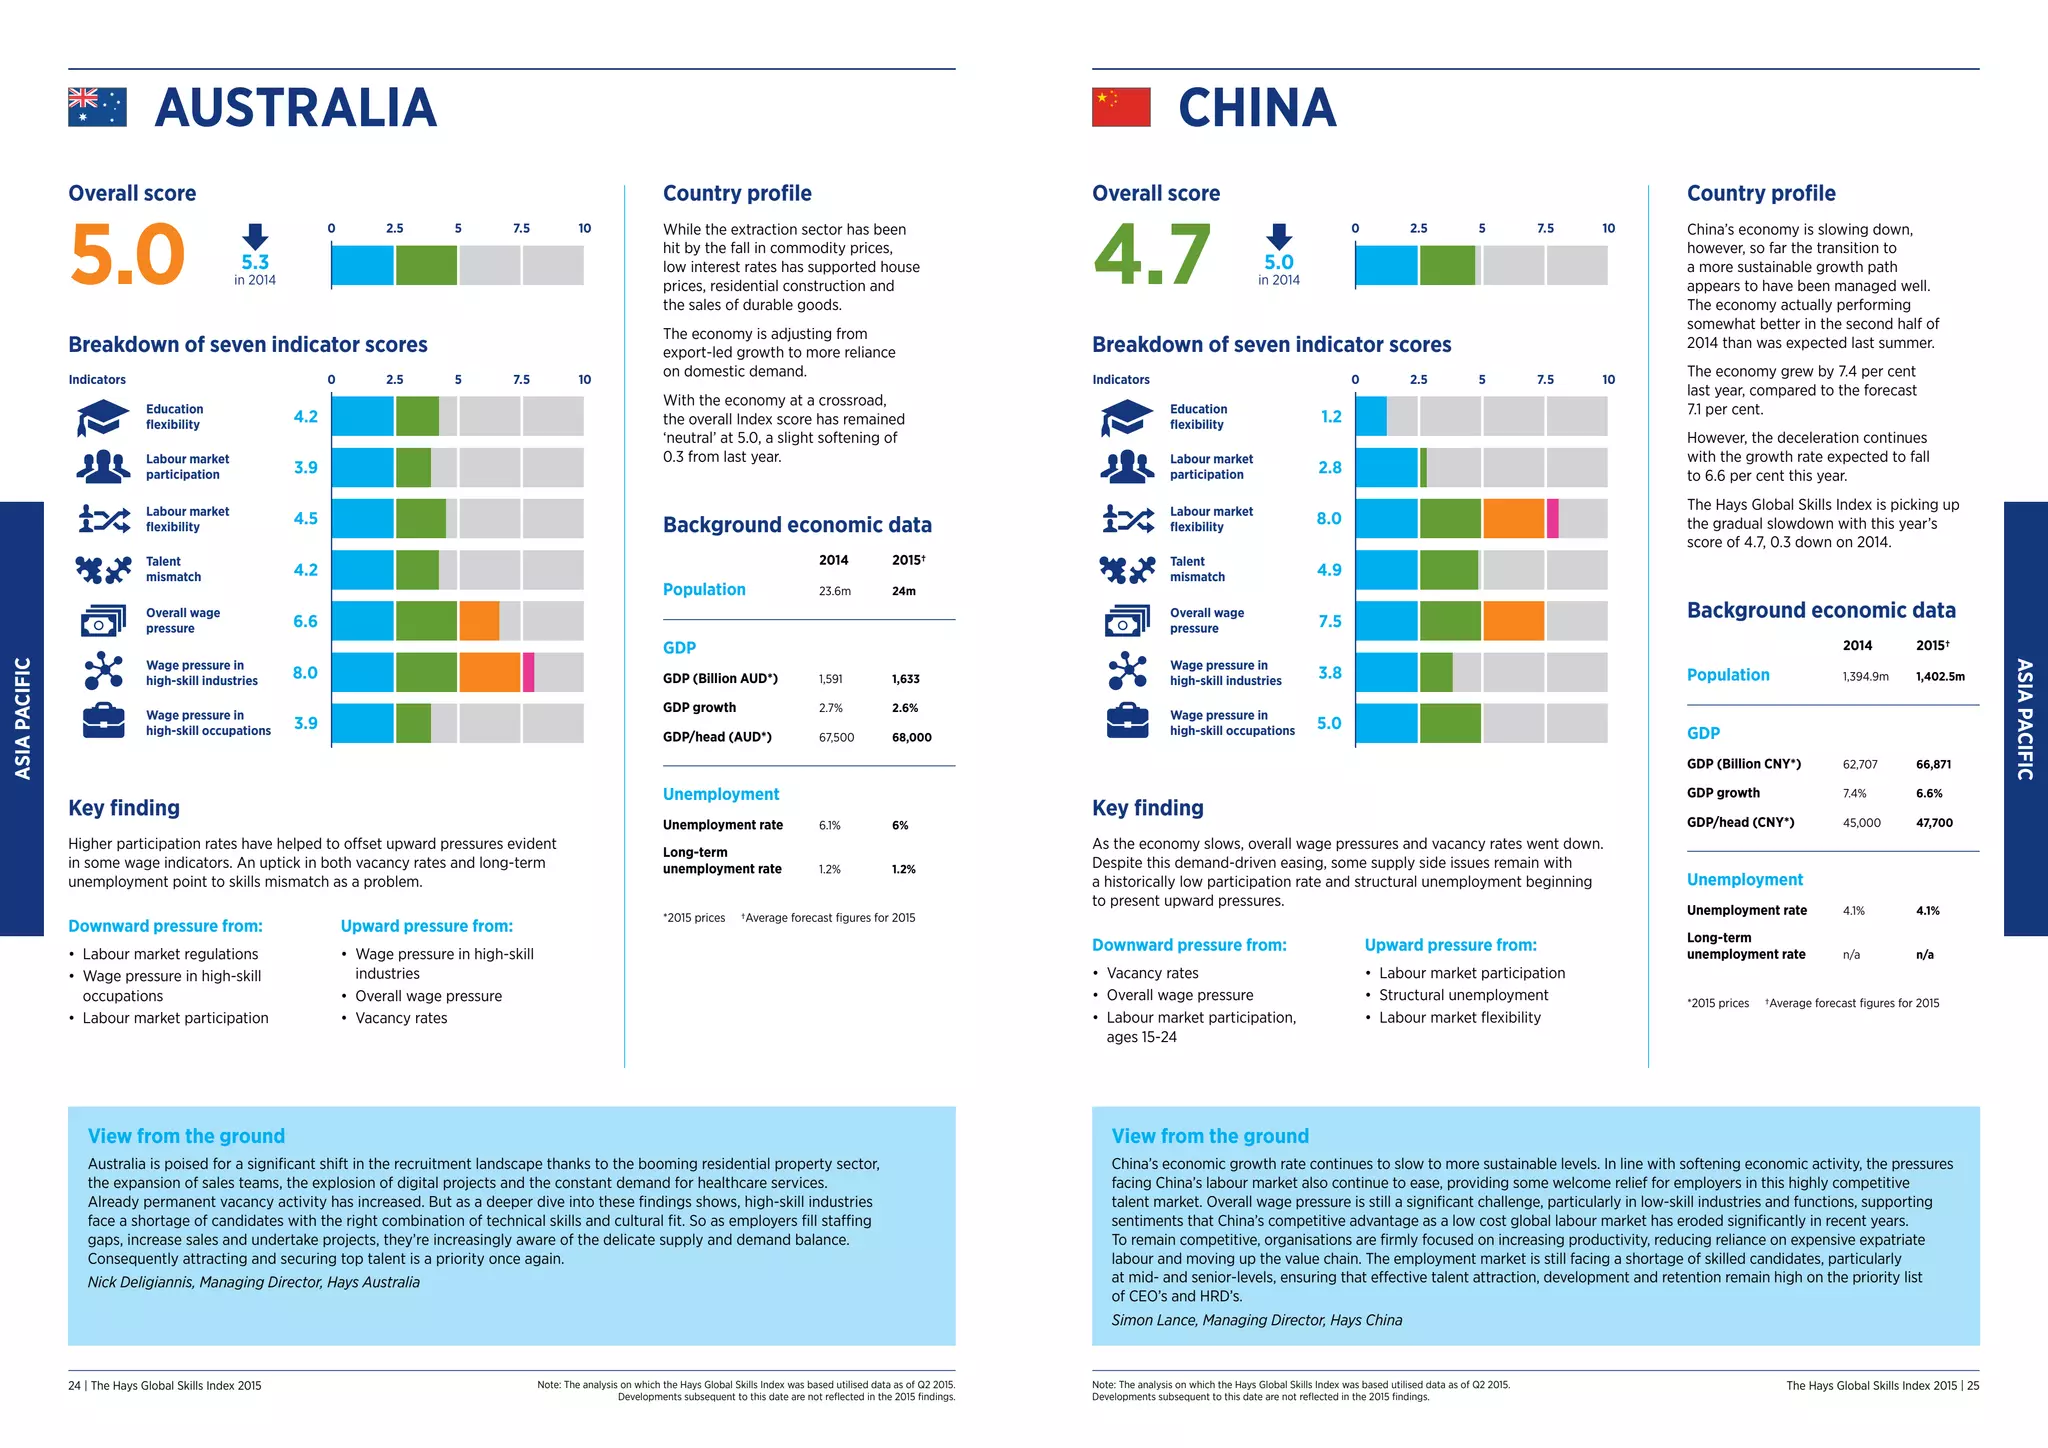
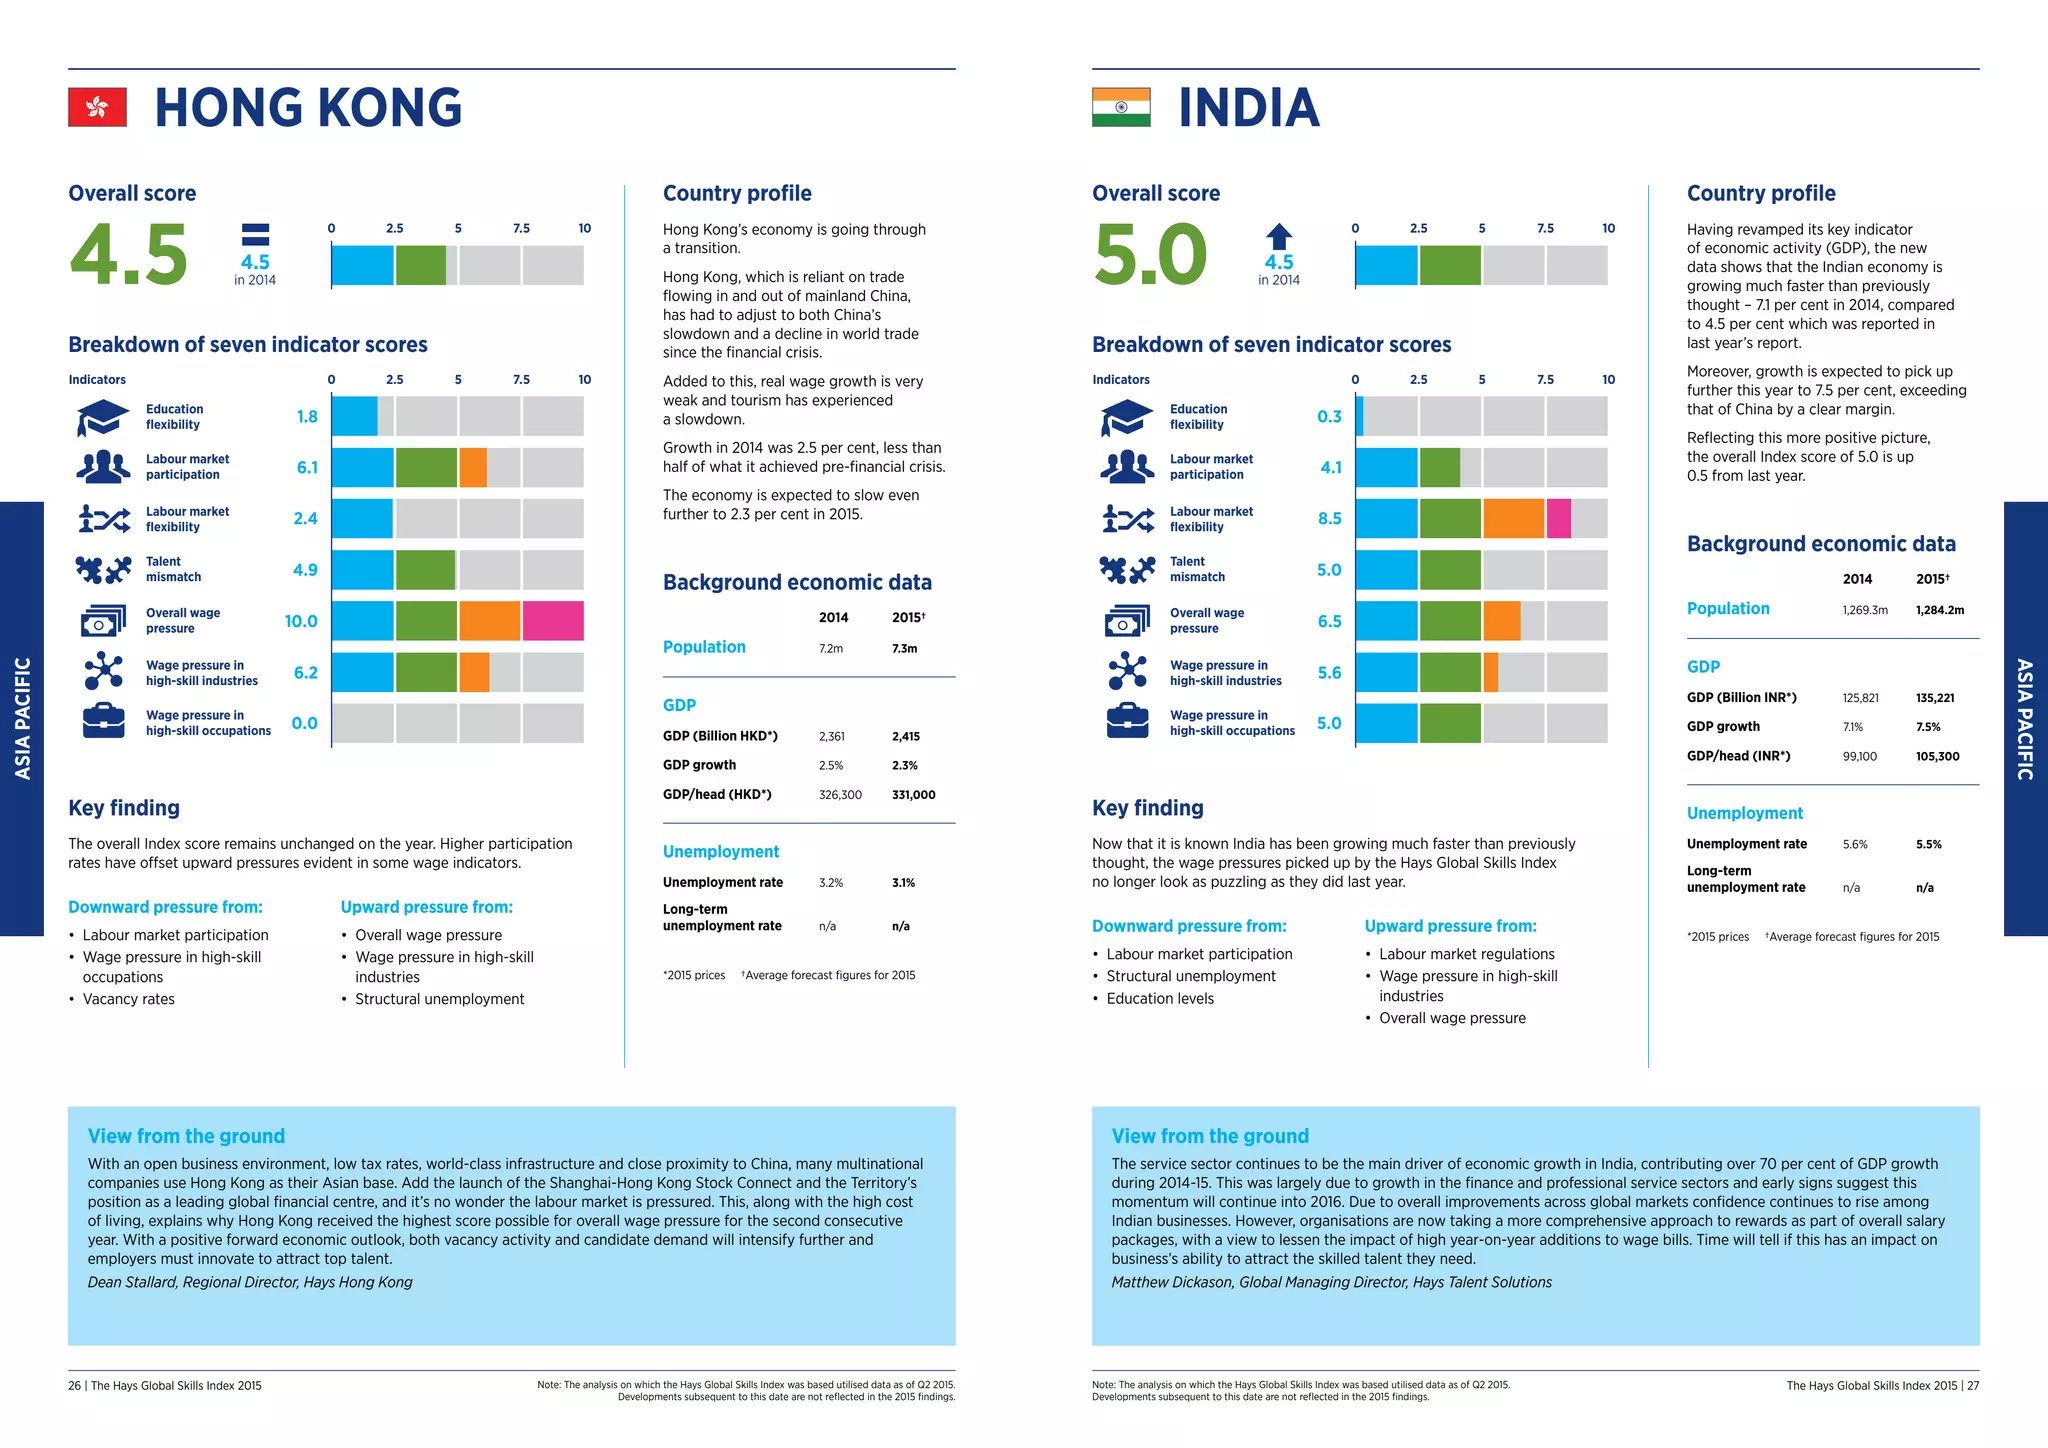


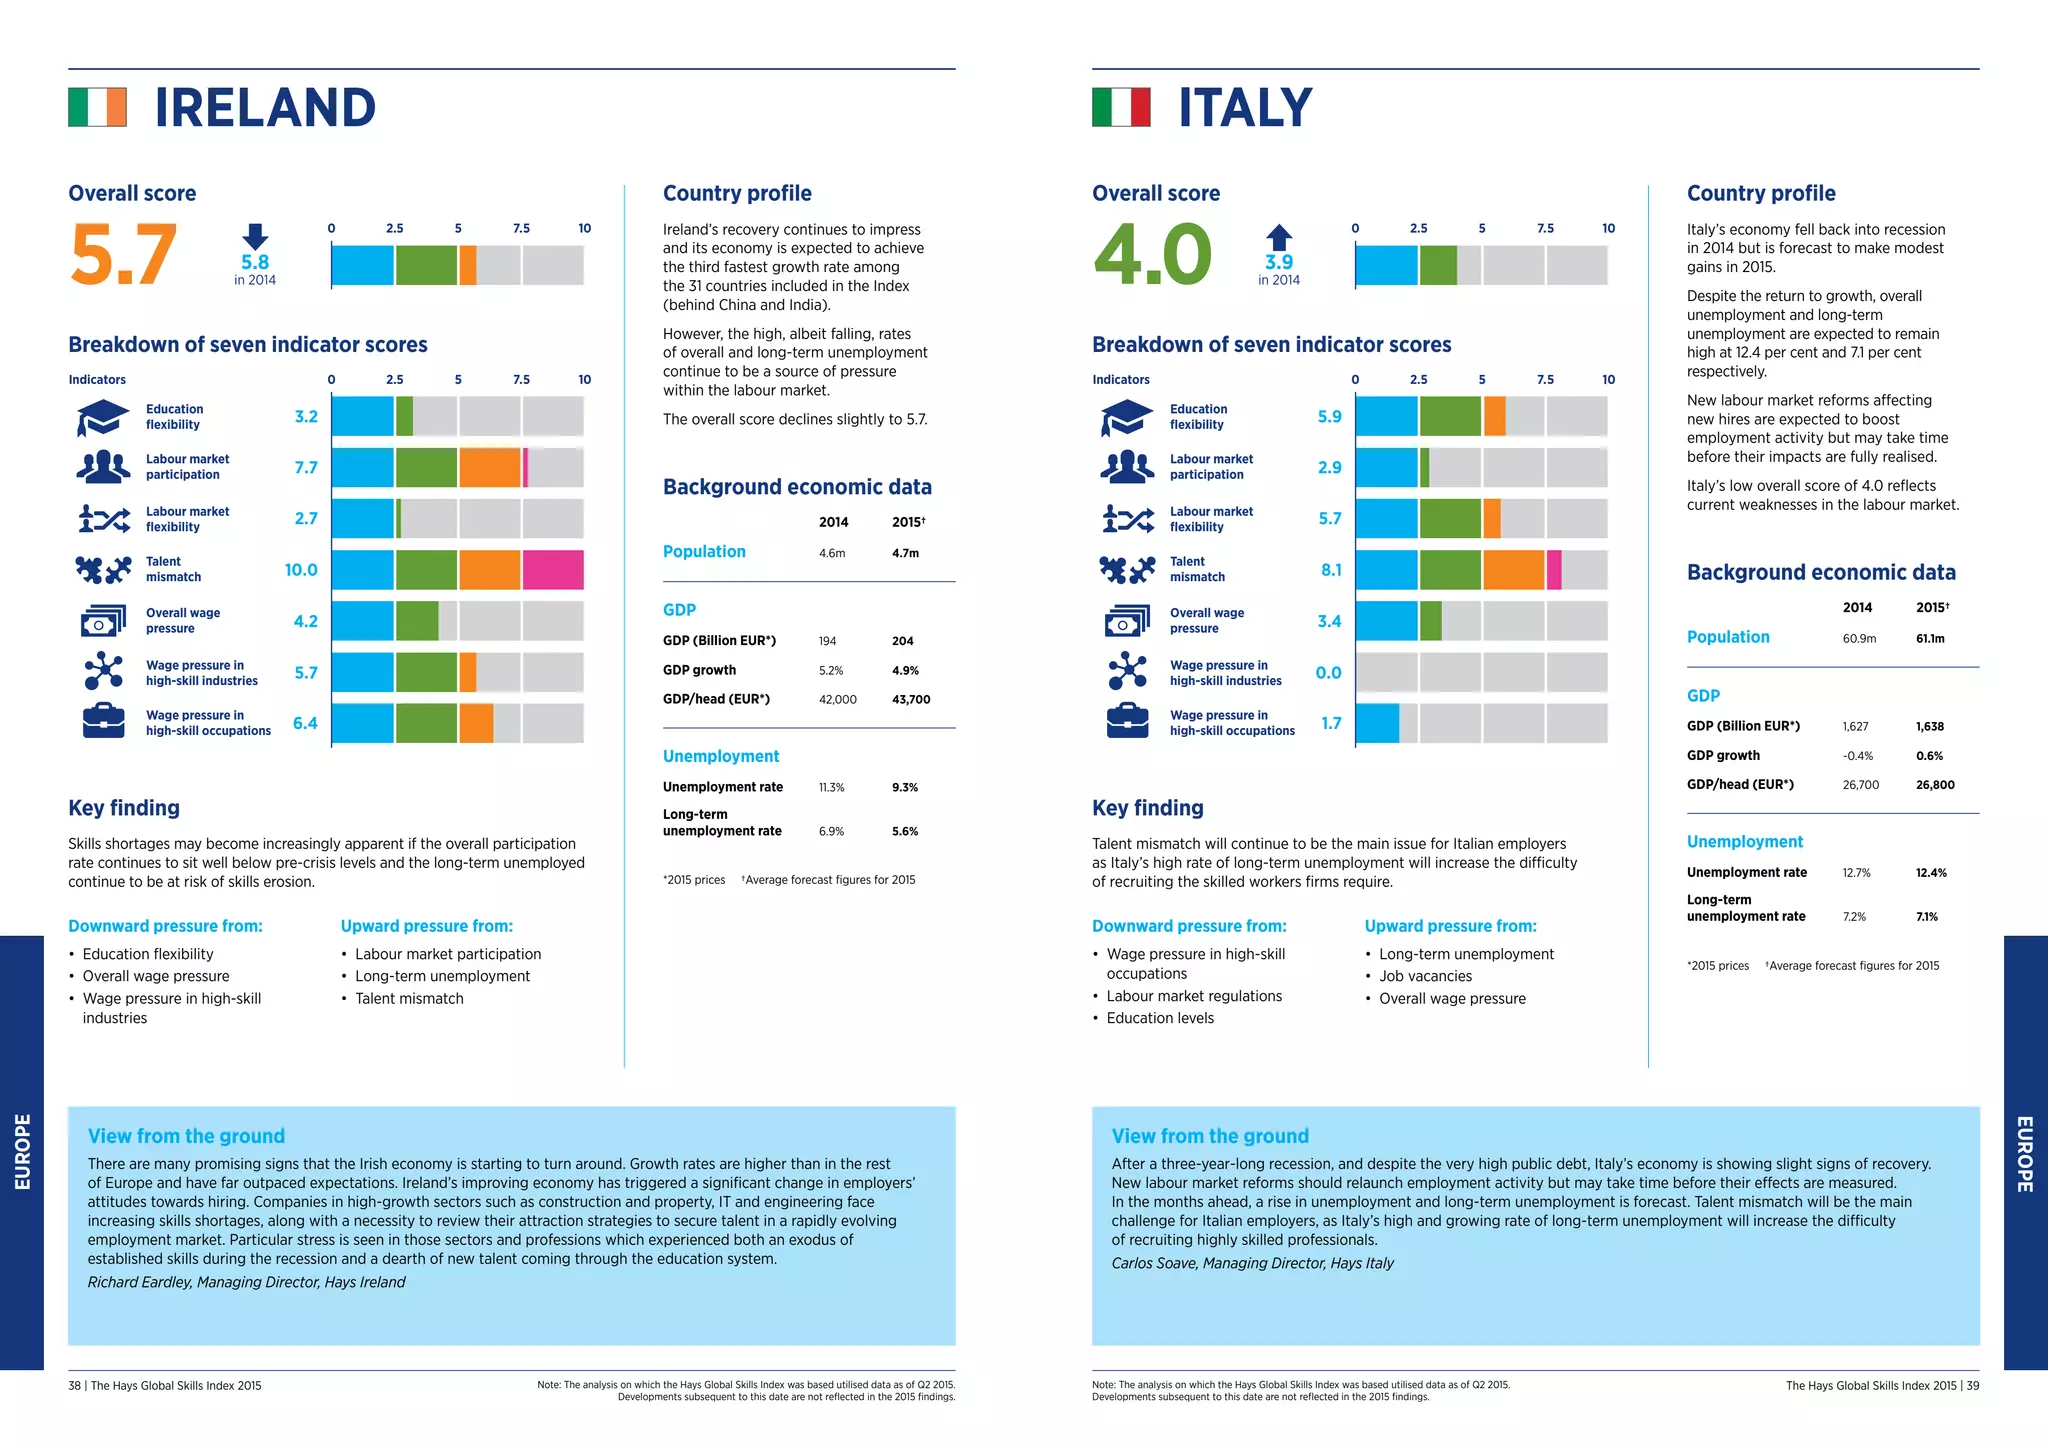
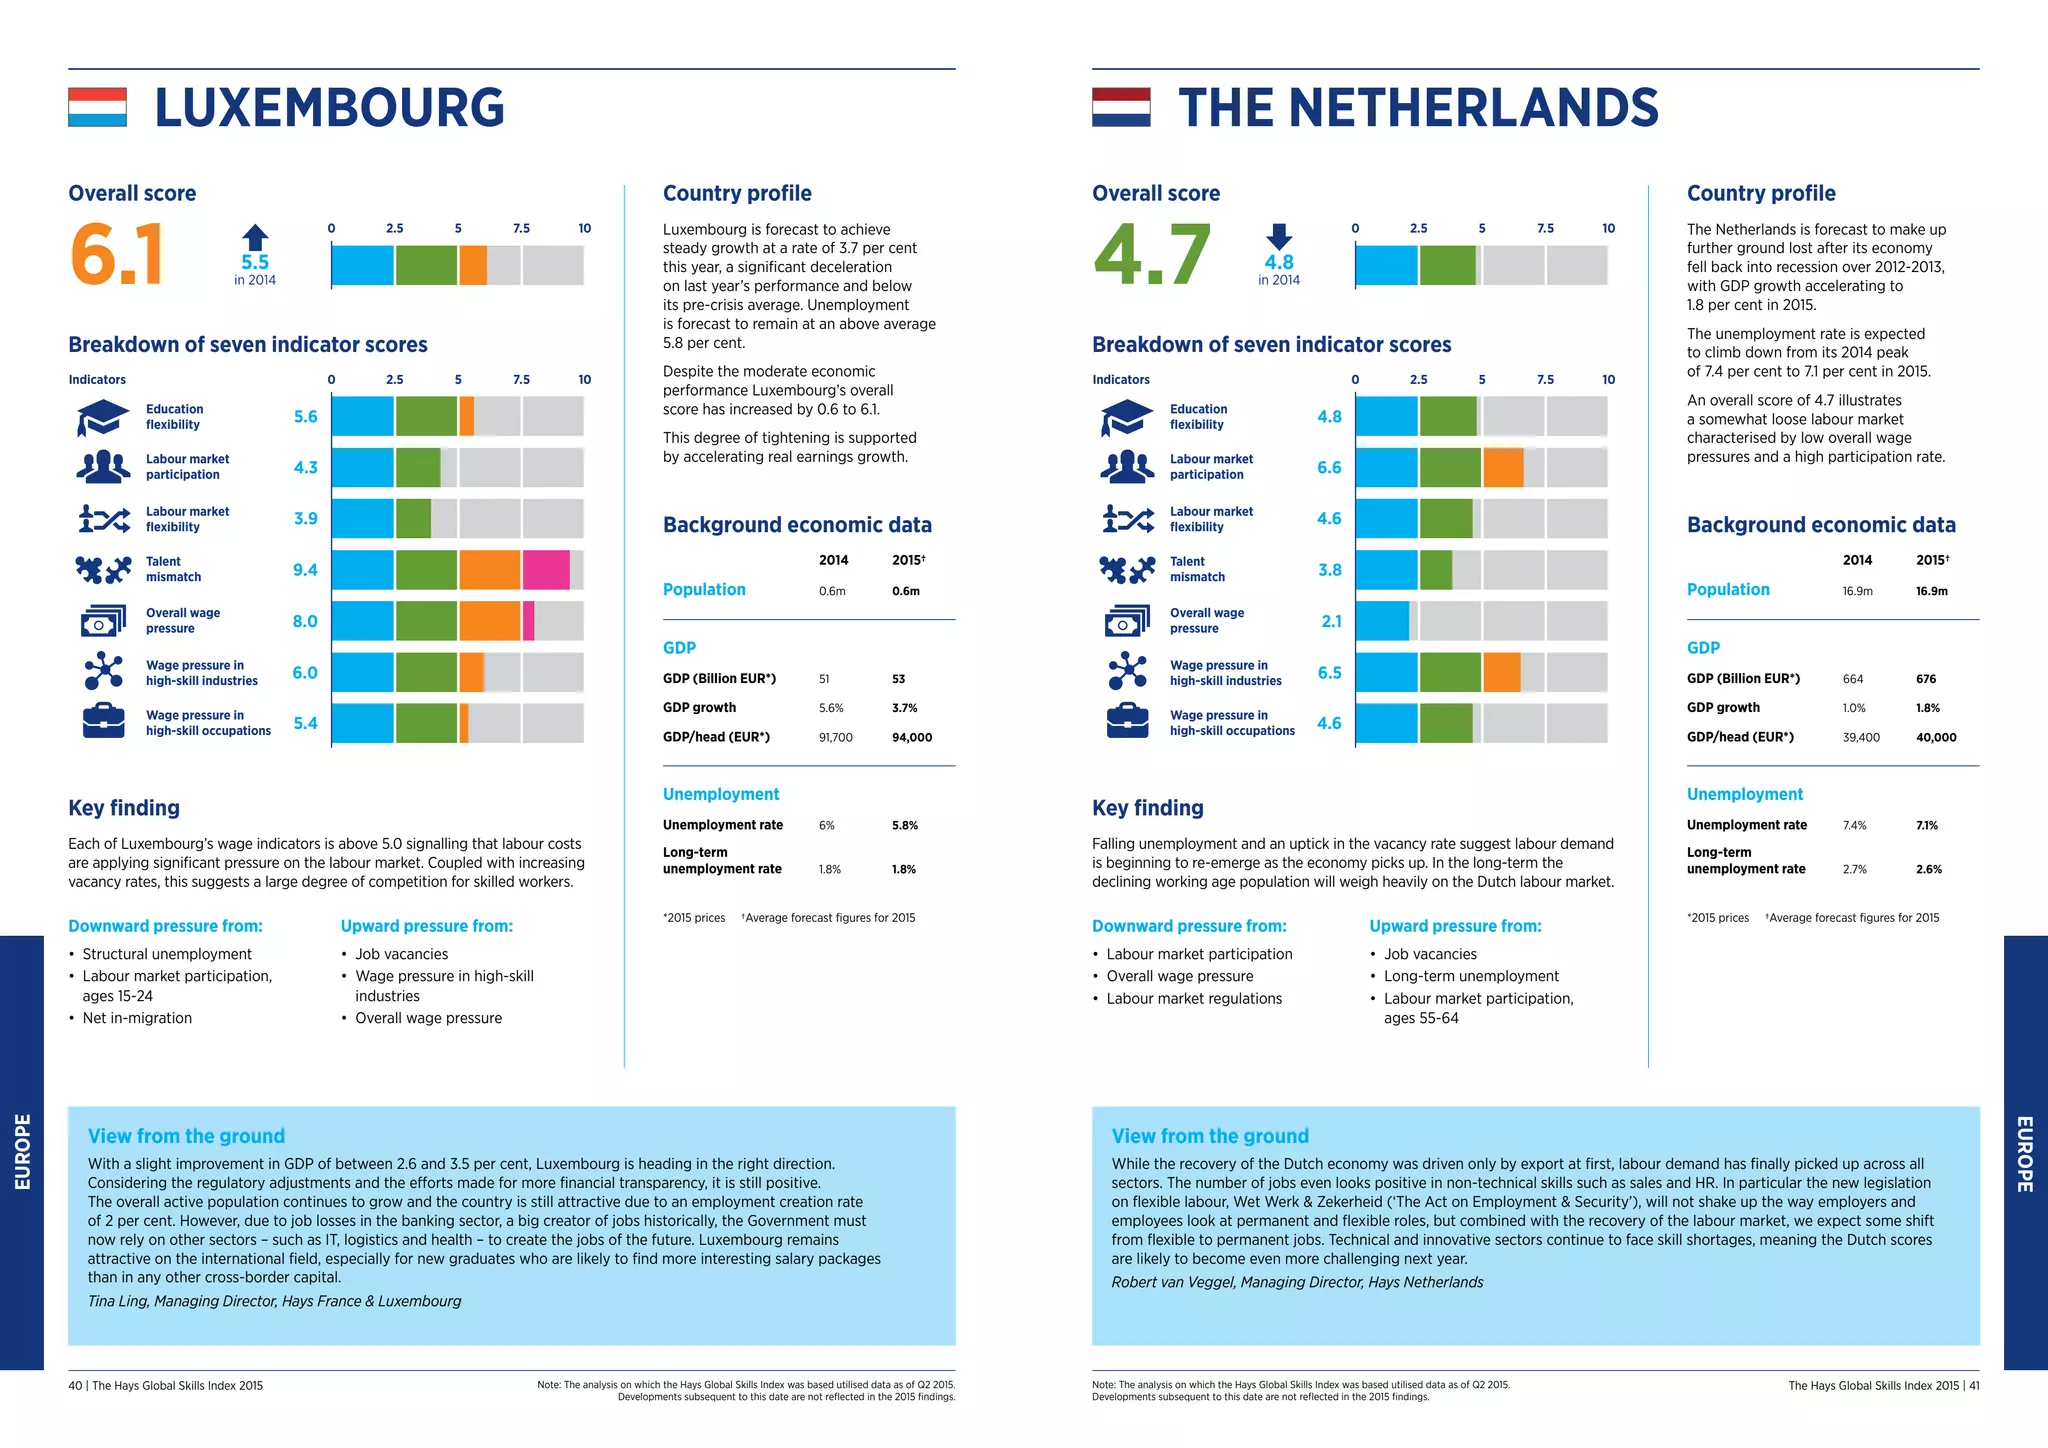


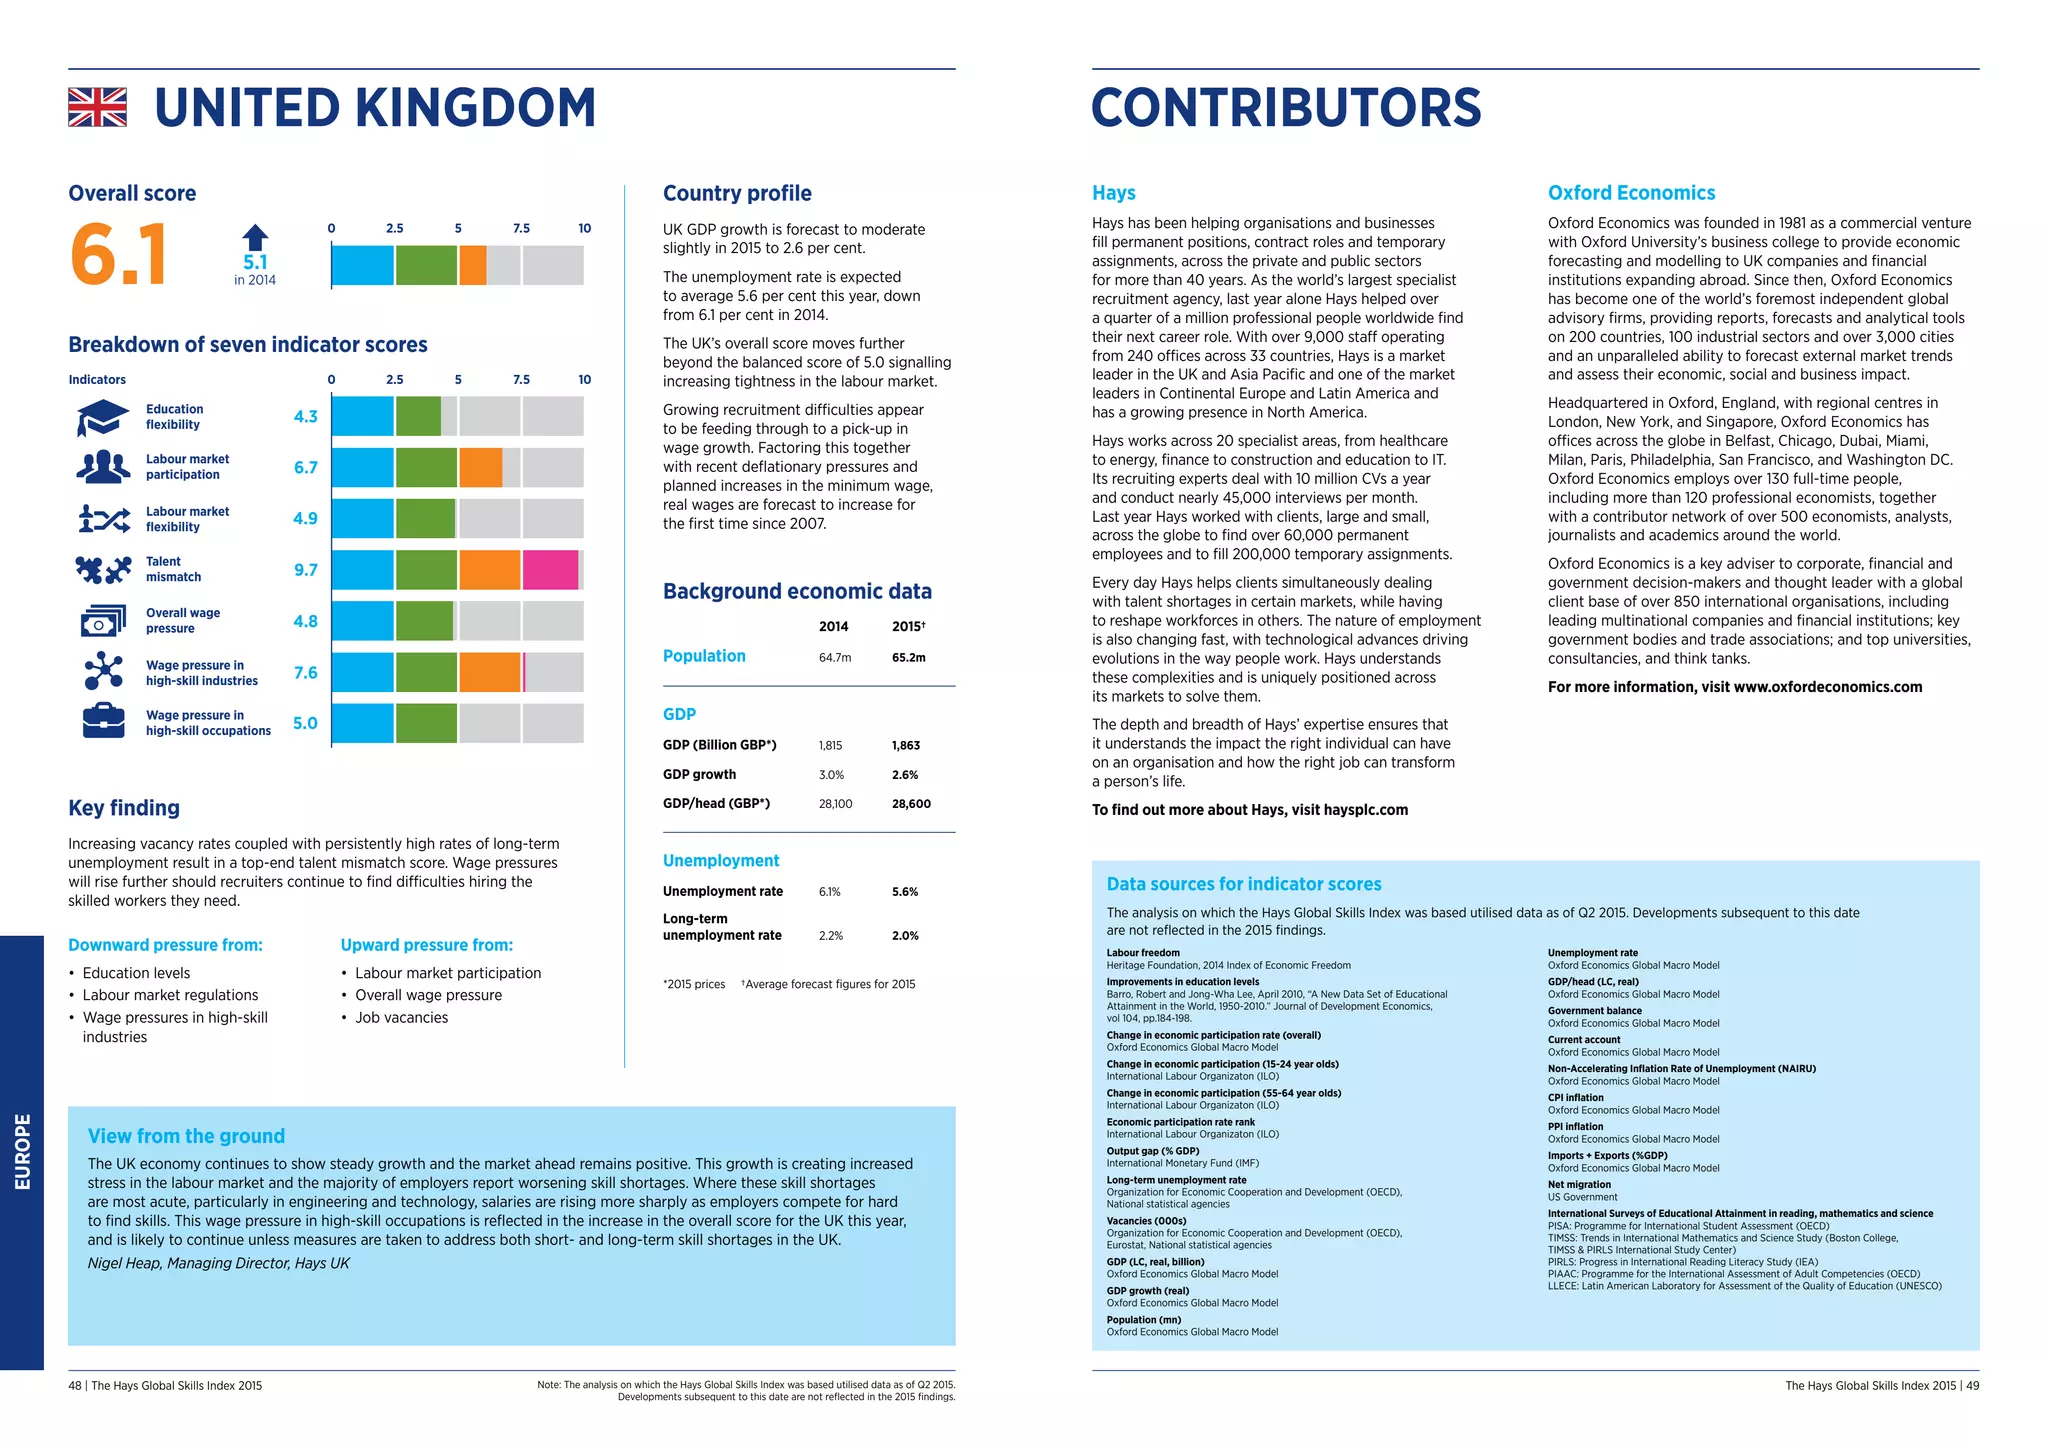

The Hays Global Skills Index 2015 highlights the ongoing global skills shortage as companies struggle to find qualified workers in a changing economic landscape. It examines labor market dynamics across 31 countries, addressing key issues such as education policy, wage pressure, and talent mismatch that affect employment and productivity. The report recommends enhancing skilled migration, improving training collaboration, and encouraging technology adoption to alleviate skills shortages and boost economic growth.


