Download to read offline


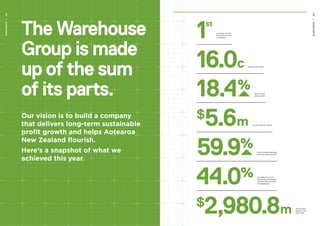


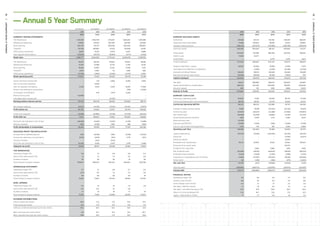
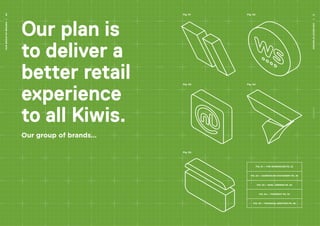


The document is an annual report from The Warehouse Group that summarizes the company's performance in FY17 and outlines plans for transformation. Key points: - FY17 adjusted net profit was $59.2 million, down 7.7% but above guidance. Group retail sales were $2,980.8 million, up 1.9% - The company has accelerated change programs including restructuring and selling parts of the business in response to a weaker first half of FY17 and increasing disruption - FY18 will see operational investment and costs to drive the company's transformation plan focusing on fixing retail fundamentals and investing in digital - The board has full confidence in the leadership team and transformation plan


