


![Powered by scrobblingscrobble: skrob·bul (ˈskrɒbəll)[verb] To automatically add the tracks you play to your Last.fm profile with a piece of software called a ScrobblerStats:Up to 800 scrobbles per secondMore than 40 million scrobbles per dayOver 40 billion scrobbles so farEach scrobble leads to a log line](https://image.slidesharecdn.com/hadoop-100629201436-phpapp01/85/Hadoop-at-Last-fm-5-320.jpg)


![Or go even more high-level with Hivehive> CREATE TABLE name_counts (gender STRING, name STRING, occurrences INT);hive> INSERT OVERWRITE TABLE name_countsSELECT lower(sex), lower(split(realname, ‘ ‘)[0]), count(1) FROM meta_user_infoWHERE lower(sex) <> ‘n’ GROUP BY lower(sex), lower(split(realname, ‘ ‘)[0]);hive> CREATE TABLE gender_likelihoods (name STRING, gender STRING, likelihood FLOAT);hive> INSERT OVERWRITE TABLE gender_likelihoodsSELECT b.name, b.gender, b.occurrences / a.occurrences FROM(SELECT name, sum(occurrences) as occurrences FROM name_counts GROUP BY name) a JOIN name_countsb ON (a.name = b.name);hive> SELECT * FROM gender_likelihoods WHERE (name = ‘klaas’) OR (name = ‘sam’);klaasm 0.99038464 klaasf 0.009615385samm 0.7578873samf 0.24211268](https://image.slidesharecdn.com/hadoop-100629201436-phpapp01/85/Hadoop-at-Last-fm-11-320.jpg)

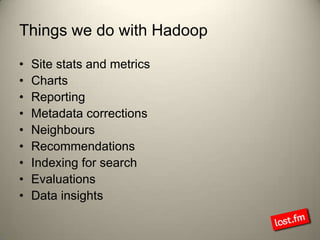
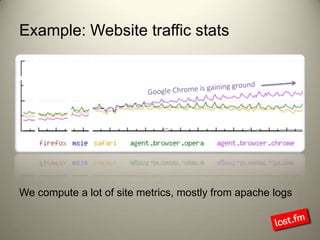
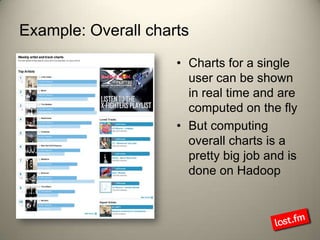


Last.fm, a music discovery website, utilizes Hadoop infrastructure to manage and process large volumes of user interaction data, generating over 40 billion scrobbles and millions of streaming hours monthly. Their system comprises 44 nodes with specific hardware and software configurations, employing various tools like Hive and Dumbo for data analysis and processing. Use cases include site statistics, recommendations, and real-time user metrics, highlighting the significance of Hadoop in handling extensive data operations.