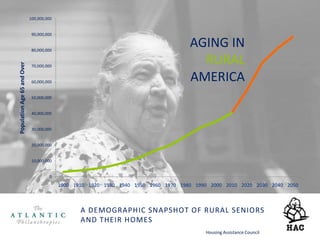
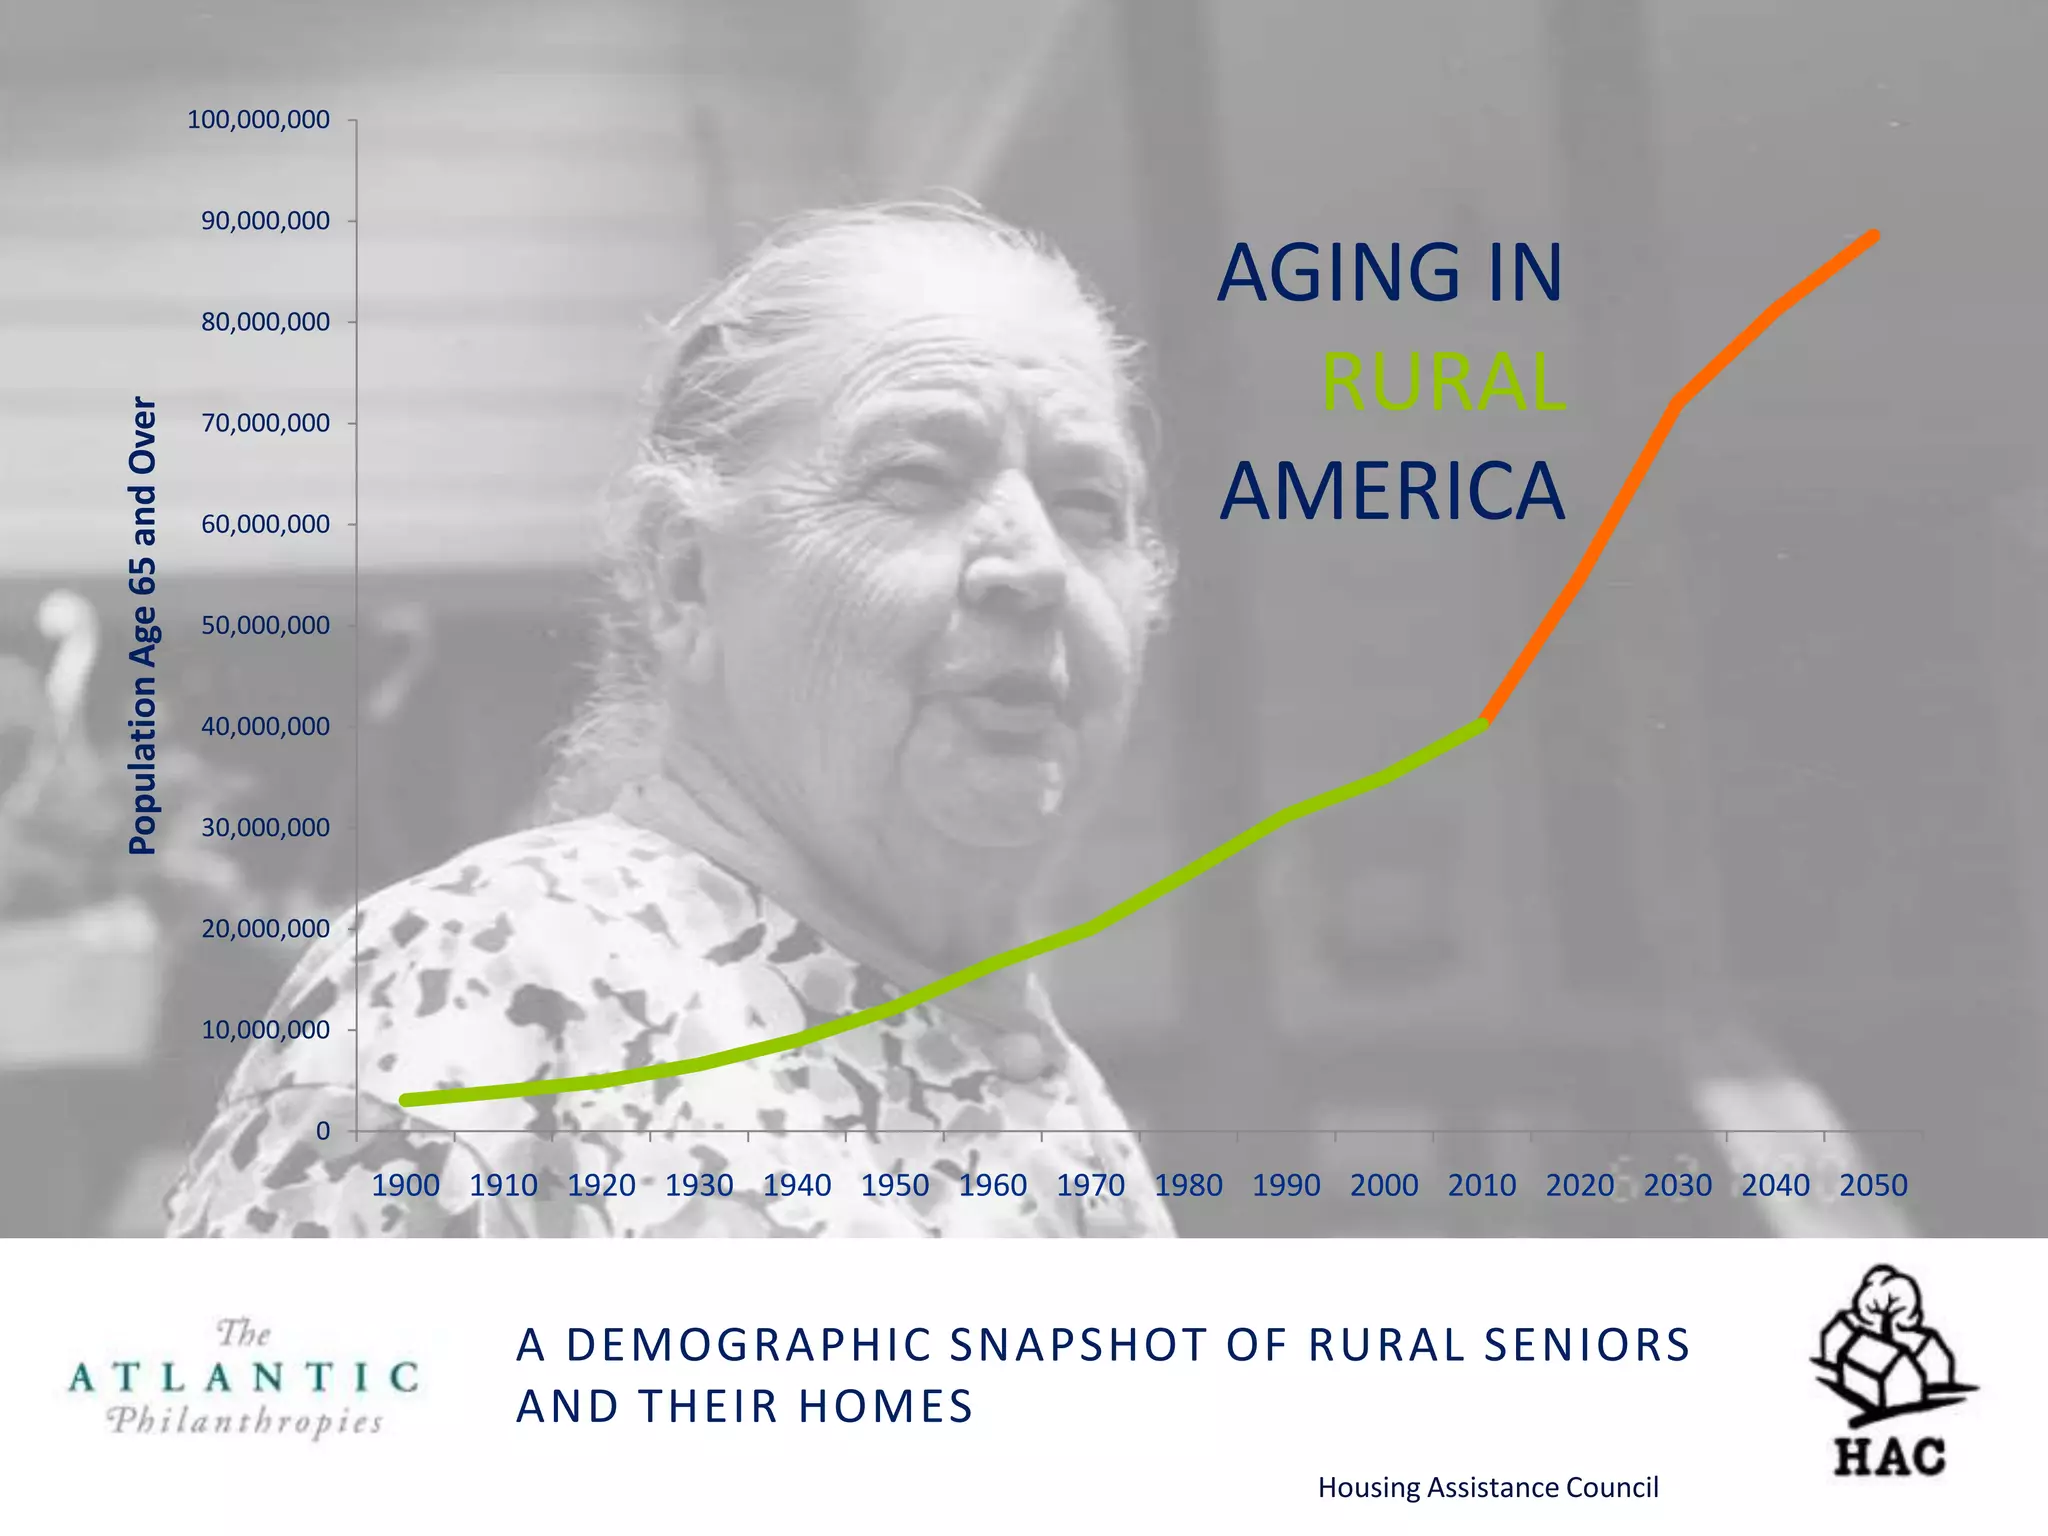
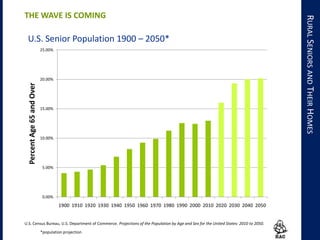
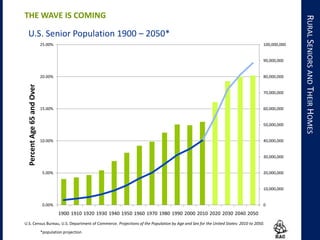
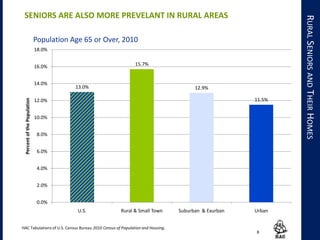
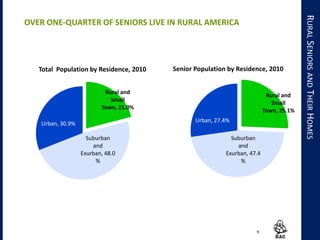
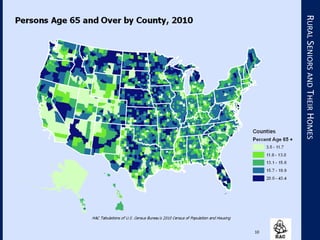
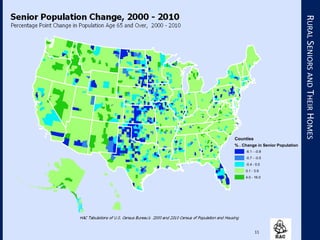
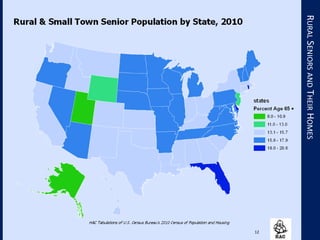
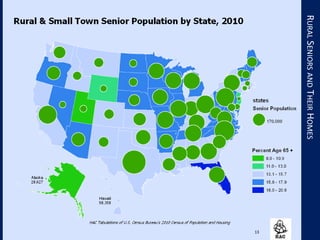
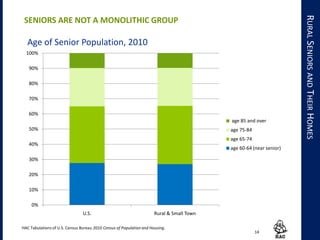
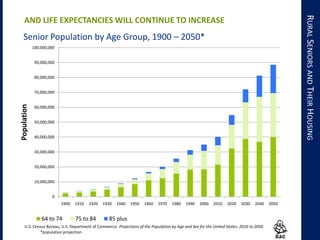
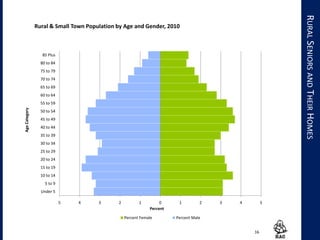
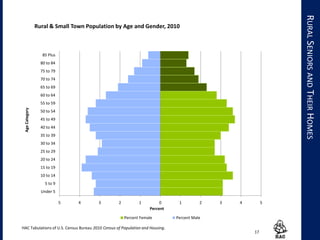
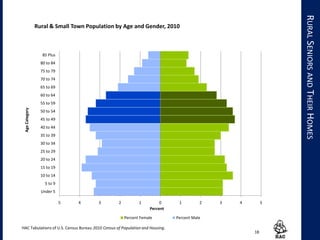
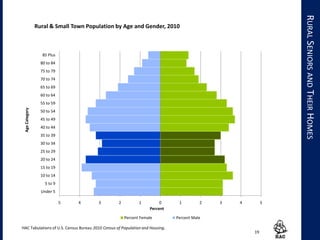
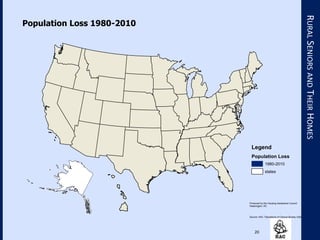
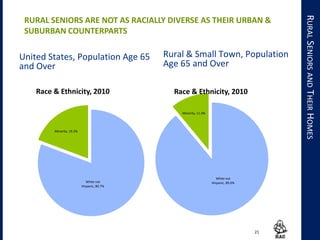
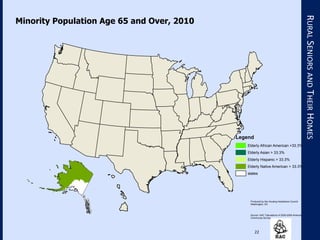
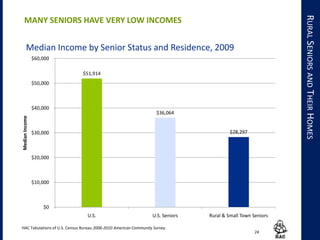
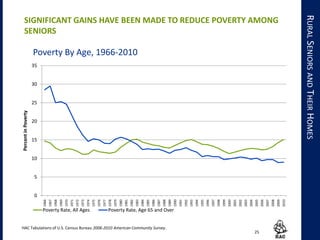
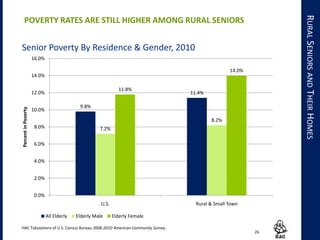
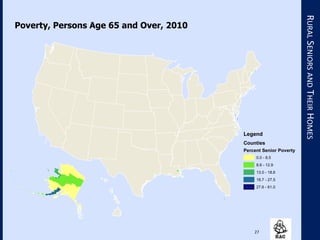
A DEMOGRAPHIC SNAPSHOT OF RURAL SENIORS
AND THEIR HOMES
Housing Assistance Council
AGING IN
RURAL
AMERICA
0
10,000,000
20,000,000
30,000,000
40,000,000
50,000,000
60,000,000
70,000,000
80,000,000
90,000,000
100,000,000
1900 1910 1920 1930 1940 1950 1960 1970 1980 1990 2000 2010 2020 2030 2040 2050
PopulationAge65andOver
RURALSENIORSANDTHEIRHOMES
0.00%
5.00%
10.00%
15.00%
20.00%
25.00%
1900 1910 1920 1930 1940 1950 1960 1970 1980 1990 2000 2010 2020 2030 2040 2050
PercentAge65andOver
U.S. Senior Population 1900 – 2050*
THE WAVE IS COMING
U.S. Census Bureau, U.S. Department of Commerce. Projections of the Population by Age and Sex for the United States: 2010 to 2050.
*population projection
RURALSENIORSANDTHEIRHOMES
0
10,000,000
20,000,000
30,000,000
40,000,000
50,000,000
60,000,000
70,000,000
80,000,000
90,000,000
100,000,000
0.00%
5.00%
10.00%
15.00%
20.00%
25.00%
1900 1910 1920 1930 1940 1950 1960 1970 1980 1990 2000 2010 2020 2030 2040 2050
PercentAge65andOverU.S. Senior Population 1900 – 2050*
THE WAVE IS COMING
U.S. Census Bureau, U.S. Department of Commerce. Projections of the Population by Age and Sex for the United States: 2010 to 2050.
*population projection
4
Rural & Small Town Tracts
RURALSENIORSANDTHEIRHOMES
THE DEMOGRAPHICS OF AGING IN RURAL AMERICA
37
40
35.5
36
36.5
37
37.5
38
38.5
39
39.5
40
40.5
U.S. Rural & Small Town
MedianAge
Median Age by Location, 2010
6
RURALSENIORSANDTHEIRHOMES
RURAL AMERICA IS OLDER THAN THE NATION AS A WHOLE
HAC Tabulations of U.S. Census Bureau 2010 Census of Population and Housing.
7
RURALSENIORSANDTHEIRHOMES
13.0%
15.7%
12.9%
11.5%
0.0%
2.0%
4.0%
6.0%
8.0%
10.0%
12.0%
14.0%
16.0%
18.0%
U.S. Rural & Small Town Suburban & Exurban Urban
PercentofthePopulation
Population Age 65 or Over, 2010
8
RURALSENIORSANDTHEIRHOMES
HAC Tabulations of U.S. Census Bureau 2010 Census of Population and Housing.
SENIORS ARE ALSO MORE PREVELANT IN RURAL AREAS
9
Rural and
Small
Town, 21.0%
Suburban
and
Exurban, 48.0
%
Urban, 30.9%
Total Population by Residence, 2010
Rural and
Small
Town, 25.1%
Suburban
and
Exurban, 47.4
%
Urban, 27.4%
Senior Population by Residence, 2010
RURALSENIORSANDTHEIRHOMES
OVER ONE-QUARTER OF SENIORS LIVE IN RURAL AMERICA
10
RURALSENIORSANDTHEIRHOMES
11
RURALSENIORSANDTHEIRHOMES
Counties
% . Change in Senior Population
-6.1 - -0.8
-0.7 - -0.5
-0.4 - 0.0
0.1 - 3.9
4.0 - 16.0
12
RURALSENIORSANDTHEIRHOMES
13
RURALSENIORSANDTHEIRHOMES
0%
10%
20%
30%
40%
50%
60%
70%
80%
90%
100%
U.S. Rural & Small Town
Age of Senior Population, 2010
age 85 and over
age 75-84
age 65-74
age 60-64 (near senior)
14
RURALSENIORSANDTHEIRHOMES
SENIORS ARE NOT A MONOLITHIC GROUP
HAC Tabulations of U.S. Census Bureau 2010 Census of Population and Housing.
RURALSENIORSANDTHEIRHOUSING
0
10,000,000
20,000,000
30,000,000
40,000,000
50,000,000
60,000,000
70,000,000
80,000,000
90,000,000
100,000,000
1900 1910 1920 1930 1940 1950 1960 1970 1980 1990 2000 2010 2020 2030 2040 2050
Population
Senior Population by Age Group, 1900 – 2050*
64 to 74 75 to 84 85 plus
AND LIFE EXPECTANCIES WILL CONTINUE TO INCREASE
U.S. Census Bureau, U.S. Department of Commerce. Projections of the Population by Age and Sex for the United States: 2010 to 2050.
*population projection
16
RURALSENIORSANDTHEIRHOMES
5 4 3 2 1 0 1 2 3 4 5
Under 5
5 to 9
10 to 14
15 to 19
20 to 24
25 to 29
30 to 34
35 to 39
40 to 44
45 to 49
50 to 54
55 to 59
60 to 64
65 to 69
70 to 74
75 to 79
80 to 84
85 Plus
Percent
AgeCategory Rural & Small Town Population by Age and Gender, 2010
Percent Female Percent Male
17
RURALSENIORSANDTHEIRHOMES
5 4 3 2 1 0 1 2 3 4 5
Under 5
5 to 9
10 to 14
15 to 19
20 to 24
25 to 29
30 to 34
35 to 39
40 to 44
45 to 49
50 to 54
55 to 59
60 to 64
65 to 69
70 to 74
75 to 79
80 to 84
85 Plus
Percent
AgeCategory Rural & Small Town Population by Age and Gender, 2010
Percent Female Percent Male
HAC Tabulations of U.S. Census Bureau 2010 Census of Population and Housing.
18
RURALSENIORSANDTHEIRHOMES
5 4 3 2 1 0 1 2 3 4 5
Under 5
5 to 9
10 to 14
15 to 19
20 to 24
25 to 29
30 to 34
35 to 39
40 to 44
45 to 49
50 to 54
55 to 59
60 to 64
65 to 69
70 to 74
75 to 79
80 to 84
85 Plus
Percent
AgeCategory Rural & Small Town Population by Age and Gender, 2010
Percent Female Percent Male
HAC Tabulations of U.S. Census Bureau 2010 Census of Population and Housing.
19
RURALSENIORSANDTHEIRHOMES
5 4 3 2 1 0 1 2 3 4 5
Under 5
5 to 9
10 to 14
15 to 19
20 to 24
25 to 29
30 to 34
35 to 39
40 to 44
45 to 49
50 to 54
55 to 59
60 to 64
65 to 69
70 to 74
75 to 79
80 to 84
85 Plus
Percent
AgeCategory Rural & Small Town Population by Age and Gender, 2010
Percent Female Percent Male
HAC Tabulations of U.S. Census Bureau 2010 Census of Population and Housing.
20
RURALSENIORSANDTHEIRHOMES
Produced by the Housing Assistance Council
Washington, DC
Source: HAC Tabulations of Census Bureau Data
Population Loss 1980-2010
Legend
Population Loss
1980-2010
states
United States, Population Age 65
and Over
White not
Hispanic, 80.7%
Minority, 19.3%
Race & Ethnicity, 2010
Rural & Small Town, Population
Age 65 and Over
White not
Hispanic, 89.0%
Minority, 11.0%
Race & Ethnicity, 2010
RACE&
ETHNICITY
21
RURALSENIORSANDTHEIRHOMES
RURAL SENIORS ARE NOT AS RACIALLY DIVERSE AS THEIR URBAN &
SUBURBAN COUNTERPARTS
22
RURALSENIORSANDTHEIRHOMES
Produced by the Housing Assistance Council
Washington, DC
Source: HAC Tabulations of 2005-2009 Ameican
Community Survey
Minority Population Age 65 and Over, 2010
Legend
Elderly African American >33.3%
Elderly Asian > 33.3%
Elderly Hispanic > 33.3%
Elderly Native American > 33.3%
states
SELECTED ECONOMIC CHARACTERISTICS
Photo courtesy of FAHE
$51,914
$36,064
$28,297
$0
$10,000
$20,000
$30,000
$40,000
$50,000
$60,000
U.S. U.S. Seniors Rural & Small Town Seniors
MedianIncome
Median Income by Senior Status and Residence, 2009
24
RURALSENIORSANDTHEIRHOMES
MANY SENIORS HAVE VERY LOW INCOMES
HAC Tabulations of U.S. Census Bureau 2006-2010 American Community Survey.
25
0
5
10
15
20
25
30
35
1966
1967
1968
1969
1970
1971
1972
1973
1974
1975
1976
1977
1978
1979
1980
1981
1982
1983
1984
1985
1986
1987
1988
1989
1990
1991
1992
1993
1994
1995
1996
1997
1998
1999
2000
2001
2002
2003
2004
2005
2006
2007
2008
2009
2010
PercentinPoverty
Poverty By Age, 1966-2010
Poverty Rate, All Ages Poverty Rate, Age 65 and Over
RURALSENIORSANDTHEIRHOMES
SIGNIFICANT GAINS HAVE BEEN MADE TO REDUCE POVERTY AMONG
SENIORS
HAC Tabulations of U.S. Census Bureau 2006-2010 American Community Survey.
9.8%
11.4%
7.2%
8.2%
11.8%
14.0%
0.0%
2.0%
4.0%
6.0%
8.0%
10.0%
12.0%
14.0%
16.0%
U.S. Rural & Small Town
PercentinPoverty
Senior Poverty By Residence & Gender, 2010
All Elderly Elderly Male Elderly Female
26
RURALSENIORSANDTHEIRHOMES
POVERTY RATES ARE STILL HIGHER AMONG RURAL SENIORS
HAC Tabulations of U.S. Census Bureau 2006-2010 American Community Survey.
27
RURALSENIORSANDTHEIRHOMES
Legend
Counties
Percent Senior Poverty
0.0 - 8.5
8.6 - 12.9
13.0 - 18.6
18.7 - 27.5
27.6 - 61.0
Poverty, Persons Age 65 and Over, 2010
SELECTED HOUSING AND HOUSEHOLD CHARACTERISTICS
Photo by Ann Olson
29
Owner
Occupied
Housing
Renter
Occupied
Single
Family
Housing
Renter
Occupied
Multifamily
Housing
Housing
With
Services
Assisted
Living
Long Term
Care Facility
SENIOR HOUSING CONTINUUM
RURALSENIORSANDTHEIRHOMES
Less Dependent More Dependent
A HEALTHY RANGE OF HOUSING OPTIONS IS VITAL FOR SENIORS’
WELL BEING
30
Owner
Occupied
Housing
Long
Term
Care
Facility
SENIOR HOUSING CONTINUUM
RURALSENIORSANDTHEIRHOMES
Less Dependent More Dependent
SENIOR HOUSIG OPTIONS ARE LIMITED IN MANY RURAL
COMMUNITIES
0.0%
5.0%
10.0%
15.0%
20.0%
25.0%
30.0%
U.S. Rural & Small Town
PercentElderlyOccupiedHomes
Occupied Housing Units – Householder Age 65
or Older, 2010
Senior-Occupied Homeowners Senior-Occupied Renters
31
RURALSENIORSANDTHEIRHOMES
HAC Tabulations of U.S. Census Bureau 2006-2010 American Community Survey.
HO
USI
NG
TE
NU
RE
0%
10%
20%
30%
40%
50%
60%
70%
80%
90%
100%
U.S. U.S. Senior Rural & Small Town Senior
ElderlyOccupiedHousingUnits
Housing Tenure, Householder Age 65 or Older, 2009
Renter Occupied
Owner-Occupied
32
RURALSENIORSANDTHEIRHOMES
MOST RURAL SENIORS OWN THEIR HOMES
HAC Tabulations of U.S. Census Bureau 2006-2010 American Community Survey.
HO
USI
NG
TE
NU
RE
33
RURALSENIORSANDTHEIRHOMES
0.0%
10.0%
20.0%
30.0%
40.0%
50.0%
60.0%
70.0%
80.0%
90.0%
15 to 34 35 to 44 45 to 54 55 to 59 60 to 64 65 to 74 75 +
HomeownershipRate
Age Group
Rural & Small Town Homeownership by Age and Mortgage Status, 2010
With a Mortgage Without a Mortgage
AS RURAL HOMEOWNERS AGE THEY HAVE LESS MORTGAGE DEBT
HAC Tabulations of U.S. Census Bureau 2006-2010 American Community Survey.
34
RURALSENIORSANDTHEIRHOMES
Manufactured Homes, 2010
Legend
Counties
Percent Manufactured Home
0.0 - 6.0
6.1 - 12.7
12.8 - 20.2
20.3 - 29.6
29.7 - 56.1
Manufactured Homes as a Percent of All Occupied Housing Units
35
RURALSENIORSANDTHEIRHOMES
Two or More
Persons, 73.4%
One
Person, 26.6%
Household Size, Rural & Small Town, 2009
Two or More
Persons, 55.4%
One
Person, 44.6%
Household Size, Rural & Small Town, Householder Age
65 or Over, 2009
36
RURALSENIORSANDTHEIRHOMES
MANY RURAL SENIORS LIVE ALONE
HAC Tabulations of U.S. Census Bureau 2006-2010 American Community Survey.
HOU
SING
AFF
ORD
ABILI
TY
FOR
OLD
ER
HO
MEO
WNE
RS
28.3%
60.0%
0.0%
10.0%
20.0%
30.0%
40.0%
50.0%
60.0%
70.0%
Owners Renters
PercentCostBurdened
Housing Cost Burden, Householders Age 65 and Over by
Tenure, 2010
37
RURALSENIORSANDTHEIRHOMES
HOUSING AFFORDABILITY IS AN INCREASNG PROBLEM FOR MANY
RURAL SENIORS
HAC Tabulations of U.S. Census Bureau 2006-2010 American Community Survey.
VE
HIC
LE
AV
AIL
ABI
LIT
Y
8.9%
12.5%
0.0%
2.0%
4.0%
6.0%
8.0%
10.0%
12.0%
14.0%
All Households Senior Households
PercentofHouseholdsWithNoVehicle
Households
No Vehicle Available, 2010
No Vehicle Available
38
RURALSENIORSANDTHEIRHOMES
TRANSPORATION IS A CHALLENGE IN MANY RURAL COMMUNITIES
HAC Tabulations of U.S. Census Bureau 2006-2010 American Community Survey.
HAC
RURALSENIORSANDTHEIRHOMES
RURALSENIORSANDTHEIIRHOUSING
SAVE THE DATE!
On June 19, at 3:00 ET,
HAC will host a webinar
Aging in Place: Home Repair for Rural Seniors.
Topics will include the using the USDA Section 504
grant program and leveraging weatherization
dollars for senior home repair.
For information, visit www.ruralhome.org or
contact Janice Clark at Janice@ruralhome.org.
RURALSENIORSANDTHEIRHOMES
www.ruralhome.org
HAC

The Silver Tsunami: Are We Prepared for a Senior Housing Population Boom in Rural America

Editor's Notes

  • #8 This a geographic distribution of the median age by county in 2010. in this map all counties with a media age above the national median are shaded in blue and the medium shade of blue indicates a median age of 40 or higher which is the rural rate and the darker blue areas have a media age of 45 or higher.
  • #9 Not only are median ages higher, but seniors make up a larger percentage of the population in rural areas. There are more than 40 million people over the age of 65 in the United States. In rural and small town areas there are more than 10 million seniors. Persons over the age of 65 comprise approximately 16 percent of rural and small town population, nearly 3 percentage points above the national rate.
  • #10 To give another perspective, approximately one fifth of the U.S. population live in rural and small town areas, but over one quarter of the nation’s .seniors reside in rural communities.
  • #11 Again this is a geographic representation of the senior population by county. Blue counties are those with a rate of seniors higher than the national rate. The darkest blue counties are those with more than 20 percent of their population age 65 and over. You’ll again notice some regional clusters or patterns among the concentration of seniors especially in the Midwestern plains states and in portions of The Appalachians and Florida. Another way to think about this is that for these counties in blue it already 2050. In this respect rural America serves as a harbinger of things to come for the entire nation
  • #35 Manufactured homes are an important source of housing for millions of Americans, especially those with lower incomes and in rural areas. There are approximately 7 million occupied manufactured homes in the U.S., comprising about 7 percent of the nation’s housing stock. More than half of all manufactured homes are located in rural areas around the country. Also, more than half of all manufactured homes are located in Southeastern states. Manufactured homes are less prevalent among rural households over the age of 65 than among rural seniors. This may be largely attributable to the fact that mobile homes are a relatively recent housing option that arose after many current seniors were in the purchasing stage of their housing life cycle. Nevertheless, the proportion of rural senior households residing in mobile homes is double that of their suburban and urban counterparts, and over half of all rural seniors in mobile homes live in the South.The proportion of rural seniors living in mobile homes is likely to increase in the coming decades, as rural baby boomers currently occupy a large portion of the nation’s manufactured homes in rural areas. In fact, this may be a large and unforeseen issues that will develop in the coming decades. There is disagreement on the lifespan of manufactured homes, but many baby boomers are now living in older manufactured homes that they may have purchased in the 1970s and 80s and are nearing the end of their usefulness. With reduced investment value, poor accessibility standards and difficulty in repair and rehabilitating older manufactured homes may leave many rural seniors with few options as they age in this type of housing.
  • #36 Land-lease manufactured home communities, often referred to as “mobile home” or “trailer” parks, are home to over 2.3 million households nationally. Contrary to popular perception, most manufactured homes are not located in park or community settings. Still, the Housing Assistance Council estimates that there are more than 50,000 manufactured home communities in the United States. Households who reside in park settings have lower incomes and are more likely to be elderly than their counterparts in scattered site manufactured homes. In fact a number of these communities are restricted to older residents In manufactured home communities, usually one individual or entity owns the land, while residents own their homes and rent the land on which their homes sit. In this land tenure arrangement, residents are frequently both owners and renters, and are often caught in a “gray area” of legal protection and recourse. Several states and jurisdictions have enacted special protections for residents of manufactured housing communities, but these vary widely. According to a recent analysis by AARP, at least 15 states have no manufactured home park statutes at all. AARP. Manufactured Housing Community Tenants: Shifting the Balance of Power. Washington DC: 2004.  Housing Assistance Council. “Manufactured Home Geography Project.” Washington, D.C.: Housing Assistance Council, 2010. Housing Assistance Council. Moving Home: Manufactured Housing in Rural America. Washington, D.C.: Housing Assistance Council, 2005.