Downloaded 15 times
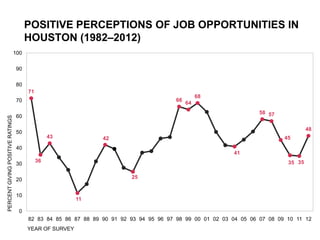
![THE INTEREST AMONG ANGLOS IN SOMEDAY
MOVING FROM SUBURBS TO CITY AND FROM CITY
TO SUBURBS (1999-2012)
65
If lives in SUBURBS: 'very' or 'somewhat interested' in someday moving to the city.
60
PERCENT SAYING 'VERY' OR 'SOMEWHAT INTERESTED’
If lives in CITY: 'very' or 'somewhat interested' in someday moving to the suburbs.
55
52
50 48
47
45 r= -.092, p=.000
44 40
39
40
37
34
35 33
31 31
29 29
30 33 28
26 26 28
29
25 27 22 27
20
20 22 r= +.038, p=.009
15
10 [Anglo respondents only.]
5
1999 2000 2003 2004 2005 2006 2007 2008 2009 2010 2011 2012
YEAR OF SURVEY](https://image.slidesharecdn.com/htownday-dr-stephenklineberg-futuredevelopment-121023125329-phpapp02/85/HTown-Day-2012-Dr-Stephen-Klineberg-10-320.jpg)


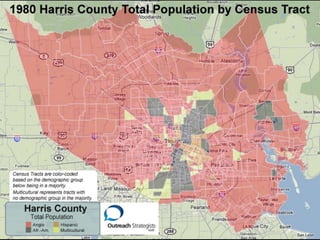
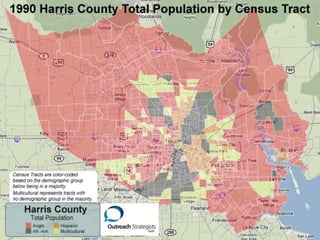
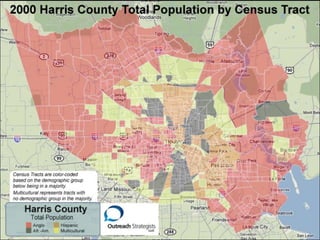
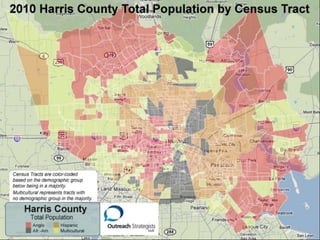
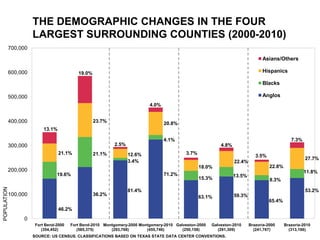
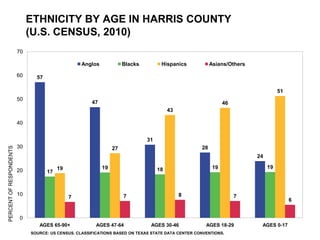
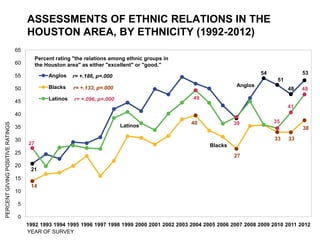
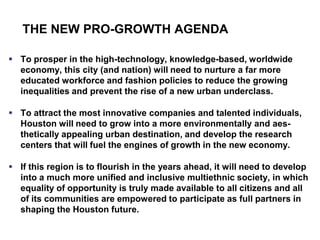

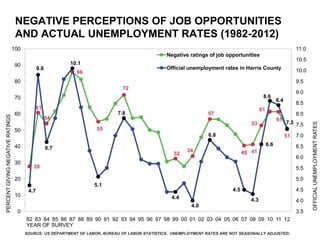
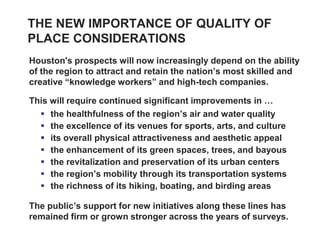
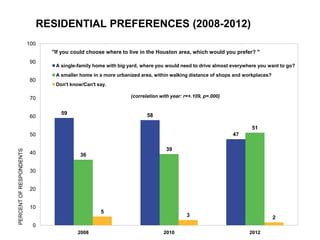
The document summarizes key findings from 31 years of the Kinder Houston Area Survey, which has tracked economic, demographic, and social changes in the Houston region through representative samples of Harris County residents each year since 1982. Some of the main trends highlighted include: - The transition from an oil and gas-based economy to a more knowledge-based, skilled workforce economy. Most well-paying jobs now require higher education. - Rapid demographic changes, with Houston now being one of the most ethnically diverse cities in the US, and Anglo populations declining as Hispanic and Asian populations increase. - Changing preferences toward more urban living, walking/biking accessibility, and quality of place factors like the environment and cultural amenities


