
Recommended
More Related Content
Similar to A greying world
Similar to A greying world (19)
Recently uploaded
Recently uploaded (20)
A greying world
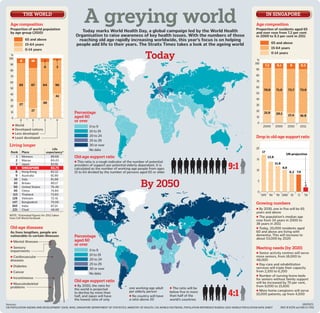
- 1. THE WORLD Age composition Proportion of world population A greying world Today marks World Health Day, a global campaign led by the World Health IN SINGAPORE Age composition Proportion of residents aged 65 by age group (2010) and over rose from 7.2 per cent Organisation to raise awareness of key health issues. With the numbers of those in 2000 to 9.3 per cent in 2011 65 and above reaching old age rapidly increasing worldwide, this year’s focus is on helping 15-64 years people add life to their years. The Straits Times takes a look at the ageing world 65 and above 0-14 years 15-64 years % 100 8 16 Today % 0-14 years 90 100 7.2 8.1 9 9.3 6 3 80 90 70 80 60 70 65 67 64 56 50 60 70.9 71.9 73.7 73.9 40 50 41 30 40 30 27 30 20 17 20 10 Percentage 21.9 20.1 17.4 16.8 0 aged 60 10 or over 0 ■ World 0 to 9 2000 2005 2010 2011 ■ Developed nations 10 to 19 ■ Less developed ■ Least developed 20 to 24 Drop in old-age support ratio 25 to 29 Living longer 30 or over Life 20 No data Rank Place expectancy* 17 UN projection 1 Monaco 89.68 Old-age support ratio 13.8 2 Macau 84.43 15 ■ This ratio is a rough indicator of the number of potential 9:1 3 Japan 83.91 11.8 providers of support per potential elderly dependant. It is 4 SINGAPORE 83.75 calculated as the number of working-age people from ages 9.9 10 8 Hong Kong 82.12 15 to 64 divided by the number of persons aged 65 or older 8.2 7.9 9 Australia 81.90 By 2050 10 Italy 81.86 5 30 Britain 80.17 50 United States 78.49 2 95 China 74.84 0 113 Thailand 73.83 1970 ’80 ’90 2000 ’10 ’11 ’50 128 Vietnam 72.41 147 Bangladesh 70.06 Growing numbers 160 India 67.14 221 Chad 48.69 ■ By 2030, one in five will be 65 years and above NOTE: *Estimated figures for 2012 taken ■ The population’s median age from CIA World Factbook rose from 34 years in 2000 to 38 years in 2011 Old-age diseases ■ Today, 20,000 residents aged As lives lengthen, people are 60 and above are living with vulnerable to certain illnesses Percentage dementia. This will increase to about 53,000 by 2020 ■ Mental illnesses aged 60 or over ■ Sensory Meeting needs (by 2020) impairments 0 to 9 ■ Senior activity centres will serve ■ Cardiovascular 10 to 19 more seniors, from 18,000 to diseases 20 to 24 48,000 25 to 29 ■ Day-care and rehabilitation ■ Diabetes 30 or over services will triple their capacity ■ Cancer from 2,100 to 6,200 No data ■ Number of nursing home beds ■ Incontinence for seniors without family support Old-age support ratio will be increased by 70 per cent, ■ Musculoskeletal ■ By 2050, the ratio for from 9,000 to 15,600 problems one working-age adult ■ The ratio will be the world is projected 4:1 per elderly person below five in more ■ More home caregivers will serve to decline by more than 10,000 patients, up from 4,000 half, and Japan will have ■ No country will have than half of the the lowest ratio of only a ratio above 20 world’s countries Sources: GRAPHICS: UN POPULATION AGEING AND DEVELOPMENT 2009, WHO, SINGAPORE DEPARTMENT OF STATISTICS, MINISTRY OF HEALTH, CIA WORLD FACTBOOK, POPULATION REFERENCE BUREAU 2010 WORLD POPULATION DATA SHEET MIKE M DIZON and AMELIA TENG