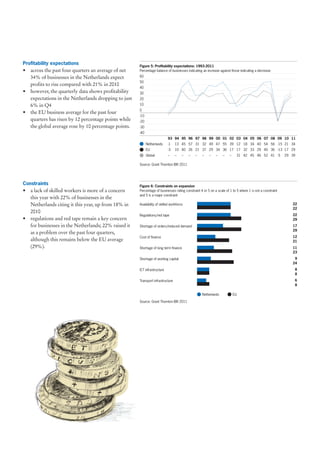
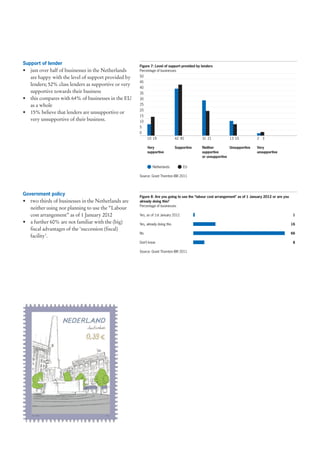
The Dutch economy has slowed due to the eurozone crisis, with GDP contracting in Q3 2011. Exports remain positive but are expected to decline as demand from Europe and the US weakens. Businesses in the Netherlands are pessimistic about the economy over the next year, though revenue and profit expectations have risen slightly since 2010. A lack of skilled workers and regulations are cited as top constraints on business growth. The outlook is linked to the eurozone - a complete meltdown would seriously threaten forecasts of a return to moderate growth by 2013.
1. Focus on: Netherlands
International Business Report 2012 – Economy focus series
The economy The business perspective
Despite its historic stability and economic strength, The Grant Thornton International Business Report
the Netherlands economy has been unable to escape (IBR) surveys the views of more than 11,500
the impact of the crisis in the eurozone. Having businesses in 40 economies around the world. This
expanded strongly in Q1, the economy has slowly report focuses on the experiences of privately held
ground to a halt as business and consumer businesses in the Netherlands and their expectations
confidence wanes in the face of the economic storm for the next 12 months, as illustrated in figure 1.
which is threatening to engulf not just Europe, but The IBR survey tells us that businesses in the
the entire global economy. The budget for 2012 is Netherlands are much less optimistic about their
aiming to return the public finances to balance and economy over the next 12 months, compared with
ensure financial sector stability. 12 months previously. Business expectations for
The key indicators1 are highlighted below: revenue and profitability have risen since last year
• following quarterly growth of just 0.2% in Q2, but have not returned to 2008 levels. Bureaucracy
the economy contracted by -0.3% in Q3 from and a lack of skilled workers are cited as the most
the previous quarter; year-on-year the economy pressing constraints on growth.
expanded by 1.1% in the third quarter
• exports remained positive in Q3 at just by 0.3%;
this was down on the three months to June
(1.0%), but represented a 4.0% from the same
period 12 months previously
• consumer spending contracted by 0.2% from the
previous quarter in Q3, with household
spending dropping 1.1%
• capital expenditure was up by 4.6% year on year
in Q3, although it contracted by 1.1% quarter
on quarter.
1
Source: International Monetary Fund, The Economist and Experian.
2. The outlook
Figure 1: Key indicators for PHBs
The outlook for the Netherlands economy is
inextricably linked to that of the eurozone. Growth Netherlands compared to the EU average 2009 2010 2011 2011
of 1.4% is forecast for 2011, but following Neth Neth Neth EU
contraction in Q3 the economy is likely to slide Outlook for the economy over the next 12 months
Net optimism -37% +16% -44% -17%
back into recession due to declining consumer
sentiment, fiscal tightening and weakening export
Change in employment levels
demand. A contraction of 0.6% in 2012 is forecast to Net hiring expectations -5% +12% +18% +15%
be followed by a period of moderate growth,
averaging 1.5% per annum in the period 2013-16. A Constraints on expansion
complete meltdown in the eurozone represents a Regulations/red tape 25% 23% 22% 29%
serious downside risk to this forecast. Lack of skilled workers 40% 18% 22% 22%
Exports have held up to date, but look likely to Source: Grant Thornton IBR 2011
decline over the next year as demand from Europe
and the US slumps. The manufacturing and
agricultural industries in particular are likely to
suffer from diminishing exports. The current Talk to us to find out how we can help you deal
account is expected to remain in surplus up until at with the challenges your business is facing today.
least 2016, although this is likely to narrow from an
estimated peak of 8.4% of GDP in 2011.
Frank Ponsioen
Government policy over the next five years is
T +31 (0) 172 42 38 70
likely to remain focused on deficit reduction, with
E frank.ponsioen@gt.nl
reform of the social security system and downsizing
W www.gt.nl
the size of the civil service and military high on the
agenda. The official retirement age has also been
raised to 67 but this will not come into effect until
2025.
3. International Business Report results
The Grant Thornton IBR 2011 reveals that global Figure 2: Outlook for the economy over the next 12 months: 2011
business optimism dipped again in the fourth Net percentage of businesses indicating optimism less those indicating pessimism
quarter. Businesses sentiment in the Netherlands 40
30
plummeted to net -44%, down from net -8% in the
20
previous quarter. Globally, the quarter-on-quarter 10
average declined from 3% to 0% 0
The sovereign debt crisis is weighing heavily on -10
-20
businesses confidence in Europe; business optimism
-30
across the European Union dropped to -17% in Q4. -40
However confidence in the BRIC economies ticked -50
upwards to 34%. Q1-2011 Q2-2011 Q3-2011 Q4-2010
Netherlands 35 34 -8 -44
Year-on-year optimism amongst businesses has EU 31 34 0 -17
declined slightly from net 22% in 2010, to net 16% Global 34 31 3 0
across 2011.
Source: Grant Thornton IBR 2011
Optimism/pessimism
• business optimism in the Netherlands fell
further in Q4, dropping to -44%, down from
-8% in Q3
• the EU3 average declined from 0% in Q3 to
-17% in Q4
• globally, business sentiment dropped by
3 percentage points in Q4 to stand at 0%.
2
the balance is the proportion of companies reporting they are optimistic less
those reporting they are pessimistic.
3
for the purposes of IBR, the term ‘EU’ refers to those EU countries covered
by our survey – Belgium, Denmark, France, Finland, Germany, Greece,
Ireland, Italy, the Netherlands, Poland, Spain, Sweden and the United
Kingdom.
4. Employment Figure 3: Employment history: 1993-2011
• net 18% of businesses in the Netherlands expect Percentage balance of businesses indicating an increase against those indicating a decrease
to increase staff levels over the next 12 months, 60
55
compared with 15% of businesses across the EU
50
• actual employment growth reported by 45
businesses in the Netherlands for 2010 (-4%) 40
was much lower than expected 12 months 35
30
previously (12%).
25
20
15
10
5
0
-5
-10
-15
-20
-25
-30
93 94 95 96 97 98 99 00 01 02 03 04 05 06 07 08 09 10 11*
Exp. Neth. 8 -16 30 38 29 27 40 30 42 33 3 -1 15 18 40 56 -5 12 18
Exp. EU -6 -5 18 14 10 20 26 32 34 20 5 9 10 12 27 27 -12 -1 15
Act. Neth. – – 1 -13 -5 -9 -8 41 26 25 -1 -12 3 34 45 23 18 -4 –
Act. EU – – 24 17 21 36 29 41 41 18 7 6 10 25 30 17 -19 14 –
*2011 data will be documented in IBR 2012
Please note that the expected values are represented by the bars and the actual values by the lines
Source: Grant Thornton IBR 2011
Revenue expectations
Figure 4: Revenue expectations: 1993-2011
• expectations for increasing revenues rose on Percentage balance of businesses indicating an increase against those indicating a decrease
average across the past four quarters to stand at 80
70
45%
60
• the EU business average also rose to 40%, up 50
from 28% 40
• globally, expectations have risen from 40% in 30
20
2010 to 50% in 2011
10
• however, revenue expectations in the 0
Netherlands dropped from 50% in Q3 to just -10
20% in Q4. -20
93 94 95 96 97 98 99 00 01 02 03 04 05 06 07 08 09 10 11
Netherlands 39 30 68 64 65 61 71 70 72 55 43 32 62 53 71 79 4 32 45
EU 23 40 65 58 47 64 58 63 64 46 33 44 49 51 59 65 5 28 40
Global – – – – – – – – – – 44 58 63 61 70 63 11 40 50
Source: Grant Thornton IBR 2011
5. Profitability expectations Figure 5: Profitability expectations: 1993-2011
• across the past four quarters an average of net Percentage balance of businesses indicating an increase against those indicating a decrease
34% of businesses in the Netherlands expect 60
50
profits to rise compared with 21% in 2010
40
• however, the quarterly data shows profitability 30
expectations in the Netherlands dropping to just 20
6% in Q4 10
0
• the EU business average for the past four
-10
quarters has risen by 12 percentage points while -20
the global average rose by 10 percentage points. -30
-40
93 94 95 96 97 98 99 00 01 02 03 04 05 06 07 08 09 10 11
Netherlands -1 13 45 57 31 32 49 47 55 39 12 18 34 40 54 56 -15 21 34
EU -3 10 40 26 21 37 29 34 36 17 17 32 33 29 40 36 -13 17 29
Global – – – – – – – – – – 31 42 45 46 52 41 -5 29 39
Source: Grant Thornton IBR 2011
Constraints Figure 6: Constraints on expansion
• a lack of skilled workers is more of a concern Percentage of businesses rating constraint 4 or 5 on a scale of 1 to 5 where 1 is not a constraint
and 5 is a major constraint
this year with 22% of businesses in the
Netherlands citing it this year, up from 18% in Availability of skilled workforce 22
22
2010
Regulations/red tape 22
• regulations and red tape remain a key concern 29
for businesses in the Netherlands; 22% raised it Shortage of orders/reduced demand 17
29
as a problem over the past four quarters,
Cost of finance 12
although this remains below the EU average 21
(29%). Shortage of long term finance 11
23
Shortage of working capital 9
24
ICT infrastructure 8
8
Transport infrastructure 6
8
Netherlands EU
Source: Grant Thornton IBR 2011
6. Support of lender Figure 7: Level of support provided by lenders
• just over half of businesses in the Netherlands Percentage of businesses
are happy with the level of support provided by 50
45
lenders; 52% class lenders as supportive or very
40
supportive towards their business 35
• this compares with 64% of businesses in the EU 30
as a whole 25
20
• 15% believe that lenders are unsupportive or
15
very unsupportive of their business. 10
5
0
10 19 42 45 31 21 13 10 2 3
Very Supportive Neither Unsupportive Very
supportive supportive unsupportive
or unsupportive
Netherlands EU
Source: Grant Thornton IBR 2011
Government policy Figure 8: Are you going to use the “labour cost arrangement” as of 1 January 2012 or are you
• two thirds of businesses in the Netherlands are already doing this?
Percentage of businesses
neither using nor planning to use the “Labour
cost arrangement” as of 1 January 2012 Yes, as of 1st January 2012 1
• a further 60% are not familiar with the (big) Yes, already doing this 16
fiscal advantages of the ‘succession (fiscal)
No 66
facility’.
Don’t know 8
Source: Grant Thornton IBR 2011