Recession keepshouse prices in the dumps in most european markets
Savills european investment market 2014
1. Savills World Research
European Commercial
Market report
European investment March 2014
savills.co.uk/research 01
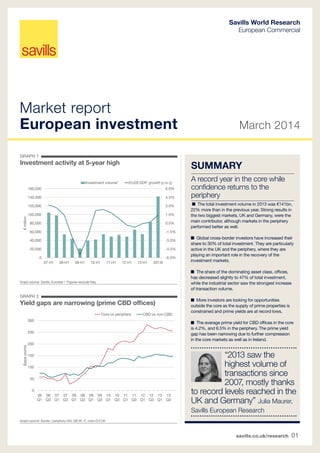
■ The total investment volume in 2013 was €141bn,
22% more than in the previous year. Strong results in
the two biggest markets, UK and Germany, were the
main contributor, although markets in the periphery
performed better as well.
■ Global cross-border investors have increased their
share to 30% of total investment. They are particularly
active in the UK and the periphery, where they are
playing an important role in the recovery of the
investment markets.
■ The share of the dominating asset class, offices,
has decreased slightly to 47% of total investment,
while the industrial sector saw the strongest increase
of transaction volume.
■ More investors are looking for opportunities
outside the core as the supply of prime properties is
constrained and prime yields are at record lows.
■ The average prime yield for CBD offices in the core
is 4.2%, and 6.5% in the periphery. The prime yield
gap has been narrowing due to further compression
in the core markets as well as in Ireland.
Summary
A record year in the core while
confidence returns to the
periphery
Graph source: Savills, Eurostat / *Figures exclude Italy
Graph source: Savills / periphery=ES, GR,IR, IT, core=D,F,UK
graph 1
Investment activity at 5-year high
graph 2
Yield gaps are narrowing (prime CBD offices)
“2013 saw the
highest volume of
transactions since
2007, mostly thanks
to record levels reached in the
UK and Germany” Julia Maurer,
Savills European Research
0
50
100
150
200
250
300
06
Q1
06
Q3
07
Q1
07
Q3
08
Q1
08
Q3
09
Q1
09
Q3
10
Q1
10
Q3
11
Q1
11
Q3
12
Q1
12
Q3
13
Q1
13
Q3
Basispoints
Core vs periphery CBD vs non-CBD
-6.0%
-4.5%
-3.0%
-1.5%
0.0%
1.5%
3.0%
4.5%
6.0%
0
20,000
40,000
60,000
80,000
100,000
120,000
140,000
160,000
07 H1 08 H1 09 H1 10 H1 11 H1 12 H1 13 H1 2014f
€million
Investment volume* EU28 GDP growth (y-o-y)
2. March 2014
savills.co.uk/research 02
Market report | European investment markets
Economy
2013 proved to be another milestone
in the slow economic recovery in the
Eurozone. GDP growth in the last
quarter of the year was 0.3% although
on an annual level it was still slightly
negative at 0.4%. For 2014, the
European Commission predicts the
Eurozone economy to expand by 1% -
and a return to growth for all peripheral
economies - under the assumption that
domestic demand and exports will pick
up as expected and member countries
will continue to implement structural
reforms.
The positive economic sentiment
registered in most countries (DE and
BE above average) and industries
(consumer and retail trade stronger
than manufacturing and construction)
has not yet reflected in the
unemployment rate which remains the
biggest worry for a sustained recovery.
The average rate across the Eurozone
was relatively unchanged at 12% in
December 2013, with big regional
differences between the core (AT
4.9%, DE 5.1%) and the periphery (GR
27.8%, ES 25.8%).
The inflation rate slowed to 0.7% in
January, which is the lowest reading
since July 2011. Despite deflationary
pressures in some parts of the
Eurozone the ECB kept the base rate
unchanged at the record low of 0.25%
at its January meeting. However, ECB
president Mario Draghi emphasised to
maintain the high degree of monetary
accomodation and to take further
action if required.
A strong year, boosted
by record results in the
UK and Germany
2013 closed with the highest
investment volume since the
beginning of the crisis in 2007. In
total, approximately €141.4bn were
transacted, 22% more than in the
year before. The second half was
particularly strong, at almost €85bn
which places it 29% above the 2012
result and makes it the strongest half
year since H2 2007.
The peripheral markets (ES, GR, IRE,
IT), Poland and the UK registered
the strongest increase of investment
activity. Most prominently Greece saw
a ten-fold rise of volume thanks to the
privatisation sale of public assets. In
the UK, the continued strong demand
coming from cross-border buyers as
well as higher activity in the regional
markets outside London contributed
to the record result of £53bn (€63bn),
58% above the 2012 level.
On the other side, France (-8%),
Sweden (-17%) and Norway (-23%) all
recorded a negative growth year-on-
year. In Norway this drop can mostly
be attributed to the return of a more
balanced market with a higher number
of mid-scale transactions while in
Sweden it is caused by a lack of willing
sellers. However, as the availability of
financing is improving in both these
markets, the number of transactions is
increasing and at least in Sweden, also
secondary assets are proving easier
to sell.
In France, investors’ sole focus
on prime product has limited the
transaction volume.
Thanks to the strong UK investment
volume, the three biggest markets,
UK, DE and FR increased their share
of total European investment from
74% in 2012 to 77% last year with the
UK alone accounting for 45%. This is
the highest concentration of activity in
these markets since 2006.
Global cross-border
flows are fuelling
demand
Cross-border investors are playing an
important role in the recovery of the
investment markets of the peripheral
economies. In Spain, the share of
cross-border investment has jumped
from 36% in 2012 to 78% in 2013,
in Italy from 64% to 79% over the
graph 4
Investment volume Top 3 countries account for 77% of
the European volume
graph 5
Investment by asset type Offices
dominate but industrial is rising
Graph source: Savills Source: RCA, Savills analysis
€ -
€ 50
€ 100
€ 150
€ 200
€ 250
2007 2008 2009 2010 2011 2012 2013
billion
UK Germany France Rest
47%
12%
26%
15%
Office
Industrial
Retail
Other
graph 3
Unemployment levels are not falling
yet Average in the Eurozone is 12%
Graph source: Eurostat
0%
5%
10%
15%
20%
25%
30%
Norway
Austria
Germany
Netherlands
UK
Sweden
Belgium
Poland
France
EU28
Ireland
Italy
Spain
Greece
2012 2013
3. March 2014
savills.co.uk/research 03
Market report | European investment markets
same period. Together with Poland,
these two countries have the highest
share of cross-border investment of
all countries surveyed in this report.
Looking more closely at the sources
of these flows, European investors
have come back to the Spanish
market. Their share of total investment
increased from 10% in 2012 to 40%
in 2013, with French buyers alone
accounting for €520m of transactions,
compared to €70m in 2012. Equally,
after being absent in 2012, German
open-ended funds Deka and Union
both purchased prime properties in
Barcelona and Madrid last year.
In the core markets, domestic
investors dominated with shares
ranging from 67% in France and
Germany to 88% in Sweden. Cross-
border investment coming from
European sources weakened in all
these markets, including the UK, with
French investment being distinctively
lower than in the year before.
The weakening of intra-regional flows
is also reflected on a pan-European
level, across our survey area the share
of European cross-border investment
fell from 24% in 2012 to 16% in 2013.
On the other hand, global investment
flows increased their share to almost
30% (25% in 2012). Partly responsible
for this might be the type of global
investors currently active in European
markets. US investment, the largest
single source of global cross-border
money, comes mostly in the form of
private-equity funds (e.g. Blackstone
and Lone Star) who have a certain
preference for portfolio acquisitions.
Sovereign wealth funds from the
Middle East and AsiaPac, the other
main group of global players here,
have very large amounts of capital to
invest and usually go for investments
of at least €200m.
Offices dominate,
but industrial is rising
strongest
Compared to 2012, all asset types
saw an increase in transaction
volume, although the industrial sector
recorded the most pronounced rise
(+27% year-on-year). The industrial
sector is traditionally strong in the
transport hubs, Netherlands (21%),
Poland (33%), but thanks to a portfolio
purchase by Norges Bank its share
graph 7
Cross-border investment Domestic players dominate in
the core, apart from the global UK market
Graph source: Savills, RCA (IT, SE, UK)
graph 8
Prime yields Markets where prime yields
have shifted year-on-year
Graph source: Savills
-200
-150
-100
-50
0
50
Dublin
Amsterdam
London
Paris
Stockholm
Berlin
Dusseldorf
Frankfurt
Brussels
Vienna
Hamburg
Athens
Milan
Munich
Warsaw
Basispoints
CBD Office Industrial SC
0%
10%
20%
30%
40%
50%
60%
70%
80%
90%
100%
BE DE ES FR IRE IT NL PL SE UK
Domestic European Global
“The limited supply of prime assets in
the core is benefitting both, secondary
locations in core, and prime properties in
non-core markets ” Julia Maurer, Savills European
Research
also increased strongly in Italy (14% vs
1% in 2012).
Overall, the office sector accounts for
the majority of investment volume,
although its share has decreased
slightly to 47% on average across the
survey area (from 51% in 2012) as the
market becomes more balanced. This
is particularly true in the periphery,
Ireland, Italy and Spain, where the
share of the retail sector has increased
and is back in line with the five-year
average level, or in the case of Ireland
even higher (32%).
Investors are
increasingly looking
outside the core
As demand for core properties
graph 6
Prime yields Historically low in the core,
stable in the periphery
Graph source: Savills
4. March 2014
savills.co.uk/research 04
Market report | European investment markets
Outlook
2014 will see more markets
and sectors benefitting from
continued investor demand
■ After the record transaction level achieved in 2013,
we expect activity to normalise across most markets.
The total investment volume in the survey area will
increase slightly by 4% year-on-year.
■ France, Sweden and Spain should all see a double-
digit investment volume growth in 2014, which is a
return to normal levels for the first two countries, and
confirms the ongoing interest of investors in the latter
market, believing that prices have hit the bottom.
■ 2014 will see continued high demand for prime
investment opportunities with interest from cross-
border buyers adding further pressure on pricing
levels. We believe that a more diverse group of buyers
will be looking into markets outside the core, both on
a local and regional level. This development will be
supported by a softening in lending restrictions. Given
the oversupply of potential debt in the core, there will
be a continued focus on assets outside this market.
■ Prime yields will stay stable across most sectors
and markets with some notable exceptions: further
hardening of all yields is expected in Germany – the
safest haven, additionally boosted by strong business
and consumer sentiment - and Ireland – which is
right in the radar of global investors. Among the
different sectors, the industrial one stands out, where
we expect prime yields to decrease in half of the
markets surveyed. Not least because of the growth in
ecommerce and the entry of some major US and UK
institutional players in the mainland European market,
will the industrial sector become a more established
investment class.
4.0%
4.5%
5.0%
5.5%
6.0%
6.5%
7.0%
7.5%
8.0%
07Q1
07Q2
07Q3
07Q4
08Q1
08Q2
08Q3
08Q4
09Q1
09Q2
09Q3
09Q4
10Q1
10Q2
10Q3
10Q4
11Q1
11Q2
11Q3
11Q4
12Q1
12Q2
12Q3
12Q4
13Q1
13Q2
13Q3
13Q4
Offices Shopping Centres Industrial
continues to be high, investors looking
for higher returns, and who are also
less risk-averse, are employing two
different investment strategies: they
are either looking at value-add or
opportunistic opportunities in the
core markets, or as described earlier,
at prime assets in peripheral or
secondary markets.
In the UK and Germany this is reflected
in rising interest in office properties
outside the CBD locations in London
and the German top 6, but also in
higher activity in the regional markets
in the UK and secondary cities in
Germany. This development is mostly
driven by domestic investors who
have better market knowledge. Non-
CBD yields in these markets have
compressed by 32 bps on average in
Q4 2013, secondary CBD yields by
16bps.
In France, investors have been more
wary of the recovery of the market
outside Paris CBD. Accordingly, yields
in the secondary markets have moved
out by 38 bps on average across all
sectors.
In the peripheral markets the rebound
in investment activity last year is a
positive sign although full confidence
in the recovery of these markets is not
yet restored. Cross-border investment
in these countries is dominated by the
more opprtunistic funds looking for
higher yields, while risk-averse buyers
are still relatively absent. Yields across
all sectors have therefore stayed
stable, with some outward movement
graph 10
End-year prime yield outlook Mostly
stable, slight hardening of industrial yields*
Graph source: Savills/ *Savills survey of AT, BE, ES, FR, DE, GR, IR, NL, NO, PL,
SE, UK
graph 9
European prime yield averages Slight inward yield
shift underpinned by core markets and Ireland
Graph source: Savills
in the secondary markets.
Prime yields are
hardening in the
core and stabilising
elsewhere
The hardening of average prime
office yields across the survey area
is therefore due to the continuous
downward pressure on yields in the
core markets. Prime CBD yields in
London, Paris and the German top 6
have actually reached a level that was
last achieved pre-crisis in 2007. On
average it is 4.2% in these markets.
In comparison, the average prime CBD
office yield in the whole survey area
stood at 5.2% in Q4 13, 19bps lower
than at the end of 2012, reflecting
a yield compression for the sixth
consecutive quarter. Prime non-CBD
office yields also hardened slightly
and stood at 6.6% at the end of
last year, a compression of 25bps.
The polarisation between core and
periphery therefore persists although
the yield gap on both, local and
regional level has been narrowing for
the sixth consecutive quarter.
The prime industrial yield is 7.4%,
down from 7.65% at the end of
2012. Strong demand from a growing
group of cross-border buyers (e.g.
Segro, Blackstone, Delin) combined
with limited supply in the major hubs
has resulted in on-going prime yield
compression in this sector, which is
less impacted by rental volatility than
offices and retail.
■
0% 20% 40% 60% 80% 100%
Move out
Stable
Move in
Offices Retail Industrial
5. March 2014
savills.co.uk/research 05
Market report | European investment markets
Austria
Following a strong fourth quarter, the
transaction volume increased slightly
from €1.65 bn in 2012 to €1.7 bn in
2013. This upswing is expected to
continue in 2014 since several deals
are about to be closed. Investors
are still mostly focused on the core
segment, where demand largely
exceeds supply. Due to the limited
supply of core properties and because
of the increasing take-up levels,
transactions outside the top segment
become more frequent.
Most transactions were in the price
Belgium
Following a quieter second half, the
total investment volume in 2013
reached €2.17 billion (+7% compared
to 2012). German funds have been
particularly active on the market in
2012 with €452 million (21%) invested
exclusively in office assets located in
central Brussels. However, the Belgian
investment market continues to be
dominated by domestic players (72 %).
For the first time since 2008, the office
investment volume surpassed the €1
bn mark in 2013 (+75% compared
to 2012). Demand remains focused
on well-let prime assets. Due to the
scarcity of these assets and the low
long-term interest rates, prime office
yields declined in 2013 and are now
trading at 6% for buildings with
standard 6/9 years leases (-25bps
compared to 2012). Prime yields
should remain under pressure in 2014,
particularly if Belgian LT interest rates
remain low.
On the other hand, the retail market
that outperformed in 2012, has slowed
down with €57m invested (-17%
compared to 2012).
European country review
€0
€500
€1,000
€1,500
€2,000
€2,500
€3,000
€3,500
€4,000
2007 2008 2009 2010 2011 2012 2013 2014
million
H1 H2 Forecast
graph 11
Austria
Graph source: EHL
Graph source: Savills
graph 12
Belgium
graph 13
France
Graph source: Savills
range of €20-60m, only a very limited
number of large-scale transactions
above €100m took place. In 2013,
office and retail transactions
accounted for more than two thirds
of the volume with a 40% and 30%
share respectively, hotels amounted
to 15%. The market is dominated by
Austrian and German investors with an
80% share of the transaction volume
which will continue in 2014. There is
also an increasing number of investors
from the former Soviet Union who
are showing in the Austrian market,
especially in the hotel segment.
PRIME YIELDS
END-YEAR OUTLOOK Offices: stable Retail: stable Industrial: stable
PRIME YIELDS
END-YEAR OUTLOOK Offices: stable Retail: stable Industrial: move in
PRIME YIELDS
END-YEAR OUTLOOK Offices: stable Retail: stable Industrial: stable
€0
€500
€1,000
€1,500
€2,000
€2,500
€3,000
€3,500
€4,000
€4,500
€5,000
2007 2008 2009 2010 2011 2012 2013 2014
million
H1 H2 Forecast
€0
€5,000
€10,000
€15,000
€20,000
€25,000
€30,000
2007 2008 2009 2010 2011 2012 2013 2014
million
H1 H2 Forecast
France
In spite of the slowing rental
market and a low growth economic
environment, the transaction volume
reached €16.1bn, for the third
consecutive year. There were 45
large-scale transactions of more than
€100m which boosted the market,
representing 55% of the total. However
a return of transactions in the €50
-100m range is felt, giving way to a
more balanced and diversified market.
French investors continue to dominate
the market (68 % of the total) while
German and Middle-Eastern buyers
are less active. They represent no
more than 4% and 9 % against 9 %
and 12 % in 2012. On the other hand,
American investors have returned to
the market, with a 8% share of the
total.
There is an increasing share of activity
outside the CBD and Paris in general,
with the 1st Inner Suburb attracting
most of this outward movement. The
main reason for this development is
the more plentiful and diversified offer
here as well as the more attractive
prices for prime product.
6. March 2014
savills.co.uk/research 06
Market report | European investment markets
Germany
2013 recorded the highest transaction
volume since 2007 (€30.4bn) which
is also a 20% increase y-o-y.
Investments into office properties rose
by 61% year-on-year to €13.27bn
(market share of 44%) and pushed
retail transactions, which have been
the preferred asset type in previous
years, into second place with a share
of 33% and a total volume of €9.96bn.
This was mainly due to a lack of
supply, particularly with regard to
shopping centres and prime high street
assets. Strong demand combined with
a lack of core properties available in
the market resulted in continuously
Greece
Although the economy is shrinking
more slowly and forward-looking
indicators point to a slight
improvement, the outlook remains
fragile. Nevertheless, the perception
amongst some investors is that the
market has reached its bottom and
opportunities are emerging. This is
reflected in last year’s investment
activity which increased more than
tenfold compared to the year before
exceeding €900bn. This extraordinary
scale of activity was underpinned by
two major sales via the privatisation
programme of public assets regarding
the sale and leaseback of 28 public
buildings in Athens to Eurobank
Properties and NBG (National Bank
of Greece) Pangaia (€261m) and
the sale of Astir Hotel in Athens to
Saudi Arabian fund ACG (€400m).
Foreign interest in the Greek real
estate market is also reflected in the
recent acquisitions of majority stakes
into Eurobank’s and NBG’s property
investment subsidiaries for over
€800m. The reduction of property
transfer tax may also trigger some
interest amongst private investors
on the market, particularly for prime
properties.
graph 14
Germany
Graph source: Savills
Graph source: RCA, Savills
graph 15
Greece
graph 16
Ireland
Graph source: Savills
Ireland
2013 was a year of two halves in the
Irish investment market. Proceedings
began with approximately €240m of
investment property sale-agreed / in
legals, and a further €200m available
for purchase. By mid-year this had
translated into €610m of completed
deals – a 6% increase on turnover for
the entire year of 2012. Nonetheless,
there was a distinct up-shift in activity
during the second half of the year.
This was facilitated by a flow of new
supply onto the market and by the
sale of several large portfolios. By
year-end, total turnover surpassed
€1.9bn, the strongest performance in
rising prices and contracting yields.
Prime office yields in the Big 6
decreased by 10 to 20 basis points
to 4.6% on average. Similar to 2012
open-ended special funds represented
the largest group of buyers in 2013.
Foreign buyers invested less than the
year before, decreasing their share
of transactions to 33% from 46% in
2012.
For 2014 the investment market is
expected to remain highly dynamic.
Whilst the lack of prime product
continues to be a limiting factor,
activity in the core+ and value-added
segment is likely to increase further.
value terms since 2006. However, with
asset values having rebased in recent
years, the total number of transactions
rose to a new record in 2013. As in
the previous year, both the supply of
and demand for investment property
remained firmly fixed on the Dublin
market in 2013 with 94% of total
sales value accounted for by Dublin
transactions. We expect this trend to
continue in 2014 and anticipate that
total turnover will exceed €2.5bn.
PRIME YIELDS
END-YEAR OUTLOOK Offices: move in Retail: move in Industrial: move in
PRIME YIELDS
END-YEAR OUTLOOK Offices: move in Retail: move in Industrial: move in
PRIME YIELDS
END-YEAR OUTLOOK Offices: stable Retail: stable Industrial: stable
€0
€10,000
€20,000
€30,000
€40,000
€50,000
€60,000
2007 2008 2009 2010 2011 2012 2013 2014
million
H1 H2 Forecast
€0
€200
€400
€600
€800
€1,000
2007 2008 2009 2010 2011 2012 2013 2014
million
Annual turnover Forecast
€0
€500
€1,000
€1,500
€2,000
€2,500
€3,000
2007 2008 2009 2010 2011 2012 2013 2014*
million
H1 H2 Forecast
7. March 2014
savills.co.uk/research 07
Market report | European investment markets
Italy
Despite the low-growth economic
environment, the transaction volume
in 2013 was approximately €4bn,
137% more than the 2012 level. With
a cross-border share of about 74%
this recovery if mostly driven by foreign
buyers who have regained confidence
in a politically and economically stable
outlook for Italy. The country attracts
investors on both ends of the risk
spectrum. One the one side, sovereign
wealth funds from the Middle East
are buying trophy assets, like Qatar
Holding LLC, a unit of the Persian
Gulf emirate’s SWF, agreed to buy
some 40% of the Porta Nuova office
Netherlands
After a slow start into the year, activity
increased strongly in the second half,
also because of the sale of a number
of portfolios in both, the value-add
and opportunistic parts of the market.
By year end a total of €3.38bn was
transacted, a 27% increase y-o-y.
The office investment volume in 2013
totaled € 1.9bn, a 53% increase
y-o-y. A very significant share in the
office investment market concerned
portfolio transactions. The six largest
transactions concerned both value-
add and opportunistic properties and
totaled around € 700m.
Investments in retail totaled €615m
remaining 37% behind the 2012
figure. Main reason for this is a lack of
good quality retail stock for sale. New
developments are scarce and owners
are cautious in selling profitable
properties. In contrast, the industrial
and logistics market showed a
substantial growth and doubled in total
investment volume to €880m.
Yields have remained fairly stable in
2013, and in some subsectors, namely
prime offices and prime logistics,
contracted even further. This trend is
likely to continue in 2014, while the
increasing interest for value-add and
opportunistic will stabilise yields in
these markets.
graph 17
Italy
Graph source: RCA
Graph source: Savills
graph 18
Netherlands
graph 19
Norway
Graph source: Heilo
Norway
The total investment volume is
expected to reach NOK37bn,
approximately 29% less than the
2012 level. In spite of lower volumes,
the investment market is regarded
to be relatively healthy due to a high
number of transactions spread over
all the major cities and more small-
and medium-sized transactions.
Futhermore, the financing situation has
eased through lower lending margins
and a leverage level of 65-70%.
Closed-end funds and unlisted
property companies were the most
aggressive buyers, whereas insurance
and pension funds accounted for 65%
development in Milan. On the other
hand, opportunistic funds are looking
at higher returns than those achievable
in the core markets. US-equity funds
such as Blackstone, that was one
of the most active buyers last year,
purchase office and retail assets.
Retail properties were the favoured
investment sector generally, at 47% of
total commercial transaction volume
(offices 41%) against a background of
weak demand for office space but a
relatively little indebted population.
Yields for prime office and retail
properties have stayed stable y-o-y
but softened slightly in the secondary
markets.
of the sellers. Offices and retail were
the favoured sectors (70% of the total),
with several large-scale transactions of
shopping centres taking place, among
these the portfolio acquisition of four
shopping centres for NOK2bn by a JV
buyer, partly owned by Swiss Partners
Group. Buyers are still focussing on
low risk investments, i.e. properties on
long term leases with low risk tenants
located in attrative areas. Investment
opportunities that do not meet all these
requirements may prove hard to sell
and if sold only at yield levels in excess
of 8-10%. Prime office and retail yields
have moved in slightly, by 30bps each
compared to Q4 12.
PRIME YIELDS
MID-YEAR OUTLOOK Offices: stable Retail: stable Industrial: stable
PRIME YIELDS
MID-YEAR OUTLOOK Offices: stable Retail: stable Industrial: NA
PRIME YIELDS
MID-YEAR OUTLOOK Offices: stable Retail: stable Industrial: move in
€0
€1,000
€2,000
€3,000
€4,000
€5,000
€6,000
€7,000
€8,000
2007 2008 2009 2010 2011 2012 2013
Annual turnover
€0
€2,000
€4,000
€6,000
€8,000
€10,000
€12,000
2007 2008 2009 2010 2011 2012 2013 2014
million
H1 H2 Forecast
€0
€2,000
€4,000
€6,000
€8,000
€10,000
2007 2008 2009 2010 2011 2012 2013 2014*
million
Annual turnover Forecast
8. March 2014
savills.co.uk/research 08
Market report | European investment markets
Poland
The investment activity in 2013 was
relatively high, with the total volume
reaching €3.3bn, a 21% growth
year-on-year. Even higher growth was
visible in the number of transactions
that reached 63 compared to 42 in
the year before. Investor appetite in
2013 was high for prime assets, and
the retail properties were dominant.
We anticipate, that interest in prime
assets will continue this year, however,
the office sector is more likely to play a
dominant role. Investment activity was
also high in the warehouse sector with
ca. 18% share in the total investment
volume. We believe this trend will be
Spain
The positive economic outlook for
2014 has improved international
investors’ confidence, putting Spain
back on their investment maps. In
2013, the investment volume was
slightly over €2.5bn, an increase of
12% year-on-year. Cross-border
investors made up almost 80% of
the total, a strong growth compared
with the average of 40% in the recent
years. Most of these are European
and had been active players in the
market before the crisis. Among the
newcomers, big fortunes from Latin
America deserve a special mention.
The largest deal of the year was the
acquisition of almost 300 Sabadell
bank branch units by Fibra Uno
(Mexico) for €300m.
The retail segment concentrated once
again the largest share of the total
investment volume. After two years
around 30% it was close to 50% in
2013.
The prime assets in each market
segment are the more demanded
products, but also the least available
ones. This situation could push the
yield levels down, in any case they
would still remain above the European
average.
graph 20
Poland
Graph source: Savills
Graph source: Savills
graph 21
Spain
graph 22
Sweden
Graph source: Savills
Sweden
The total investment turnover, including
all segments, amounted to SEK99
bn, which was slightly lower than the
previous year with an 8% drop. The
market has continued to be largely
dominated by domestic buyers, with
foreign investors representing 14 % of
buyers. The low cross-border activity
is not a result of a lack of international
interest, but rather that international
investors have been unable to
compete for the most attractive office
assets, though they have had some
success regarding retail and logistics.
However, the drop in turnover is
not to be regarded as a sign of a
maintained in 2014.
Acquisitions by German and Austrian
investors accounted for ca. 47% of
the total annual volume. US investors
are the second most active group
of buyers with a 11% share in the
investment volume. Domestic investors
accounted for ca. 9% of the 2013
volume, slightly below the 2012 share
(10%).
Prime yields remained stable, but with
limited demand for secondary assets
the gap between prime and secondary
yields widened.
We believe, that positive investor
sentiment will be maintained this year.
weaker market, as the investment
intensity, measured as the number
of transactions carried through,
increased by 13 %. The increased
number of transactions is most likely a
direct result of the improved situation
regarding property financing, where the
banks are becoming increasingly more
active. Prime assets remain in high
demand and the shortage of properties
on the market is likely to keep prime
yields stable at historically low levels. A
shortage of prime assets could lead to
a decreased yield gap between prime
and secondary and also that financing
might become more accessible for
secondary assets as well.
PRIME YIELDS
END-YEAR OUTLOOK Offices: stable Retail: stable Industrial: stable
PRIME YIELDS
END-YEAR OUTLOOK Offices: stable Retail: stable Industrial: move in
PRIME YIELDS
END-YEAR OUTLOOK Offices: move in Retail (SC): move in Industrial: move out
€0
€500
€1,000
€1,500
€2,000
€2,500
€3,000
€3,500
2007 2008 2009 2010 2011 2012 2013 2014
million
H1 H2 Forecast
€0
€2,000
€4,000
€6,000
€8,000
€10,000
€12,000
2007 2008 2009 2010 2011 2012 2013 2014
million
H1 H2 Forecast
€0
€2,000
€4,000
€6,000
€8,000
€10,000
€12,000
€14,000
2007 2008 2009 2010 2011 2012 2013 2014
million
H1 H2 Forecast
9. March 2014
savills.co.uk/research 09
Market report | European investment markets
Key investment indicators
GDP growth, prime rental growth1
, prime yields and yield shift2
in Q4 2013
Note 1: Rental growth is
annual and calculated in
local currencies
Note 2: Prime yield shift is
annual - in basis points
Note 3: GDP is national,
growth is annual and it
is the Oxford Economics
forecast for the year 2014.
Note 4: SC=Regional
Shopping Centre. Rental
growth refers to prime
standard unit of approx
100sqm
Note 5: London offices
refer to West End
City
GDP
growth
2014 (f)3
Office
rental
growth
Office
yield
Office
yield
shift
Industrial
rental
growth
Industrial
yield
Industrial
yield
shift
SC4
rental
growth
SC yield
SC yield
shift
Amsterdam 0.2% 0.0% 5.25% -35 0.0% 7.5% -25 0.0% 6.5% 0
Athens -0.5% -14.3% 8.75% 0 0.0% 11.0% -100 -0.0% 8.5% -50
Berlin 1.5% 5.2% 4.7% -10 NA NA NA 0.0% 4.9% 0
Brussels 1.0% 0.0% 5.1% -15 4.4% 7.4% -10 0.0% 5.4% -10
Dublin 1.7% 16.1% 5.75% -100 NA 8.75% -25 NA 6.0% -150
Dusseldorf 1.5% 5.8% 4.7% -20 NA 6.4% -10 20.0% 5.3% 0
Frankfurt 1.5% 5.6% 4.5% -20 NA NA NA 0.0% 4.9% 0
Hamburg 1.5% -2.0% 4.5% -10 NA 6.6% -20 NA NA NA
London5
2.4% 0.0% 3.25% -25 6.0% 5.75% -50 2.6% 5.0% -25
Madrid 0.7% 1.0% 6.0% 0 NA NA NA 0.0% 6.75% 0
Milan 0.3% -7.7% 6.25% 0 NA NA NA 0.0% 7.15% 15
Munich 1.5% 1.9% 4.25% 0 NA 6.8% 0 NA 4.9% -10
Oslo* 2.1% 6.1% 5.2% -30 0.0% 6.5% 0 0.0% 5.2% -30
Paris 0.5% -3.4% 4.0% -25 3.9% 7.5% -25 0.0% 4.75% -25
Stockholm 2.0% 4.4% 4.5% -25 5.9% 6.5% 0 0.6% 5.25% 0
Vienna** 1.5% -7.1% 5.13% -12 -1.3% 7.0% -50 0.0% 5.75% 0
Warsaw 2.8% -9.8% 6.0% 0 NA 7.5% 0 0.0% 5.75% 0
Source: Savills / *Heilo/ **EHL
UK
The total transactional volume in 2013
was £54bn, a 57% increase year-on-
year. This made 2013 one of the most
active years in the last 20 years, and
only around £4bn behind the most
recent peak that was reached in 2006.
London continued to be the most
popular market, with £20bn in 2013,
and a total of nearly £30bn in the
Greater London market.
However, the big change in 2013 was
in investor interest in the markets
outside London, with the proportion
of total investment that was spent in
the regions rising from 41% to 45% in
2013.
Non-domestic investors were by far
the most active grouping in central
London, accounting for 71% of all
acquisitions, and 90% of all acquisition
above £100m. They were also more
active outside London, accounting for
a quarter of all non-London deals
Prime yields continued to harden
in 2013, and we estimate that as at
the end of 2013 the average prime
property yield in the UK had fallen to
5.16% from 5.5% at the start of the
year. We expect 2014 to see a closing
of the gap between London and the
regions, as well as between prime and
secondary assets.
PRIME YIELDS
END-YEAR OUTLOOK Offices: stable Retail: stable Industrial: move in
graph 23
UK
€0
€10,000
€20,000
€30,000
€40,000
€50,000
€60,000
€70,000
€80,000
€90,000
2007 2008 2009 2010 2011 2012 2013 2014
million
H1 H2 Forecast
Graph source: Savills
10. March 2014
savills.co.uk/research 010
Market report | European investment markets
Savills European team
Please contact us for further information
Savills plc
Savills is a leading global real estate service provider listed on the London Stock Exchange. The company established in 1855, has a rich heritage with unrivalled growth. It is a company
that leads rather than follows, and now has over 500 offices and associates throughout the Americas, Europe, Asia Pacific, Africa and the Middle East.
This report is for general informative purposes only. It may not be published, reproduced or quoted in part or in whole, nor may it be used as a basis for any contract, prospectus,
agreement or other document without prior consent. Whilst every effort has been made to ensure its accuracy, Savills accepts no liability whatsoever for any direct or consequential loss
arising from its use. The content is strictly copyright and reproduction of the whole or part of it in any form is prohibited without written permission from Savills Research.
Eri Mitsostergiou
European Research
+31 (0) 20 301 2087
emitso@savills.com
Lydia Brissy
European Research
+33 (0) 1 44 51 73 88
lbrissy@savills.com
Julia Maurer
European Research
+44 (0) 20 7016 3833
jmaurer@savills.com
Savills Local Research teams
Mat Oakley
Research UK
+44 (0) 20 7409 8781
moakley@savills.com
Matthias Pink
Research Germany
+49 (0) 30 726 165 134
mpink@savills.de
Marie Josée Lopes
Research France
+33 (0) 1 44 51 17 50
mjlopes@savills.fr
Gema de la Fuente
Research Spain
+34 (91) 310 1016
gfuente@savills.es
Peter Wiman
Research Sweden
+46 (8) 545 85 462
pwiman@savills.se
Jeroen Jansen
Research Netherlands
+31 (0) 20 301 2094
j.jansen@savills.nl
John McCartney
Research Ireland
+353 (0) 1 618 1427
John.McCartney@savills.ie
Michal Stepien
Research Poland
+48 (0) 22 222 40 39
mstepien@savills.pl
Associate offices
Stefan Wernhart
EHL - Research Austria
+43 (0) 1 512 76 90 16
s.wernhart@ehl.at
Jeremy Lecomte
Research Belgium-Lux
+32 2 542 40 57
jlecomte@savills.be
Gianni Flammini
Italy
+39 02 3600 6741
gflammini@savills.it
Leif-Erik Halleen
Heilo Eiendom - Norway
+47 90 89 92 96
leh@heilo.no
Dimitris Manoussakis
Greece
+30 210 6996311
dman@savills.gr
Marcus Lemli
European Investment
+49 (0) 69 273 000 11
mlemli@savills.de