Download to read offline

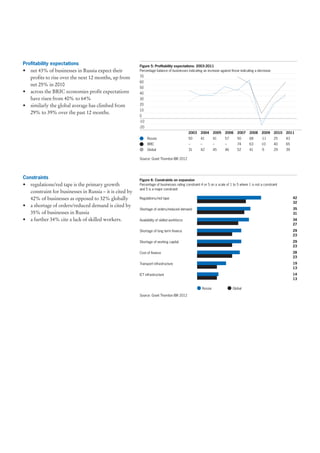
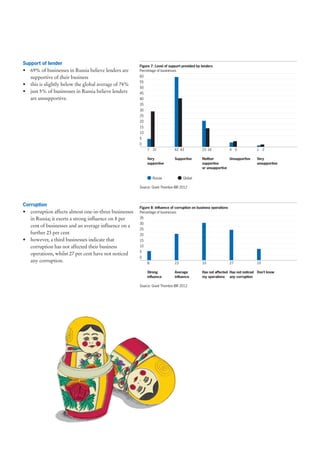

The Grant Thornton International Business Report (IBR) surveys over 11,500 businesses globally each year. The 2012 report focuses on Russian businesses and their outlook. It found that while the Russian economy grew 4.2% in 2011, businesses were slightly less optimistic than in 2010. Regulations and red tape were cited as major constraints. Optimism around employment, revenues and profits improved in 2011 but dipped in the last quarter compared to earlier in the year.


